
Profiler Configuration
Profiler Configuration sets the platform-wide defaults the profiler applies before any individual profiler workflow runs:- Which metrics it computes for each column data type
- Whether it stores or reads sample data
- Purpose: Set which profiler metrics run by default, per data type, and whether sample data is stored or read.
- Benefits: Gives every new profiler workflow across every team a consistent, already-tuned baseline instead of reconfiguring the same metrics from scratch.
How to Access
Click the Profile icon and navigate to Settings > Preferences > Profiler Configuration.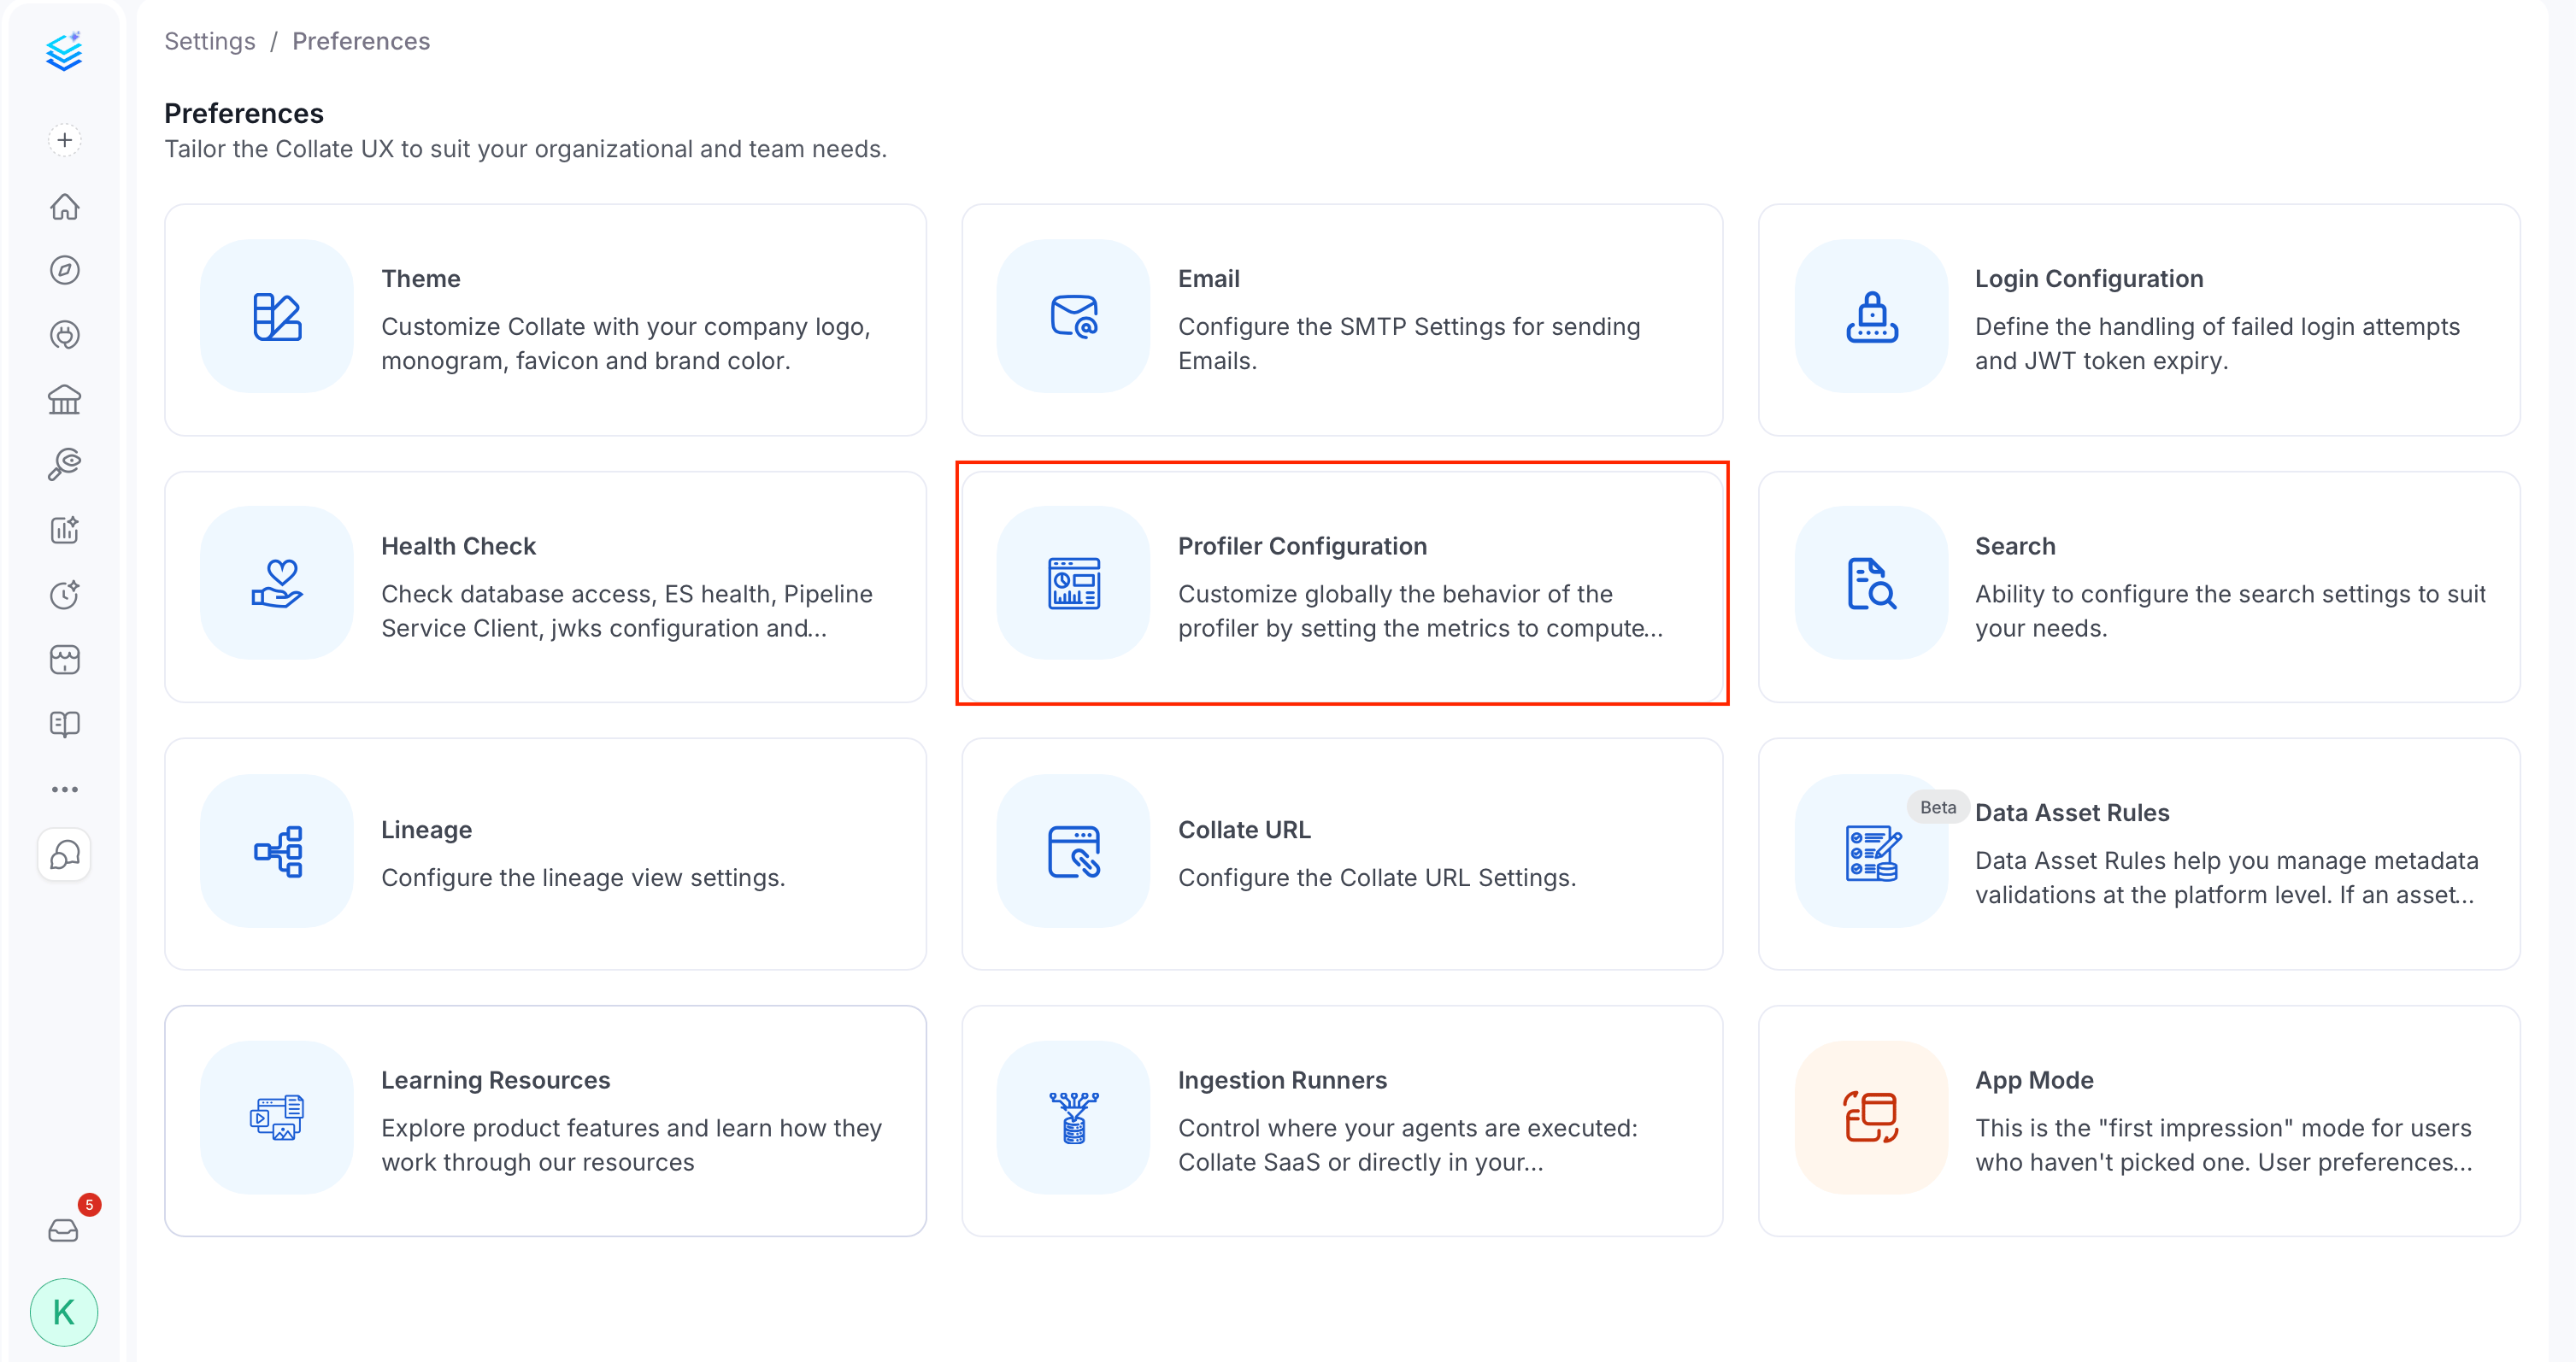
Metric Configuration
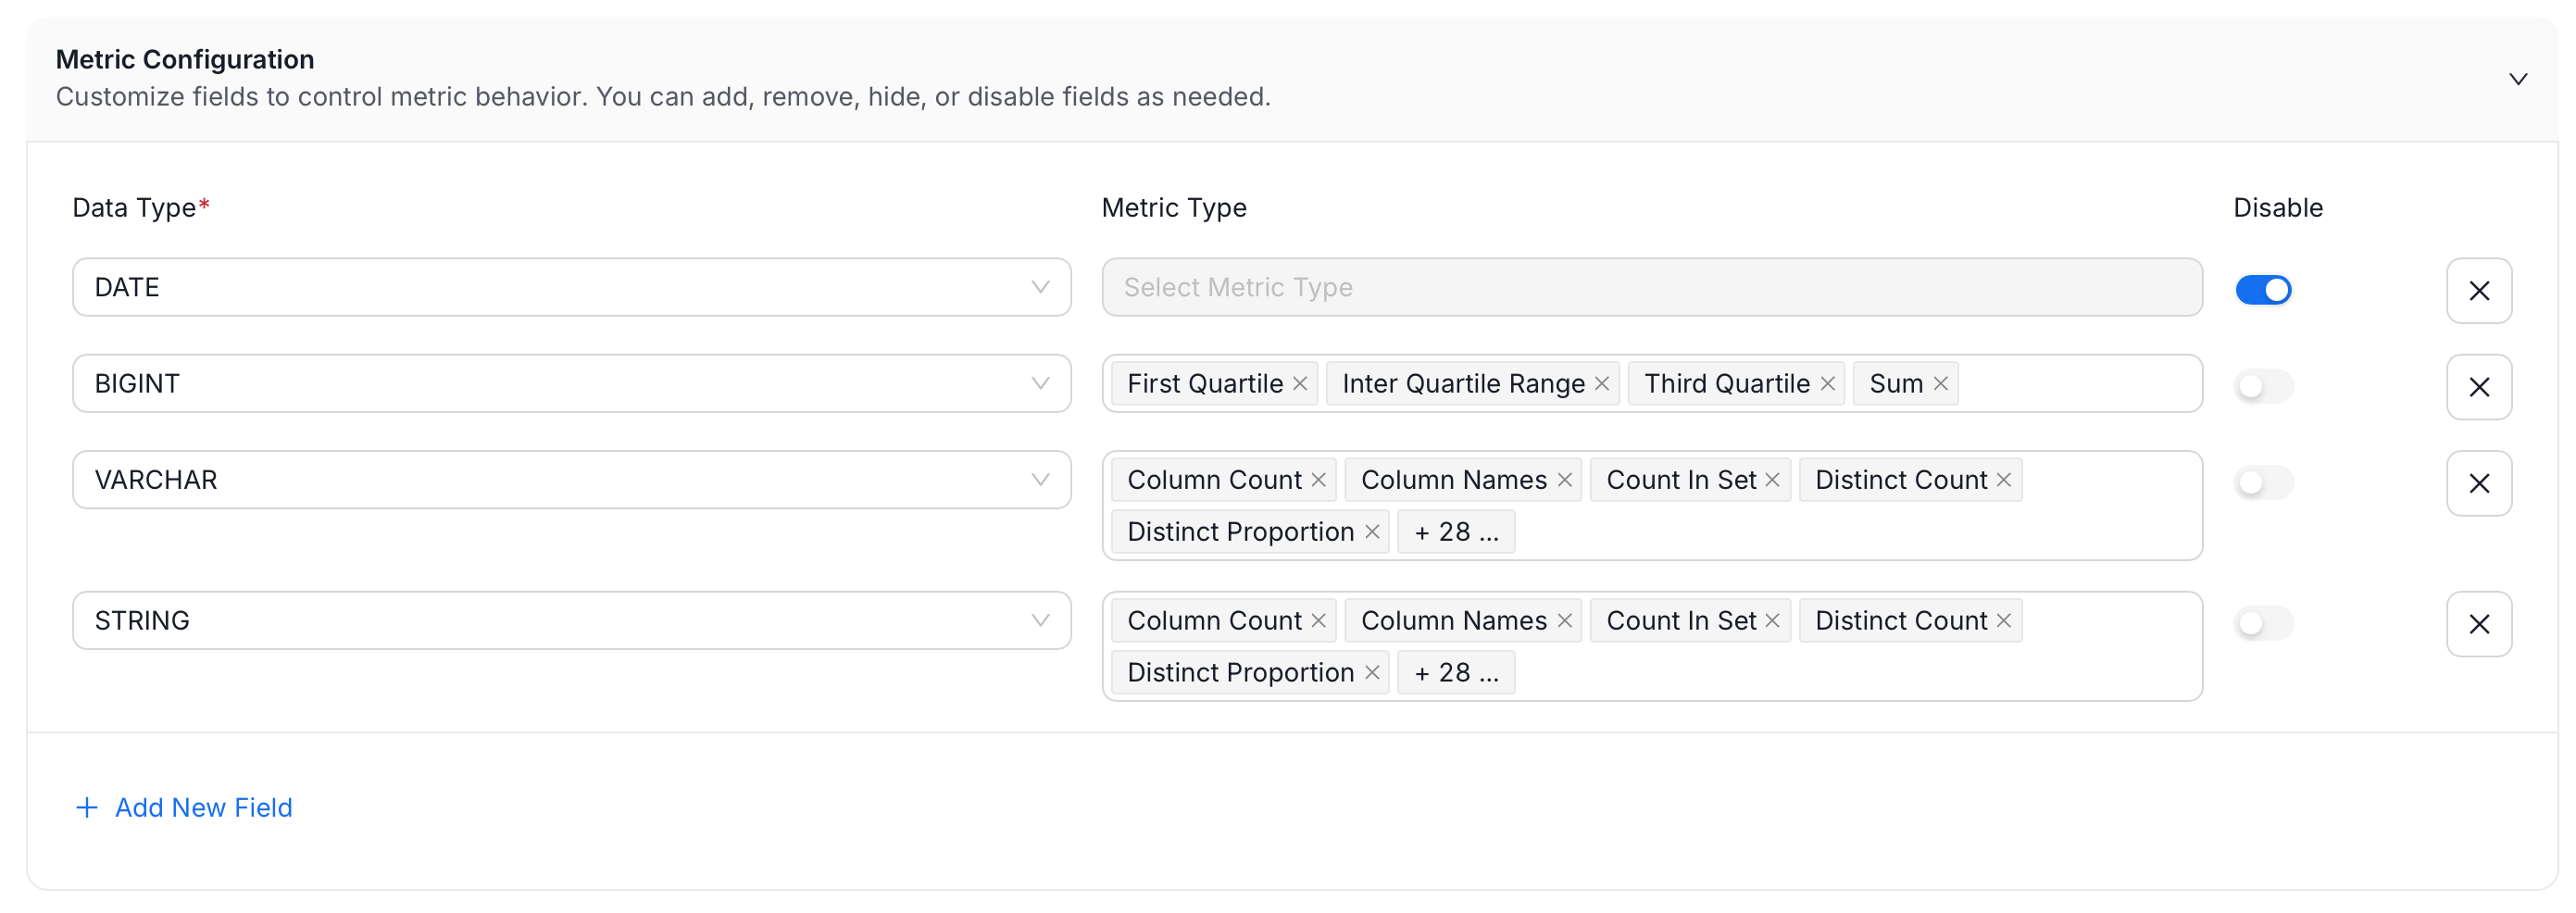
By default, the profiler computes every available metric for every column. Metric Configuration lets you turn specific metrics off per data type, which is useful when:- A metric doesn’t make sense for that type, such as computing a mean on a string column
- You want to keep profiling fast on very wide tables by skipping metrics your team doesn’t act on
- Click Add Field.
- Choose a Data Type, for example
INT,STRING, orTIMESTAMP. Each data type can only be configured once. - Choose which Metric Type(s) to disable for that data type, or leave it on All to disable every metric for that type.
- Use the Disable toggle to turn the whole row off without deleting it.
Sample Data Ingestion Configuration
Sample data lets users preview real rows from a table directly in Collate, which is convenient for spotting data quality issues at a glance, but it also means row-level data is brought outside the source system.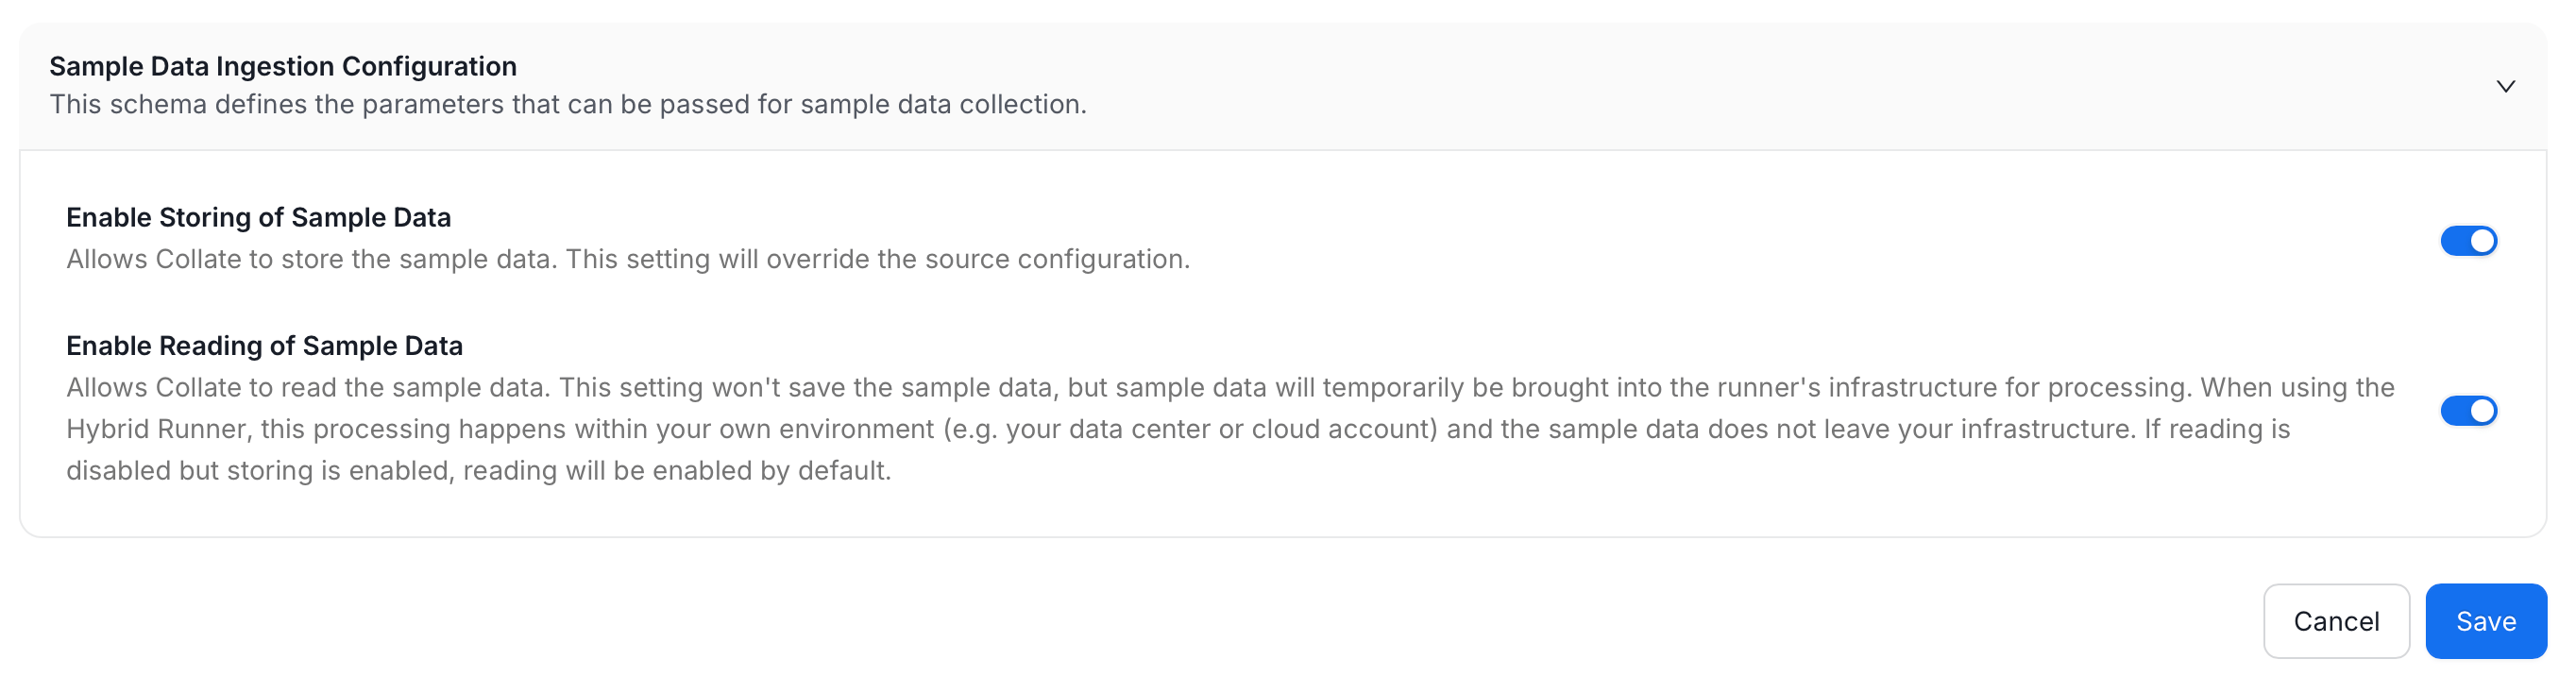
-
Set the toggles to decide whether that trade-off is acceptable platform-wide:
- Click Save to apply your changes.
Spark Agent Configuration
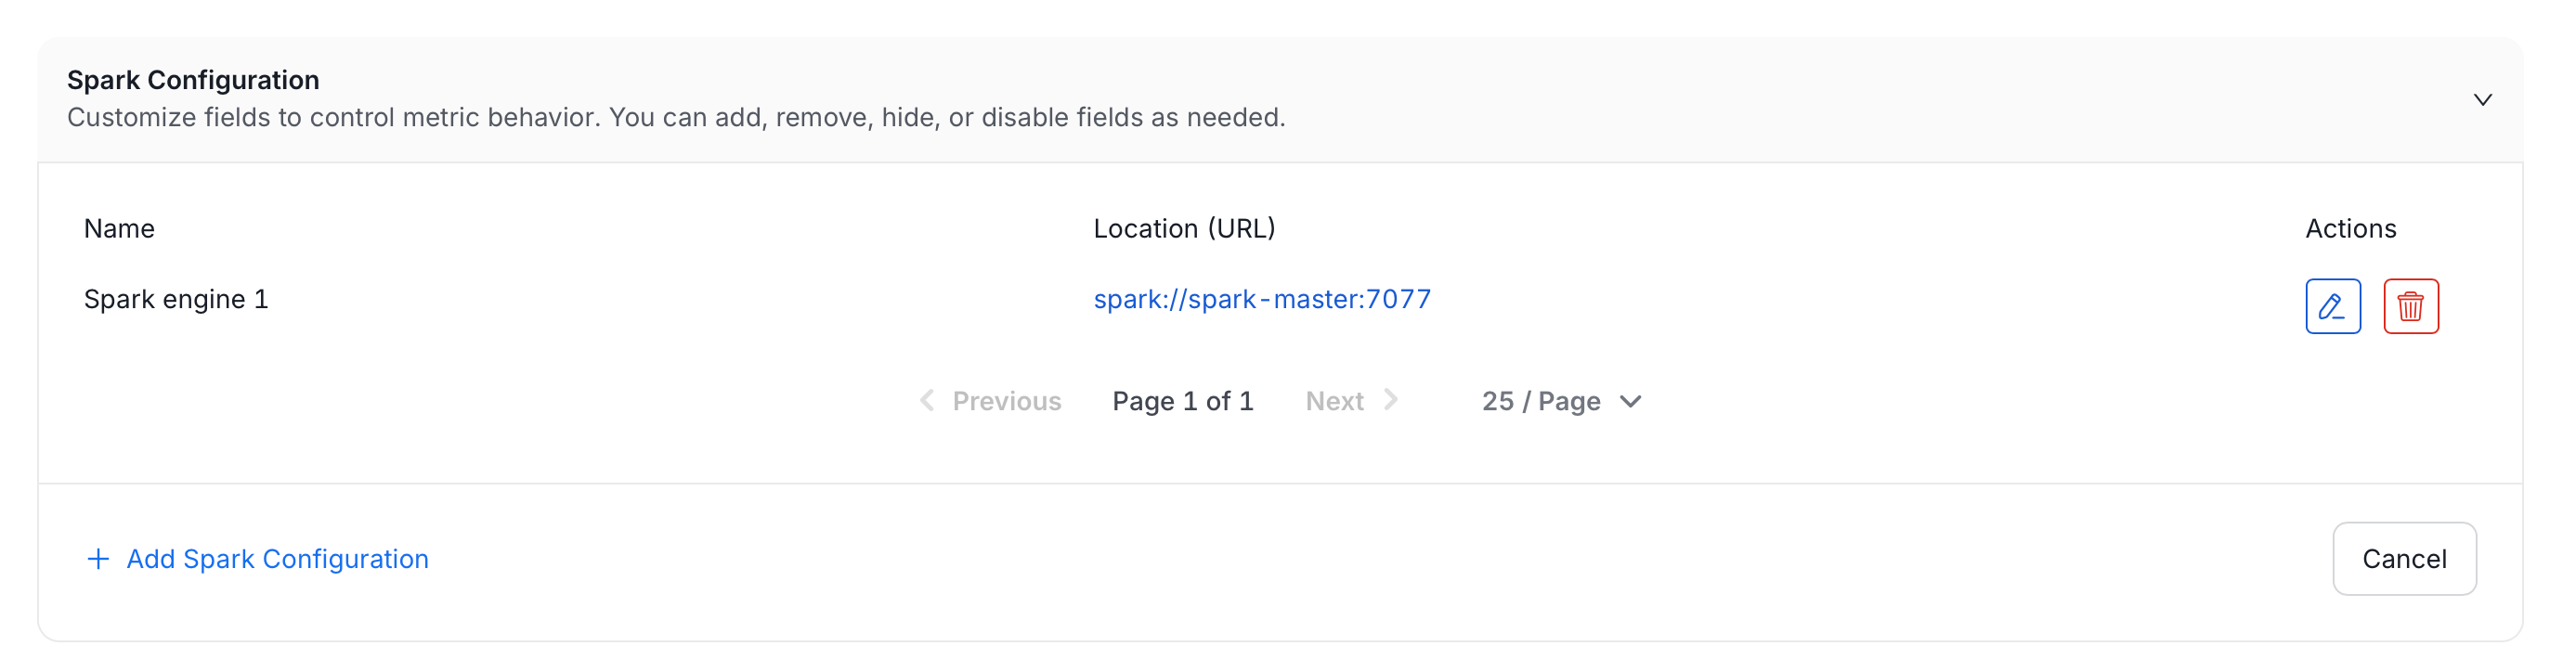
If your deployment uses the Spark profiling engine, this page also shows a Spark Configuration panel. It’s a UI alternative to hand-editing theprocessingEngine block in your profiler YAML, described in Spark Engine External Configuration: register the Spark Connect endpoint once here, then point any profiler pipeline at it by name instead of repeating the same connection details in every YAML file.
-
Click Add Spark Configuration.
-
Set the following fields:
- Name: Required. A unique identifier for this configuration, referenced from profiler pipelines. Can’t be changed after creation.
- Display Name: Optional, friendlier label shown in the list.
- Description: Optional.
- Spark Remote URL: Required. The Spark Connect endpoint, for example
sc://your_spark_connect_host:15002. Corresponds toremotein the YAML configuration. - Temporary Path: Shared path Spark writes intermediate profiling data to. Must be reachable by every node in the Spark cluster, such as S3, HDFS, or a mounted network drive. Default:
/tmp/openmetadata. Corresponds totempPathin the YAML configuration. - Additional Spark Configuration: Optional key-value pairs passed through to the Spark session. Click the + button to add a row. Corresponds to
extraConfigin the YAML configuration.
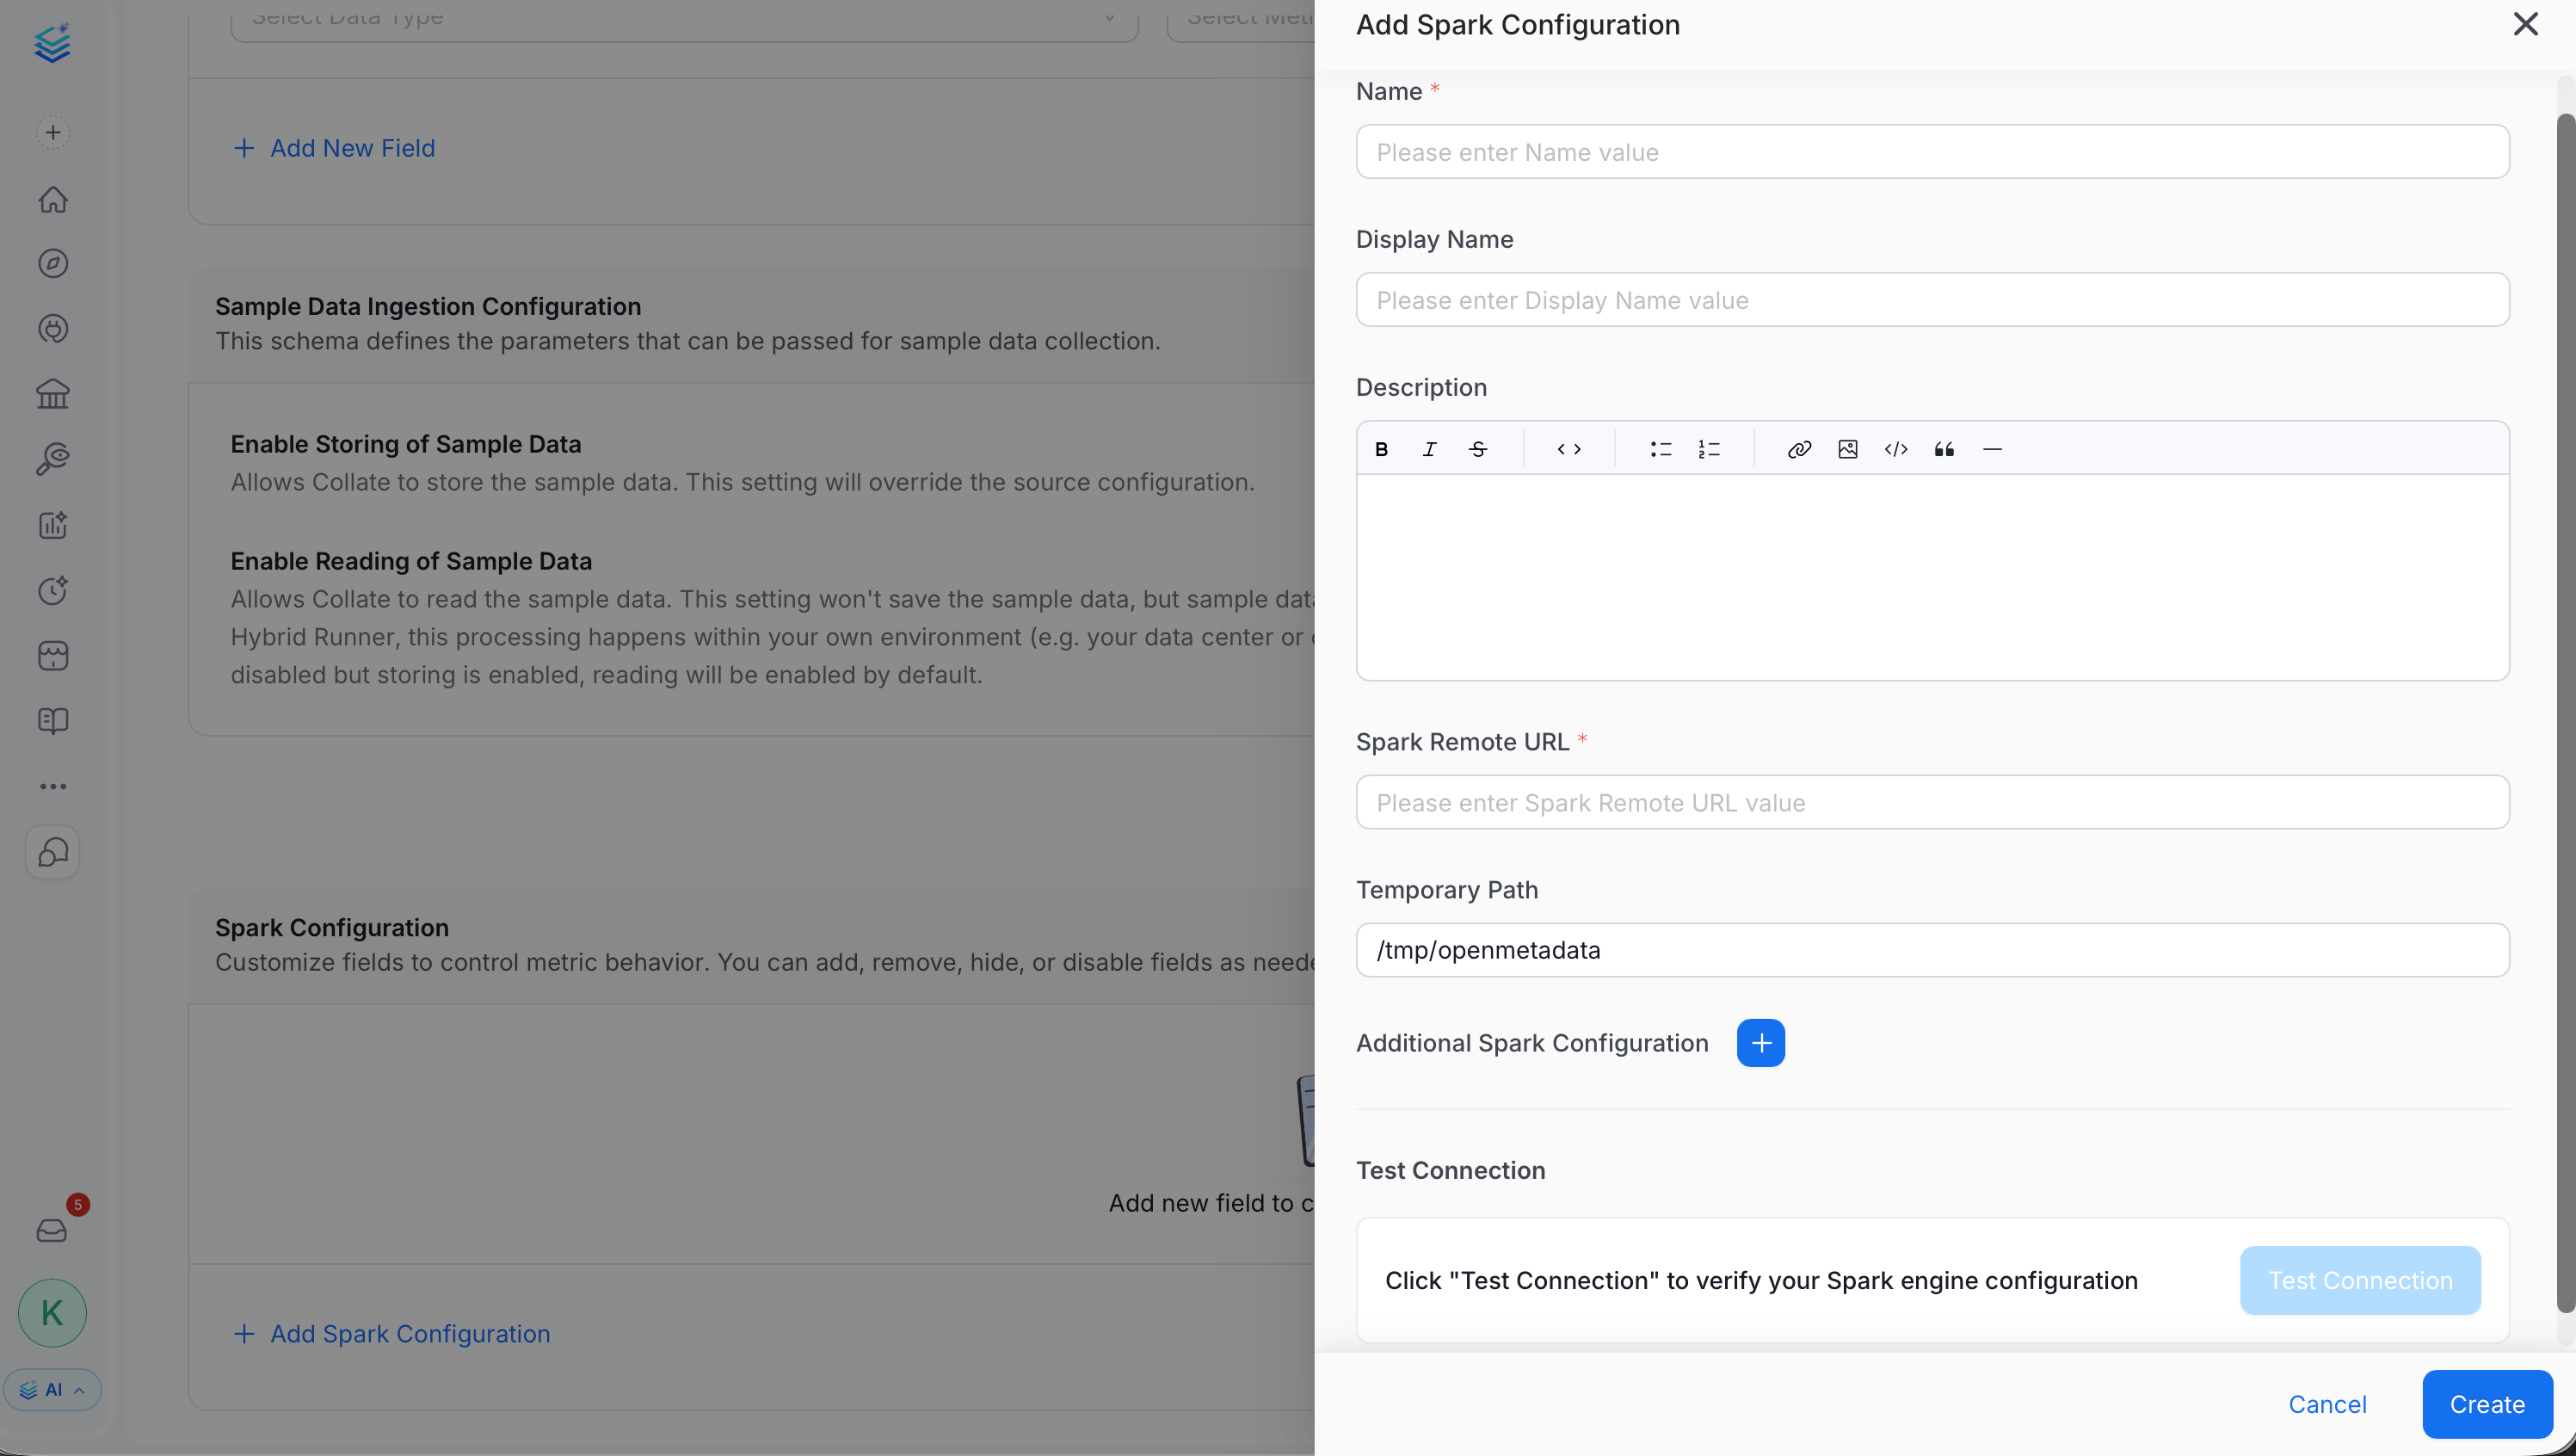
- Click Test Connection to verify Collate can reach the Spark Remote URL. This runs an actual connectivity check and can take a few minutes. It fails automatically if it doesn’t complete within three minutes.
- Click Create.
Each Spark configuration you register here is stored as an Ingestion Runner, alongside Hybrid Runners, just filtered out of that page’s list since the two serve different purposes.