
Billing and Usage
Every AI-powered feature in Collate (Collate AI Chat, AI Agents, Dynamic Agents, and AI Automations) draws from a shared pool of AI credits. The Billing & Usage page gives administrators a complete view of that pool: How much has been used, who’s using it, and what to do when it runs low.Access Billing & Usage
To access the Billing & Usage page, click the Profile icon and navigate to Settings > Billing.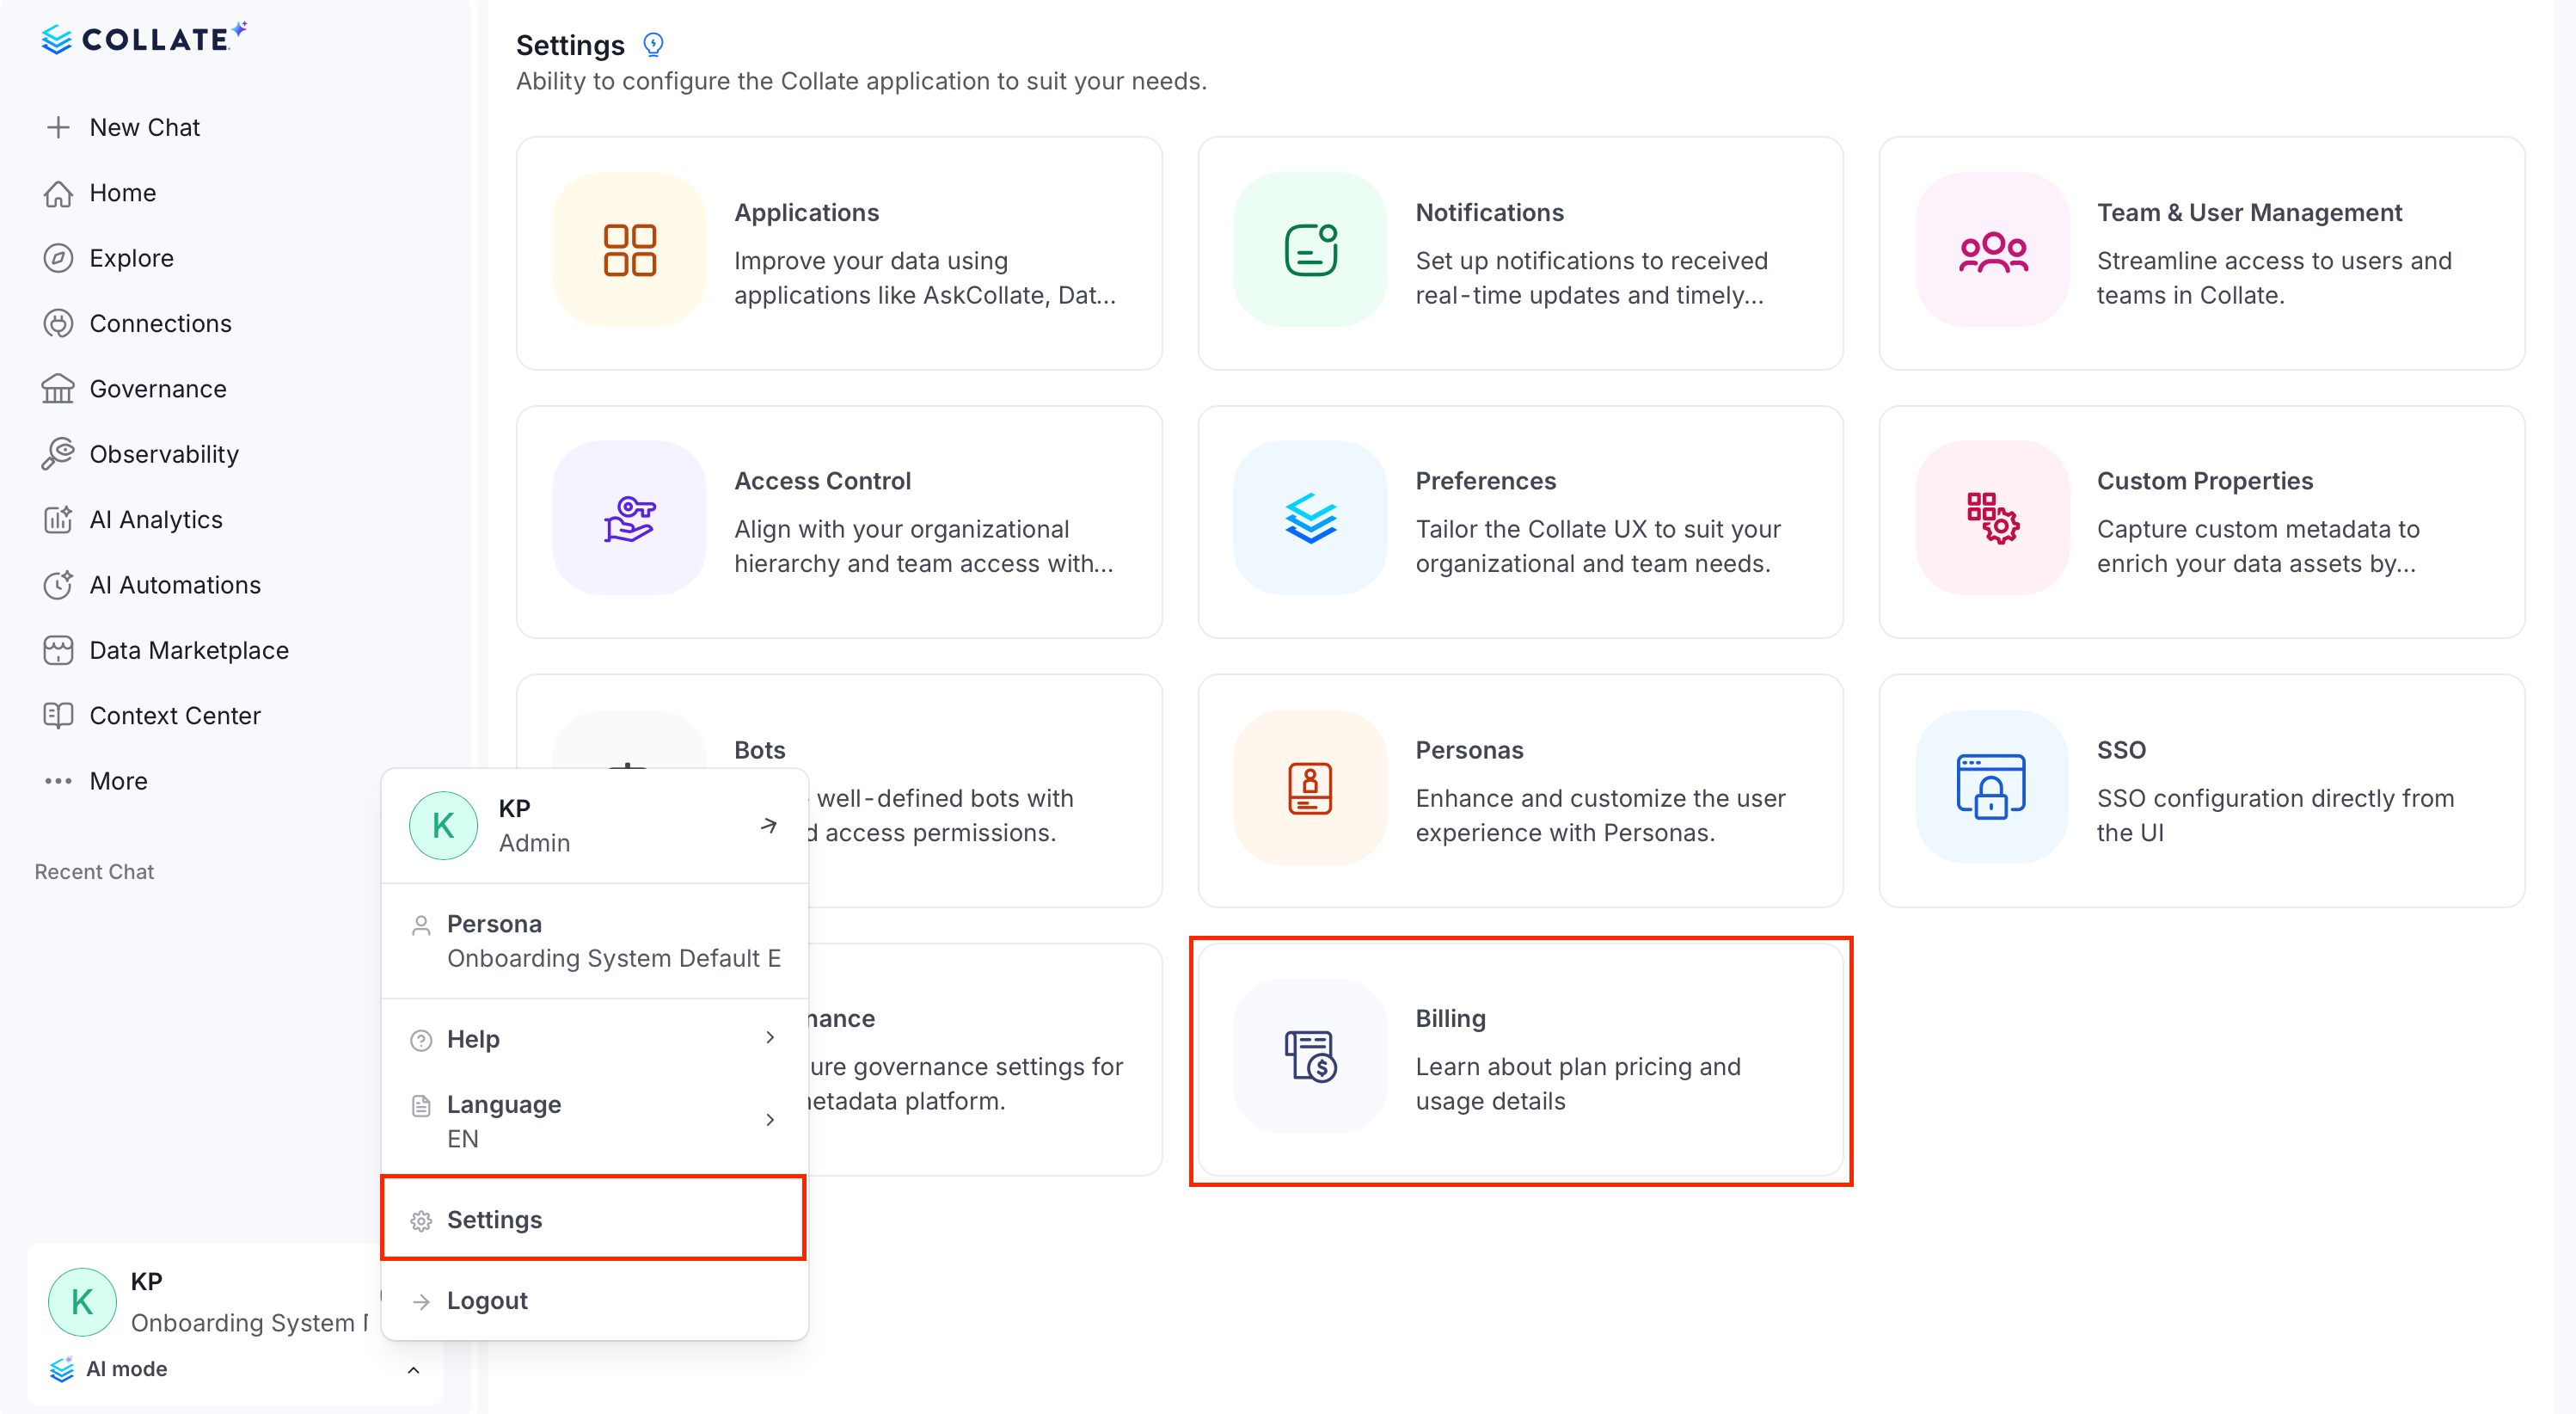
How Credits Are Calculated
Credits measure the real cost of an AI call, not just the number of tokens it used. Collate weights each token type by how much it actually costs:
1 credit covers a request’s input, cached, and output tokens, weighted by the model that served it. A typical Collate AI question costs ~0.5–2.0 credits; multi-step agent tasks (search, SQL analytics, edits) use more.
What Consumes Credits
AI credits are consumed by:- Collate AI Chat, from any channel (web, Slack, Teams).
- The natural-language search bar.
- AI Agents and Dynamic Agents.
- AI Automations. These currently draw from the same shared pool as everything else. There’s no separate budget set aside for automations.
Permissions
Billing and AI Credits is visible only to workspace administrators. There’s currently no personal “my usage” view for other users. The only thing they see is the low-credit or exhausted warning banner in Collate AI Chat.Billing and Usage Pages
To view Billing and Usage details, click the Profile icon, and navigate to Settings > Billing. It has one summary page and five detail pages: Overview, Product, User Adoption, AI Credits, MCP, plus a Weekly Impact digest, a Conversations page linked from AI Credits, and a Plans link that opens Collate’s public pricing page. There’s no in-app plan upgrade.Overall Summary
The Overview page is the landing page for Billing, giving you one snapshot of your plan and usage before you drill into a specific area: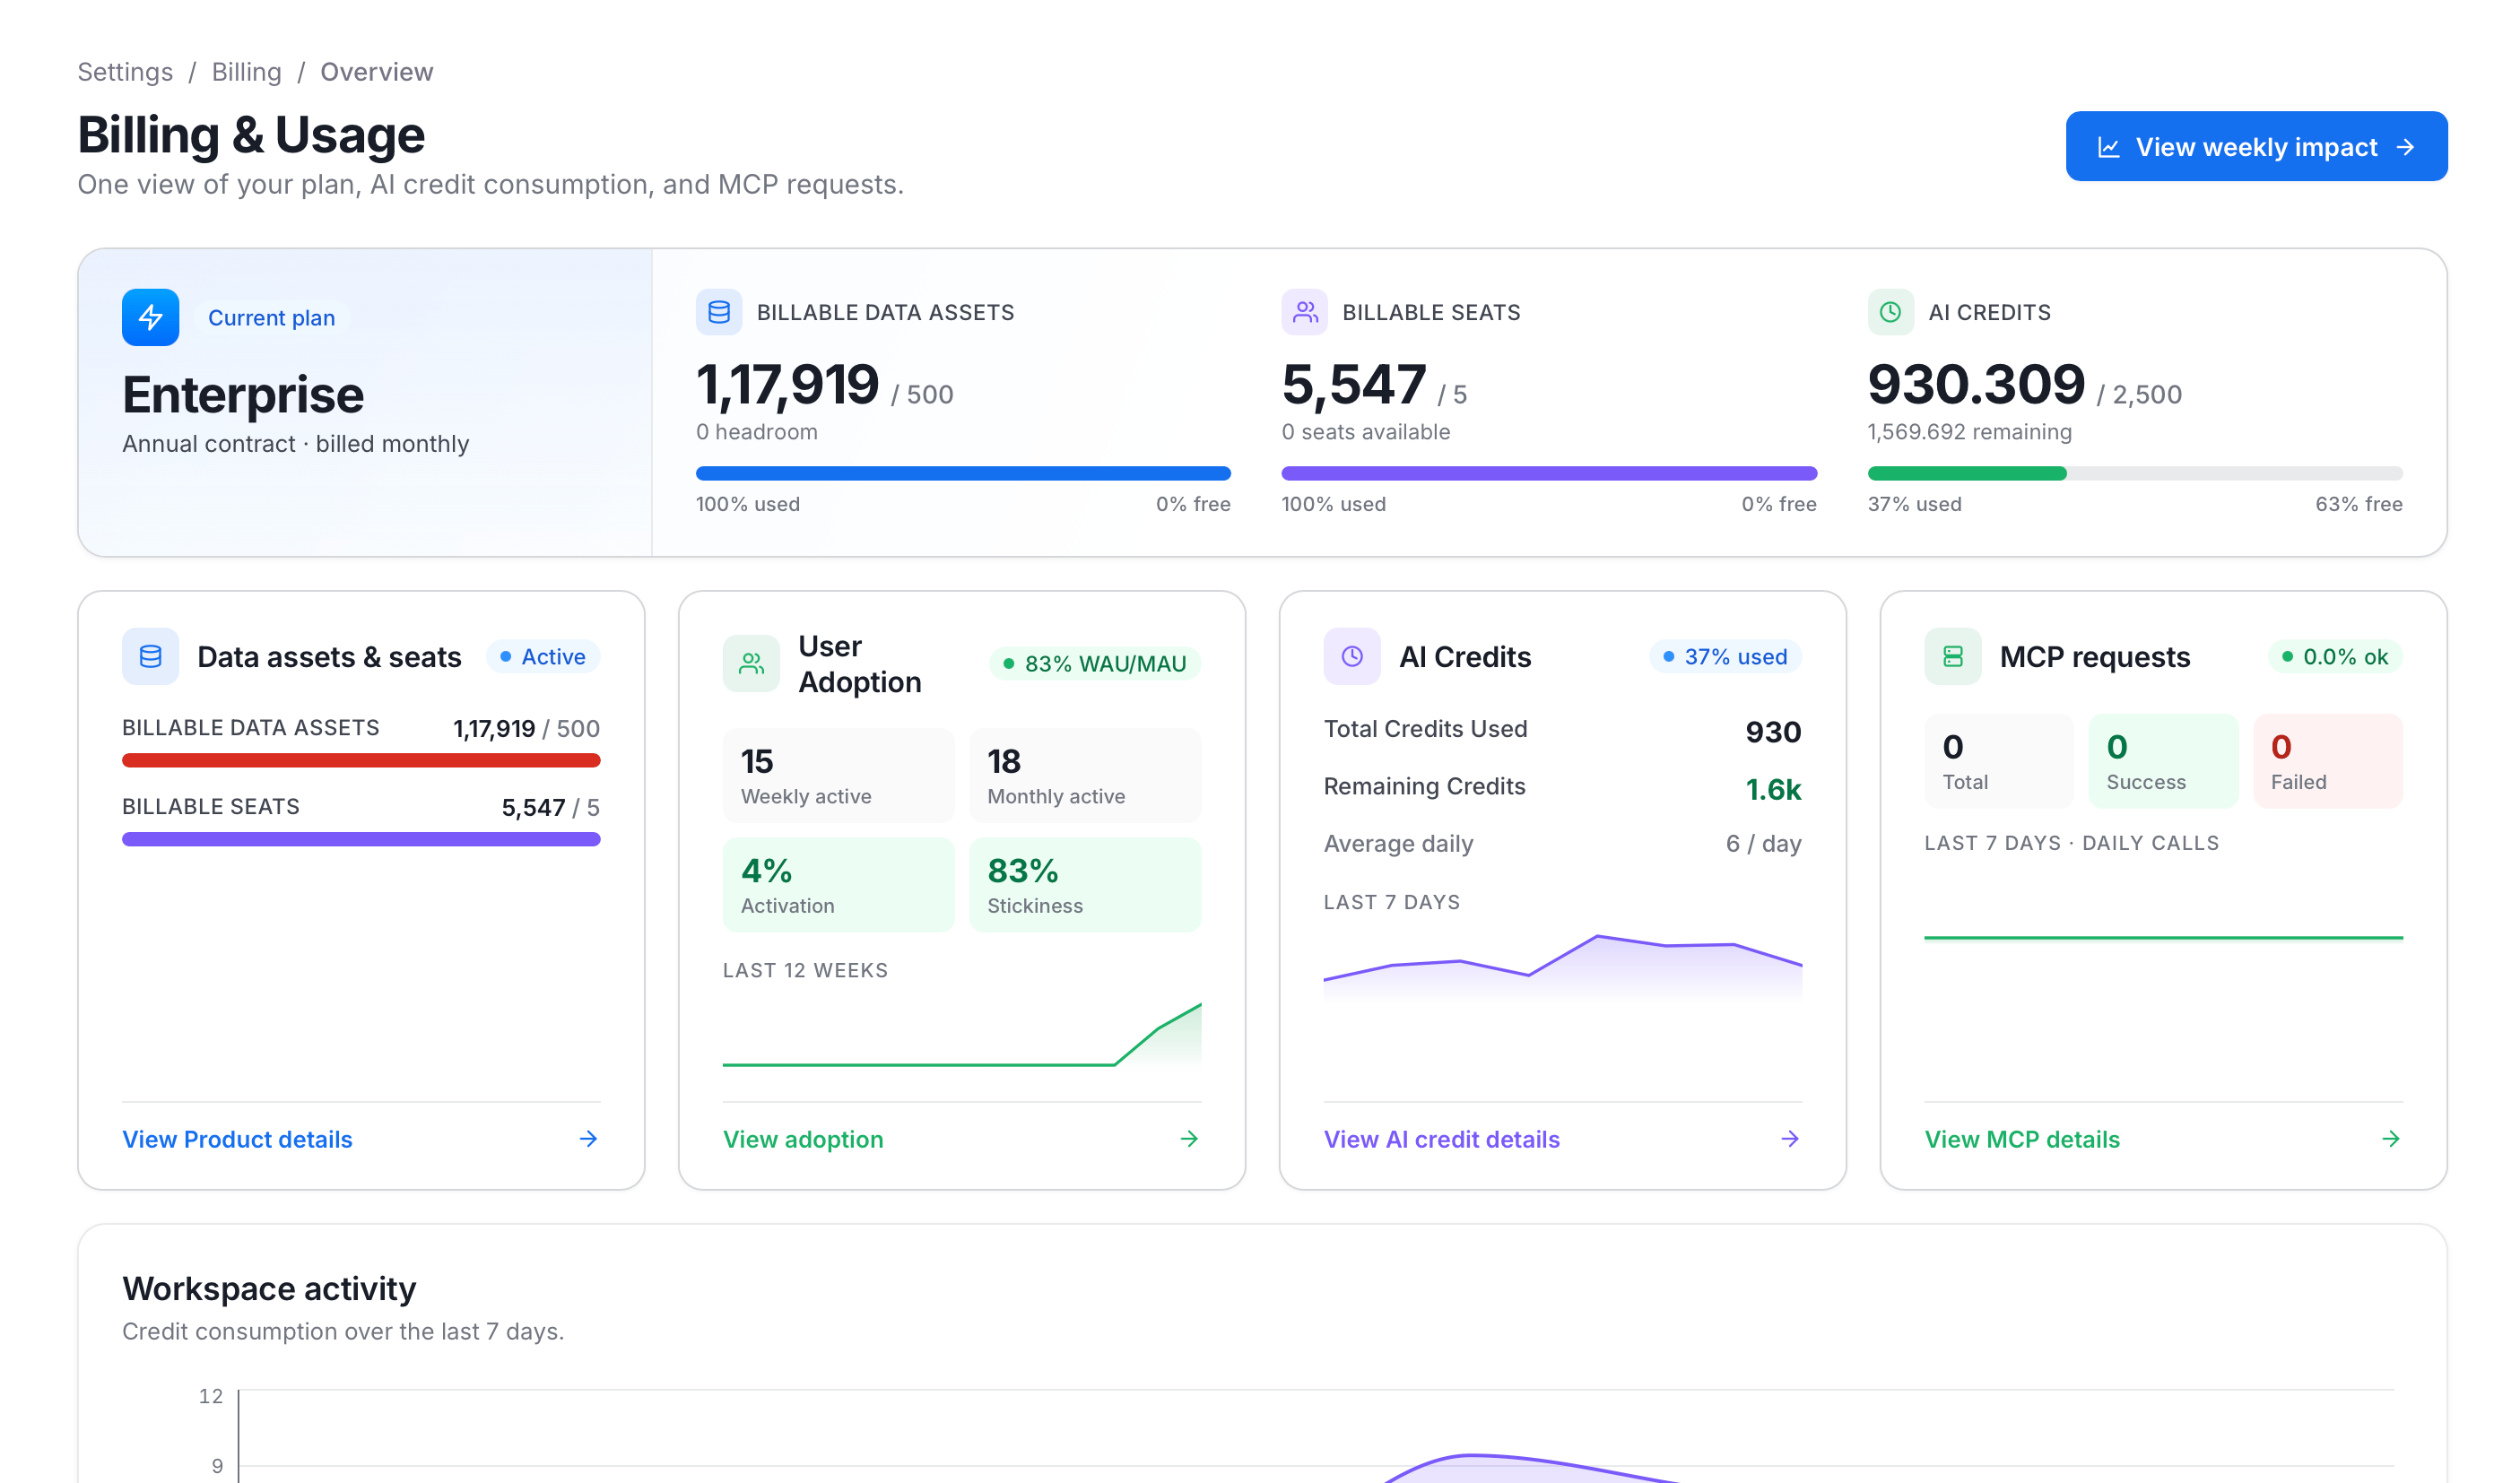
- A plan card showing your plan tier and billing cycle, with progress bars for how much of your data asset, seat, and credit limits you’ve used.
- Four section cards (Data Assets & Seats, User Adoption, AI Credits, and MCP Requests), each with a headline metric, a mini trend chart, and a link to that area’s full page.
- A Workspace Activity chart. See Workspace Activity below.
- A View weekly impact button, linking to the Weekly Impact digest.
Data Assets and Seats
The Product page covers everything your workspace consumes outside of AI: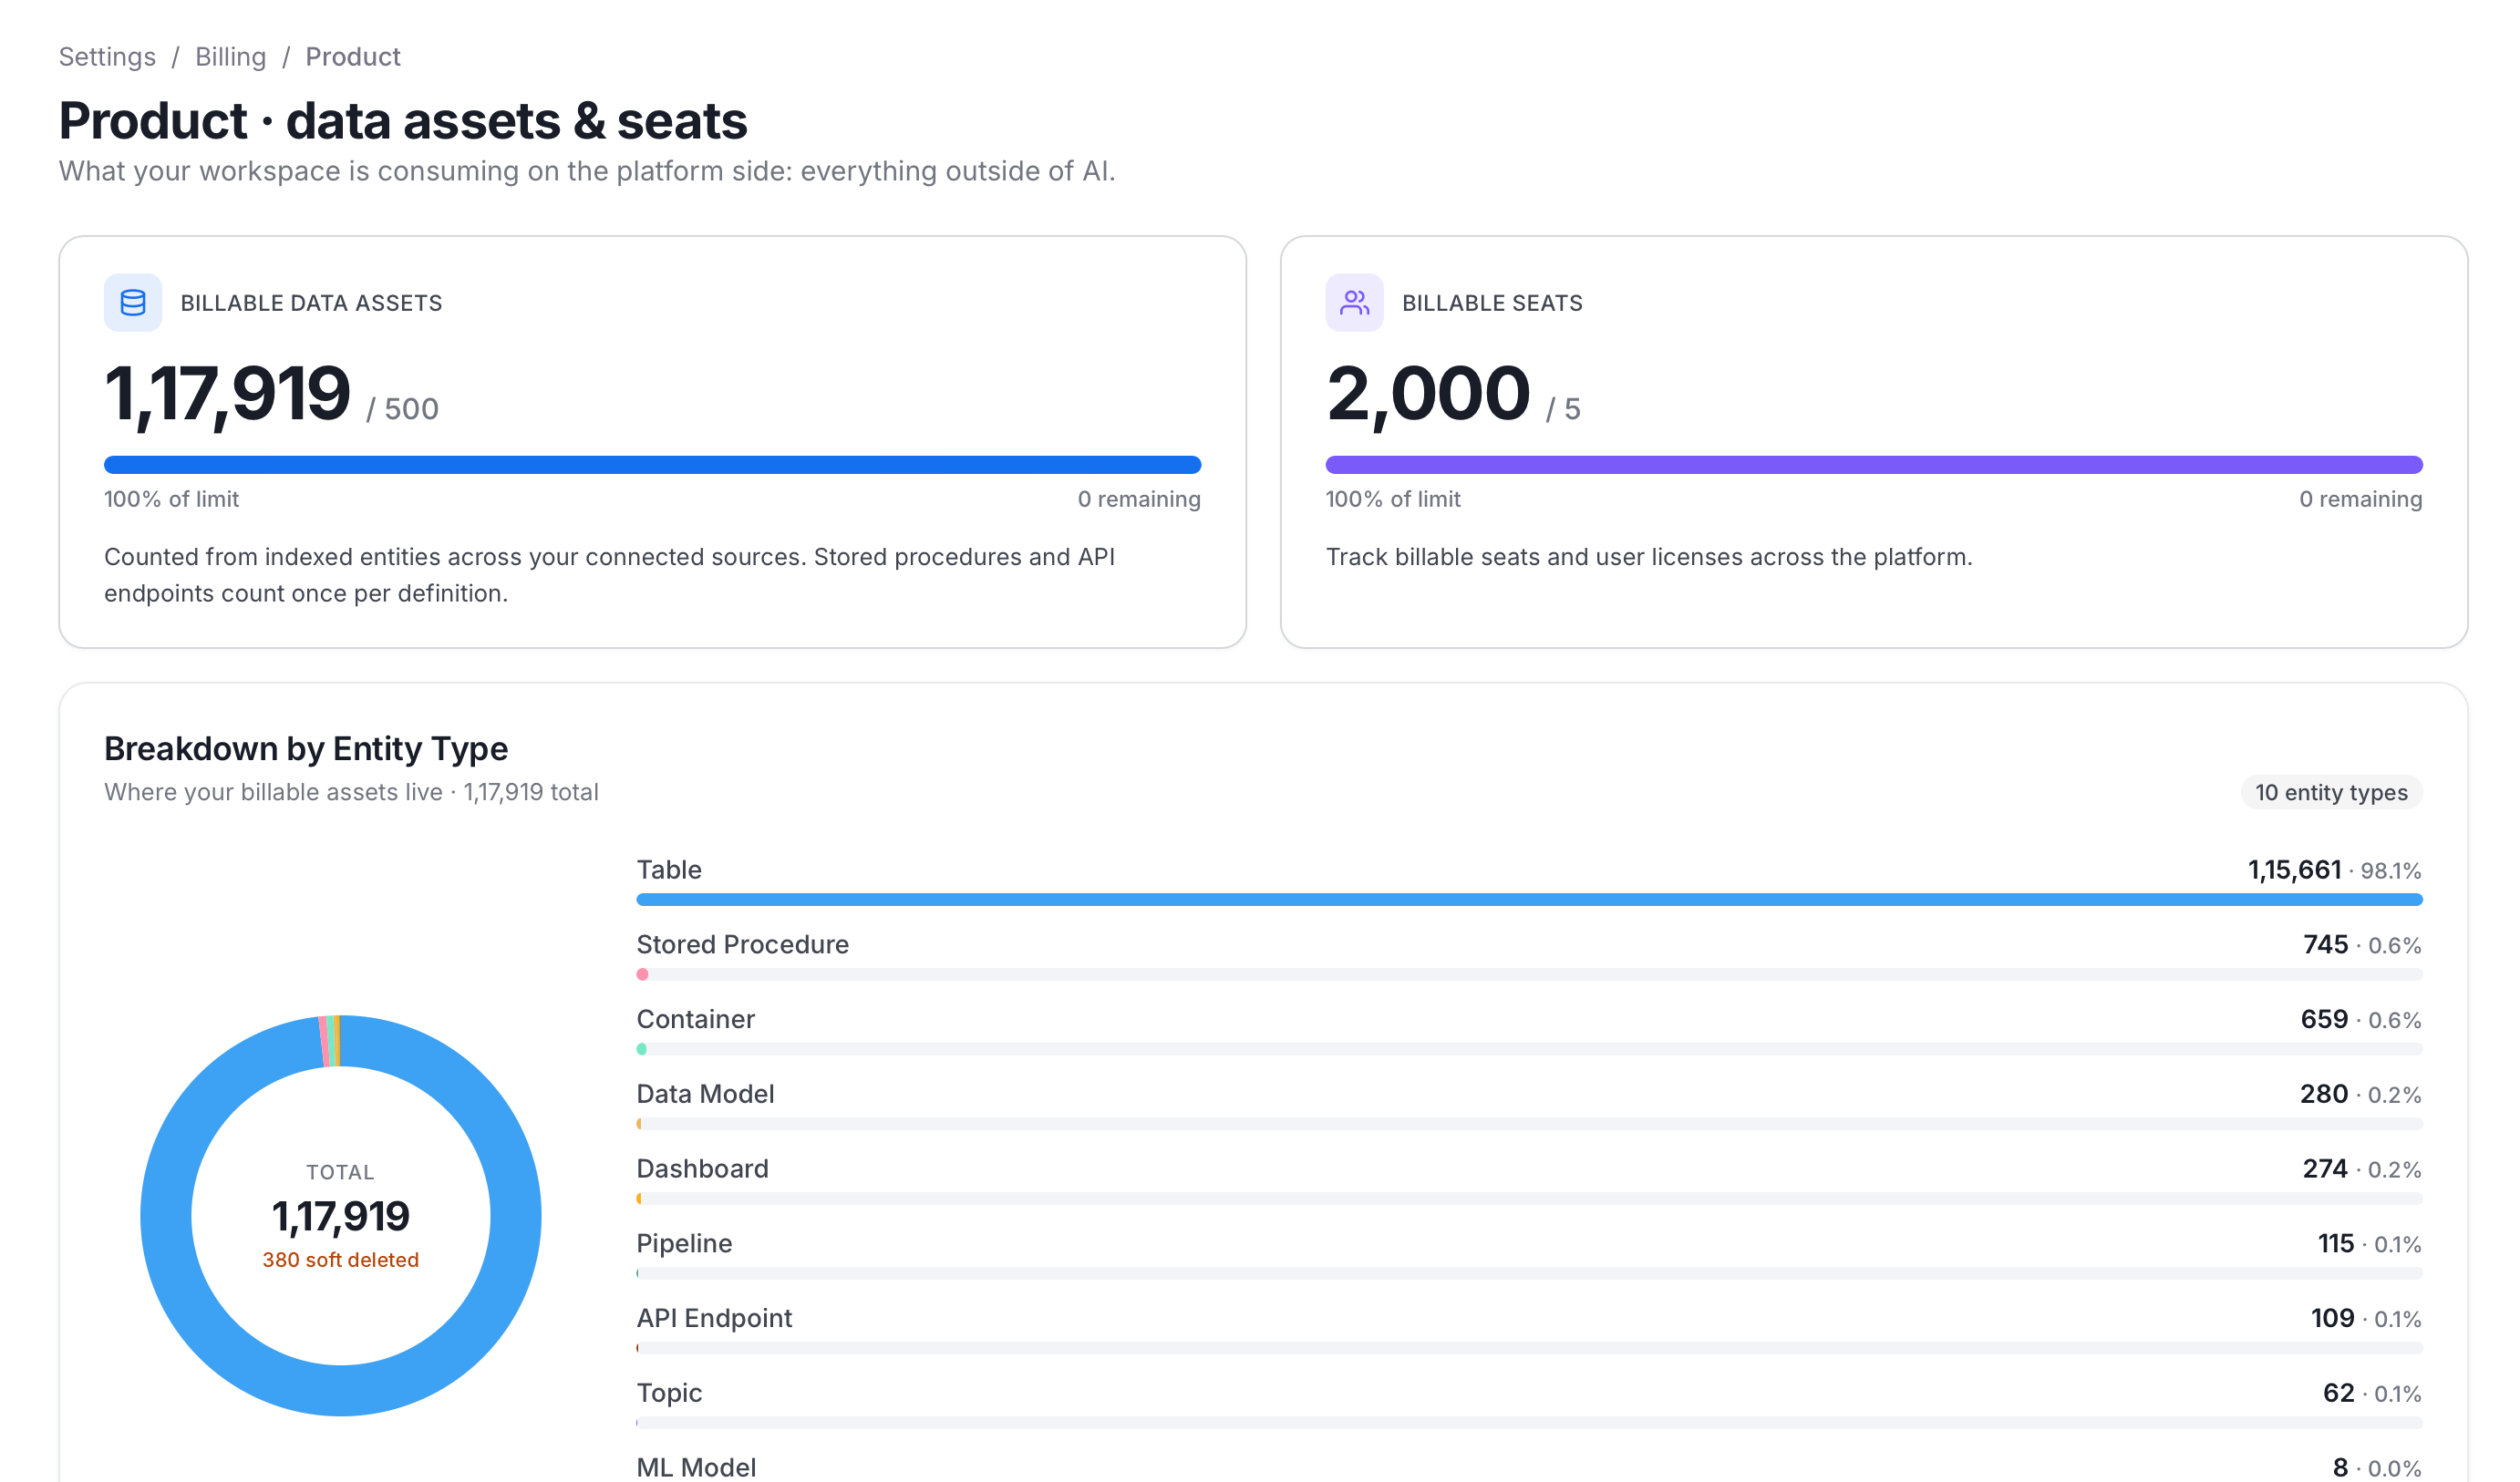
- Billable Data Assets: The total number of indexed entities across your connected sources, against your plan’s limit (or Unlimited). Stored procedures and API endpoints each count once per definition, not once per use.
- Billable Seats: The total user licenses in use, against your plan’s limit.
- Breakdown by Entity Type: A donut chart and list showing which entity types make up your billable assets (tables, stored procedures, dashboards, pipelines, and so on), along with how many assets are soft-deleted.
- Seats by Role: Active users grouped by their primary role.
- Seats by Team: The teams with the most members.
- Top Sources by Asset Count: Which connected services contribute the most assets, listing each source’s type, asset count, and share of your total.
User Adoption
The User Adoption page shows how actively your organization is using Collate, over a selectable range (Last 4 weeks, 12 weeks, or 26 weeks), with an Export as CSV option: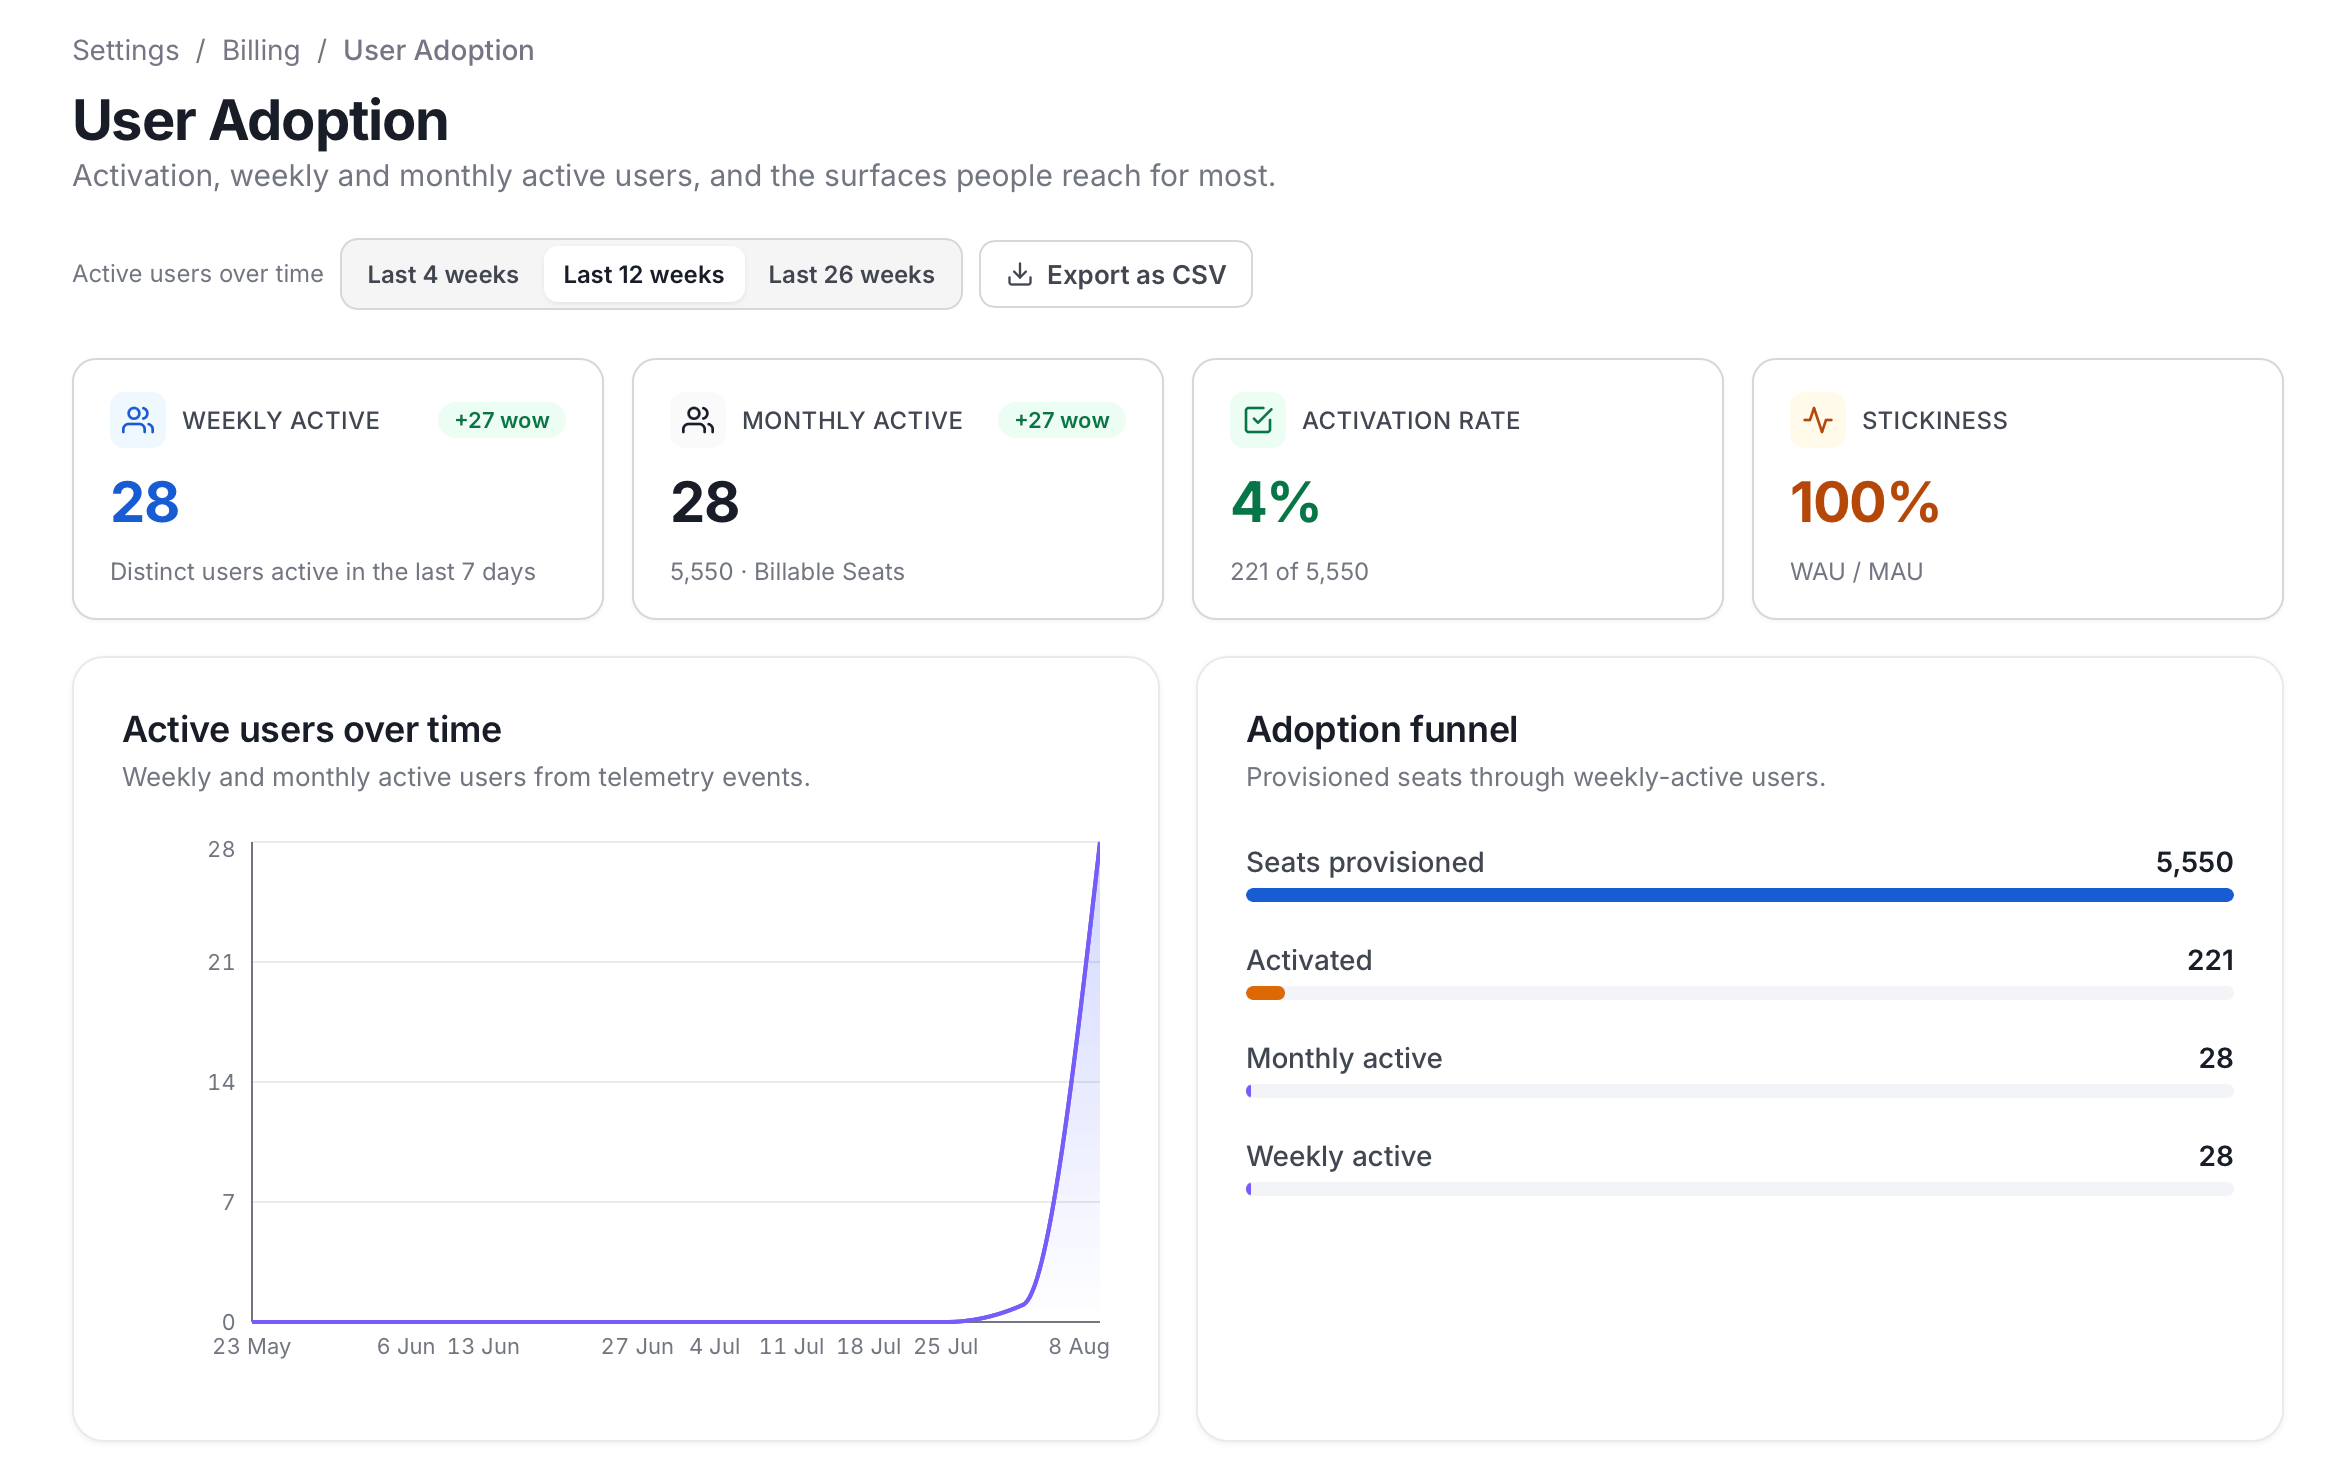
- Weekly Active and Monthly Active: Distinct users active in the period, each compared to the prior period.
- Activation Rate: The share of provisioned seats that have been activated.
- Stickiness: The ratio of weekly to monthly active users, a measure of how habitual usage is.
- Active Users Over Time: A chart plotting weekly and monthly active users from telemetry.
- Adoption Funnel: How many seats were provisioned, how many were activated, and how many are monthly versus weekly active, each stage compared to the one before it.
- Daily Active Users: A daily bar chart for the last 30 days.
- Feature Adoption: Which product surfaces (Search & Explore, Governance, Glossary/Docs, Data Quality, Lineage, SQL Studio, MCP/API) people actually use, classified from telemetry.
- Users table: Every billable seat, with role, status (Daily, Weekly, Monthly, Dormant, Inactive, or Deleted), last active date, sessions in the last 30 days, surfaces used, AI credits consumed, and recent activity. Searchable by name and filterable by status.
AI Credits
The AI Credits page is where you monitor the shared credit pool, over a selectable date range: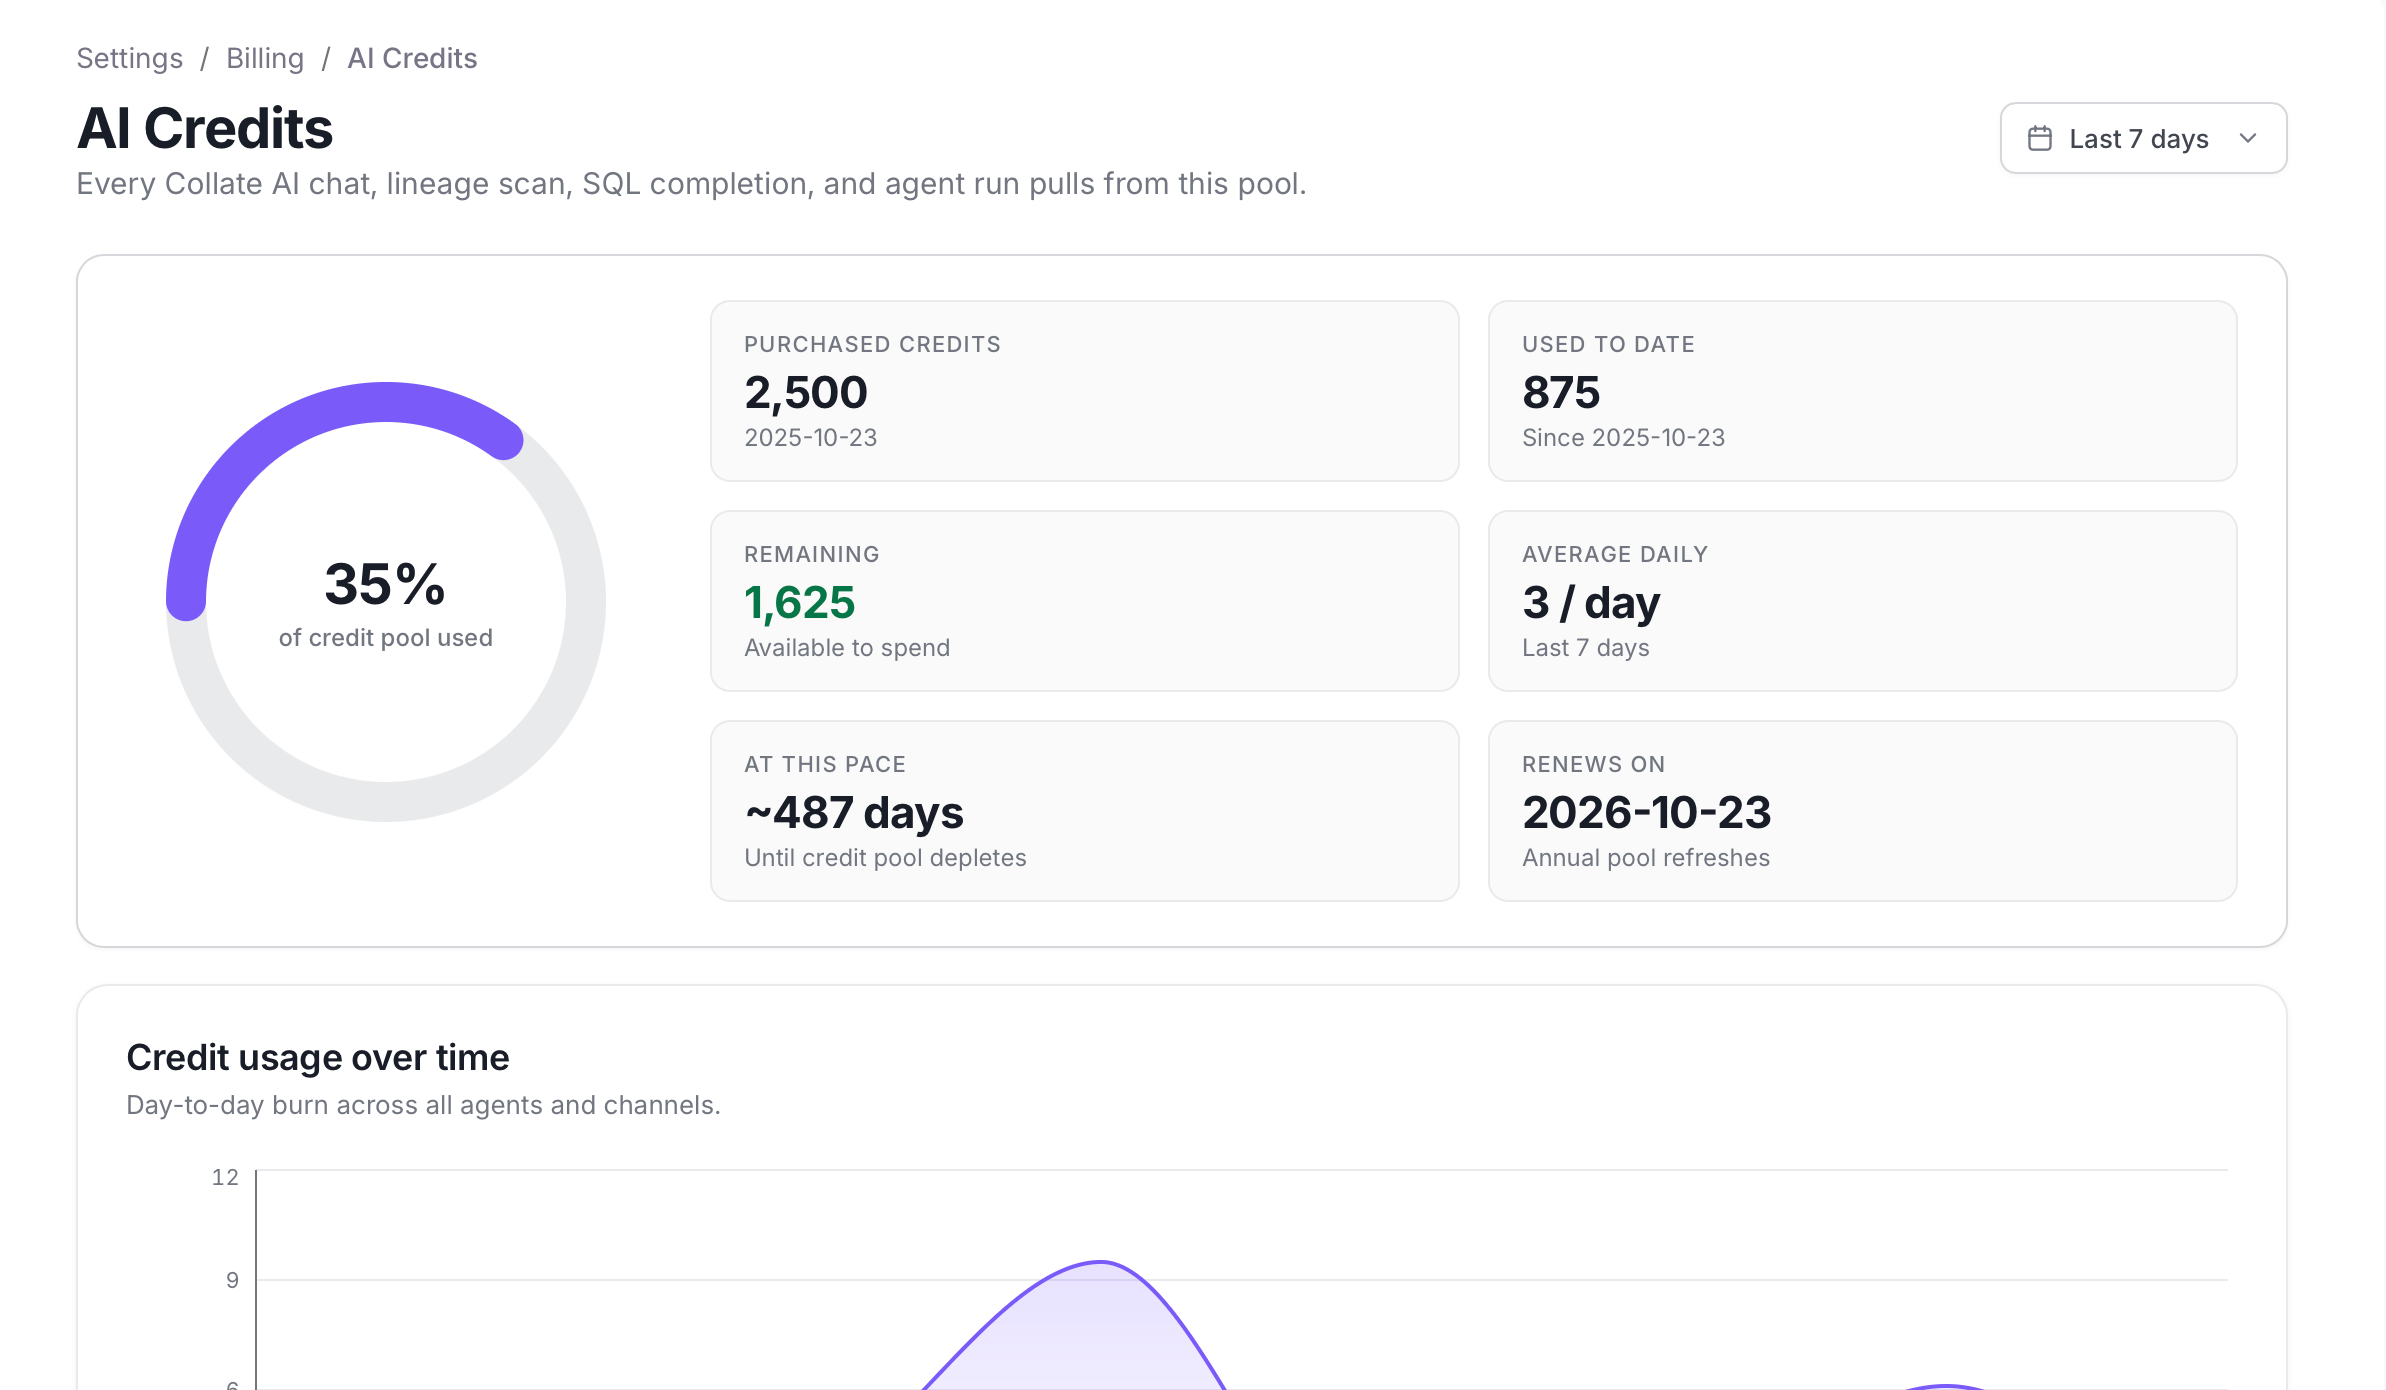
- A gauge showing the percentage of the credit pool used in the selected range.
- Six credit facts: Purchased Credits (and the date purchased), Used to Date, Remaining, Average Daily usage, At This Pace (a forecast of how many days until the pool depletes), and Renews On (the next annual refresh date).
- Credit Usage Over Time: A chart of day-to-day burn across all agents and channels.
- Credit Usage by Agent: Which AI agent consumed the most credits in the selected period.
- Credit Usage by Channel: Where requests originated (for example, Collate AI Web, Slack, or Teams).
- Credit Usage by App: Which billing-aware application recorded the credits.
- Per-User Credit Usage: A searchable table of who is spending credits and across how many distinct agents, with a View all conversations link for deeper drill-down on the Conversations page.
- A How credits are counted explainer, matching the formula described above.
MCP Requests
The MCP Requests page covers requests from AI assistants and IDEs calling your Collate MCP server, over a selectable date range:
- Total MCP Calls, Successful Calls (with a success rate), Failed Calls, and Average Latency.
- Daily MCP Calls: A chart of successful versus failed requests across all clients and tools.
- MCP Calls by Tool: Which exposed tools are getting used the most.
- MCP Calls by User: Usage broken down by user, including service accounts and CI runners.
Workspace Activity
A full-width Workspace Activity chart plots credit consumption over the last 7 days as a daily trend line. Unlike the section cards above it, this chart isn’t a link to another page. It’s a quick visual read on whether usage is trending up or down day to day, without leaving the Overview page.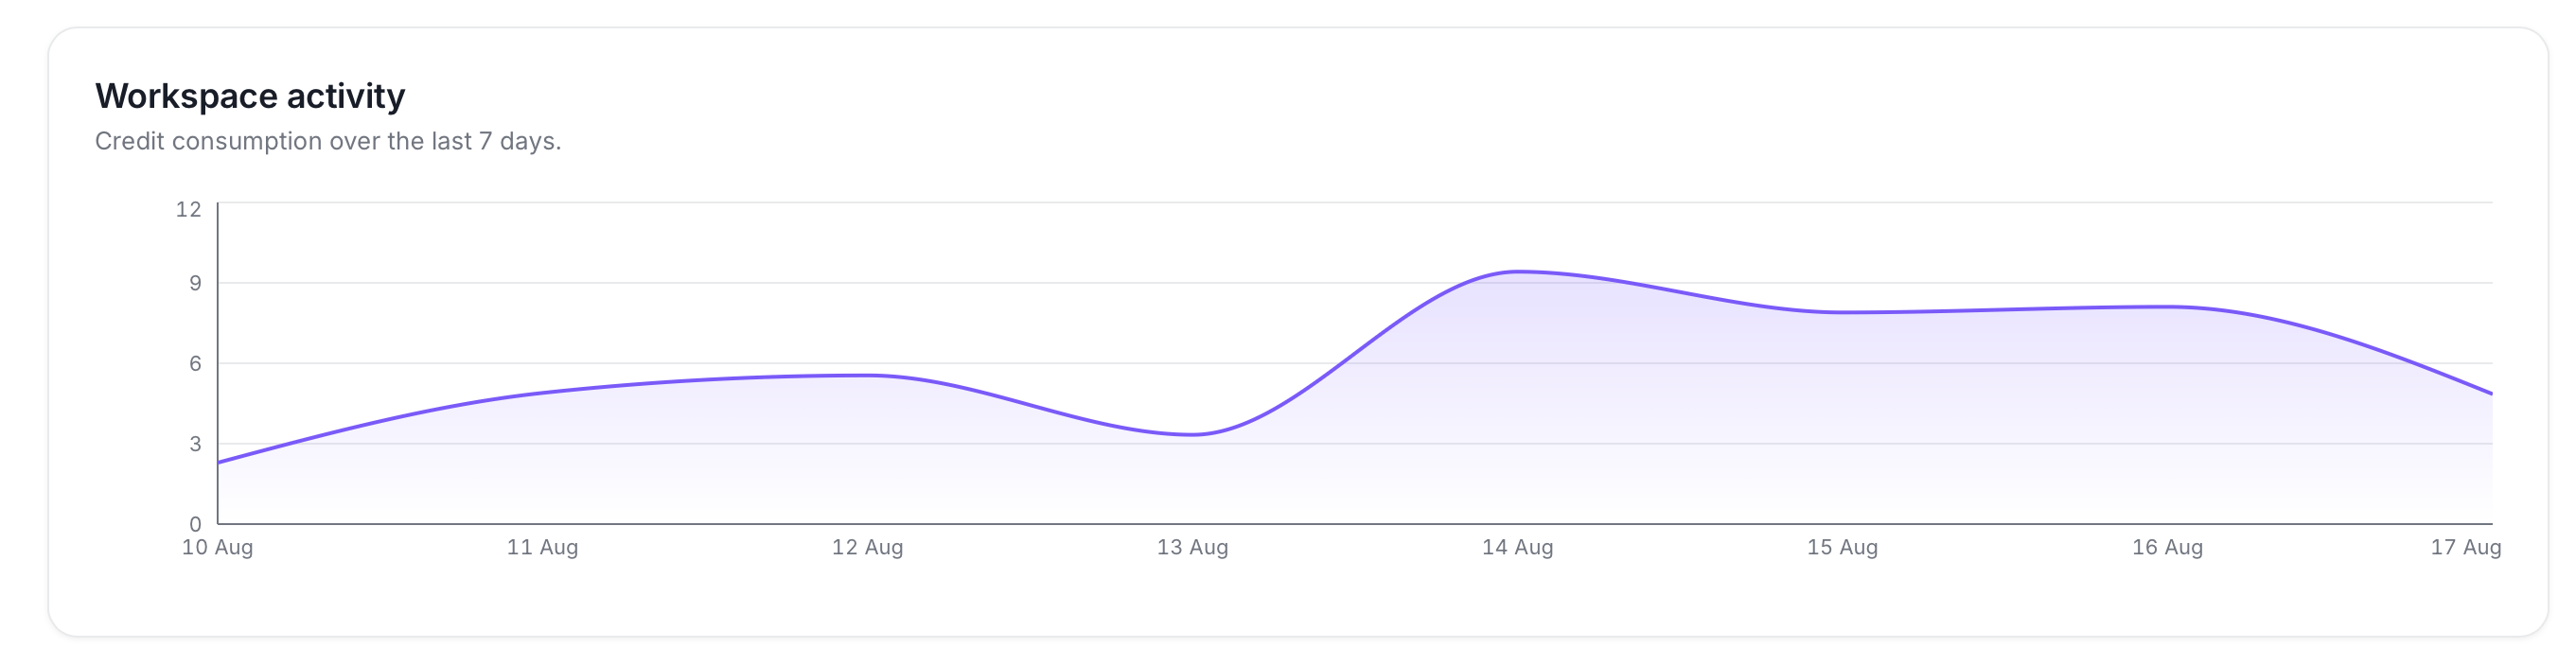
Weekly Impact
On the Billing & Usage page, click View weekly impact to open the Weekly Impact digest: a summary of everything your team did on the platform for a chosen week, covering growth, requests, conversations, and who’s driving that activity.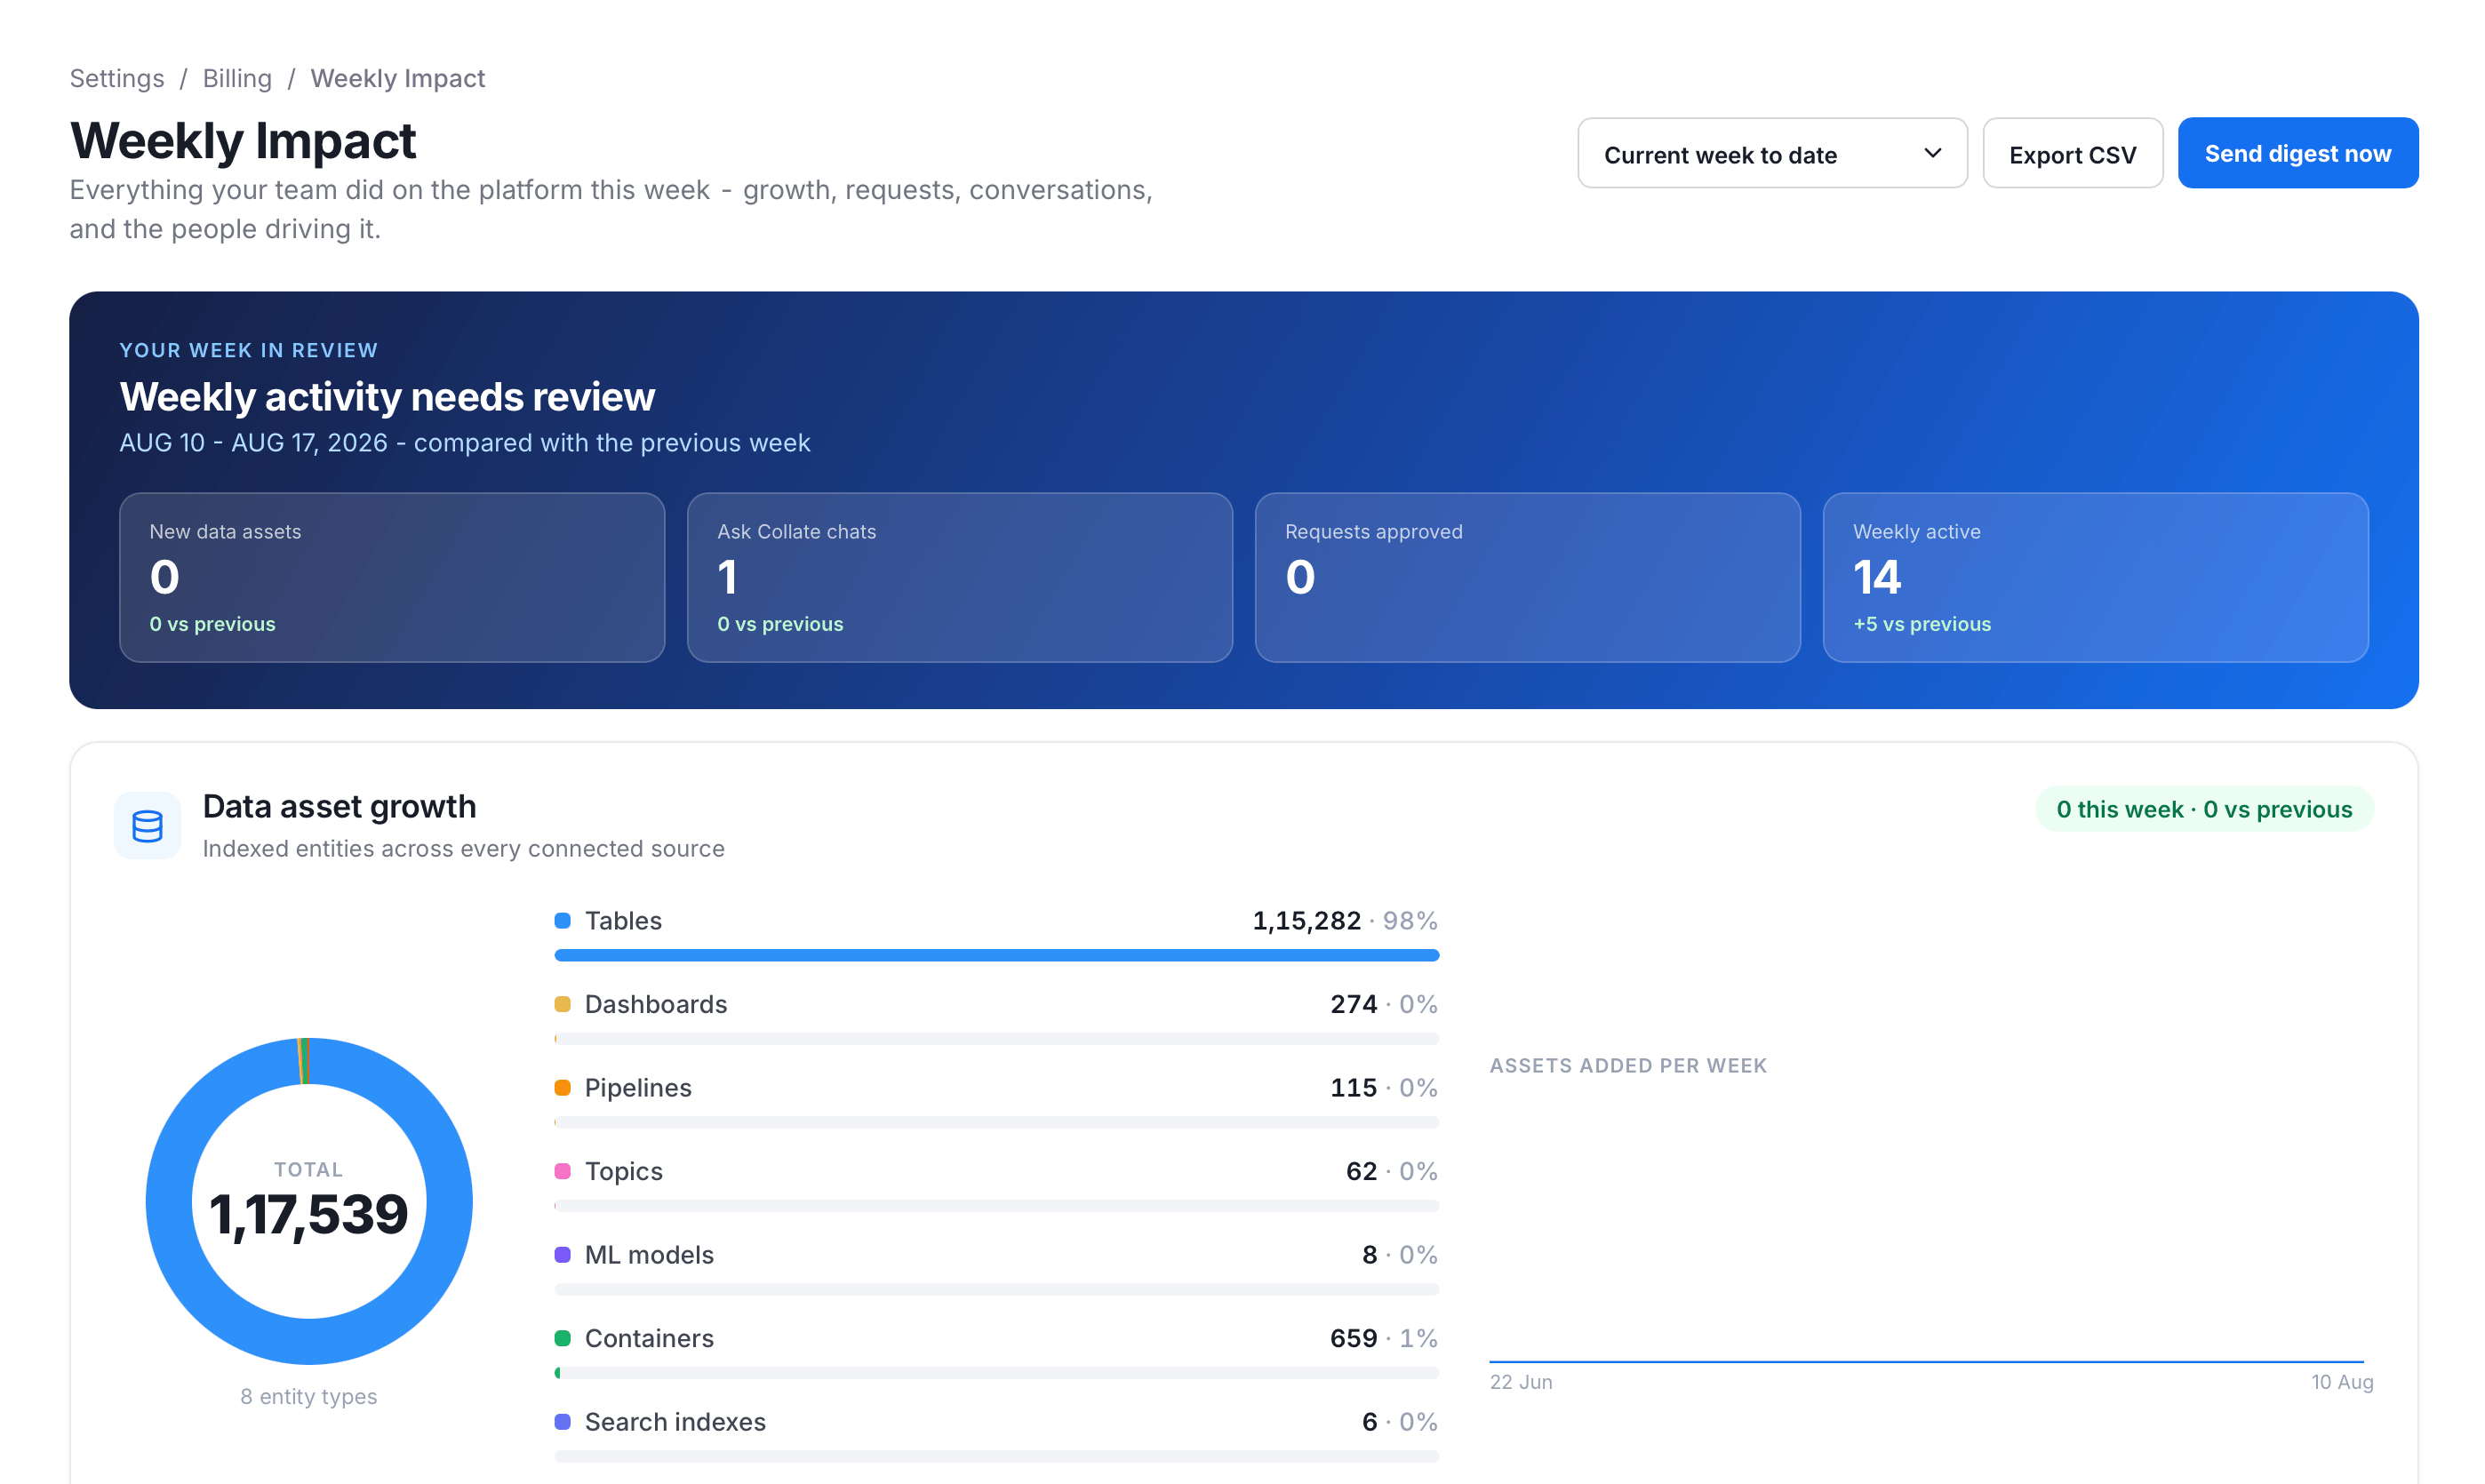
- Weekly summary cards:
- New data assets: How many data assets were newly indexed during the selected period, compared against the previous period.
- Collate AI chats: How many Collate AI conversations were started during the selected period, compared against the previous period.
- Requests approved: How many access requests were approved during the selected period.
- Weekly active: The weekly active user count for the period, the same figure shown on the User Adoption page, compared against the previous period.
- Data Asset Growth:
- A donut chart of total indexed assets, broken down by entity type (tables, dashboards, pipelines, topics, ML models, containers, search indexes).
- An Assets Added Per Week trend chart.
- Access Requests & Approvals:
- Counts of requests Raised, Approved, and Pending this week.
- A Resolved Per Day chart.
- The Avg time to approve.
- Collate AI Conversations:
- Conversations, Messages, and Credits consumed through Collate AI this week.
- A What People Asked For breakdown.
- User Adoption:
- Weekly Active and Monthly Active user counts.
- Stickiness, the weekly-to-monthly active ratio.
- An Active Users Over Time chart.
- Governance & Data Health:
- Tests Passing and Tests Failing counts.
- The share of assets that Has an Owner.
- A Failing Tests by Table list.
- Data Quality Health:
- The overall test success rate.
- A breakdown by dimension: Accuracy, Completeness, Uniqueness, and Validity.
- Open Incidents:
- Active observability alerts, each showing how long ago it opened and whether it’s assigned.
- A link to view all incidents in Observability.
- Top Contributors:
- A leaderboard of people who moved the platform forward this week, ranked by documented assets, approvals, and queries.
- Needs Your Attention:
- Items that need follow-up, such as access requests pending more than 24 hours, open incidents, and failing data quality tests, each linking directly to where you can act on it.
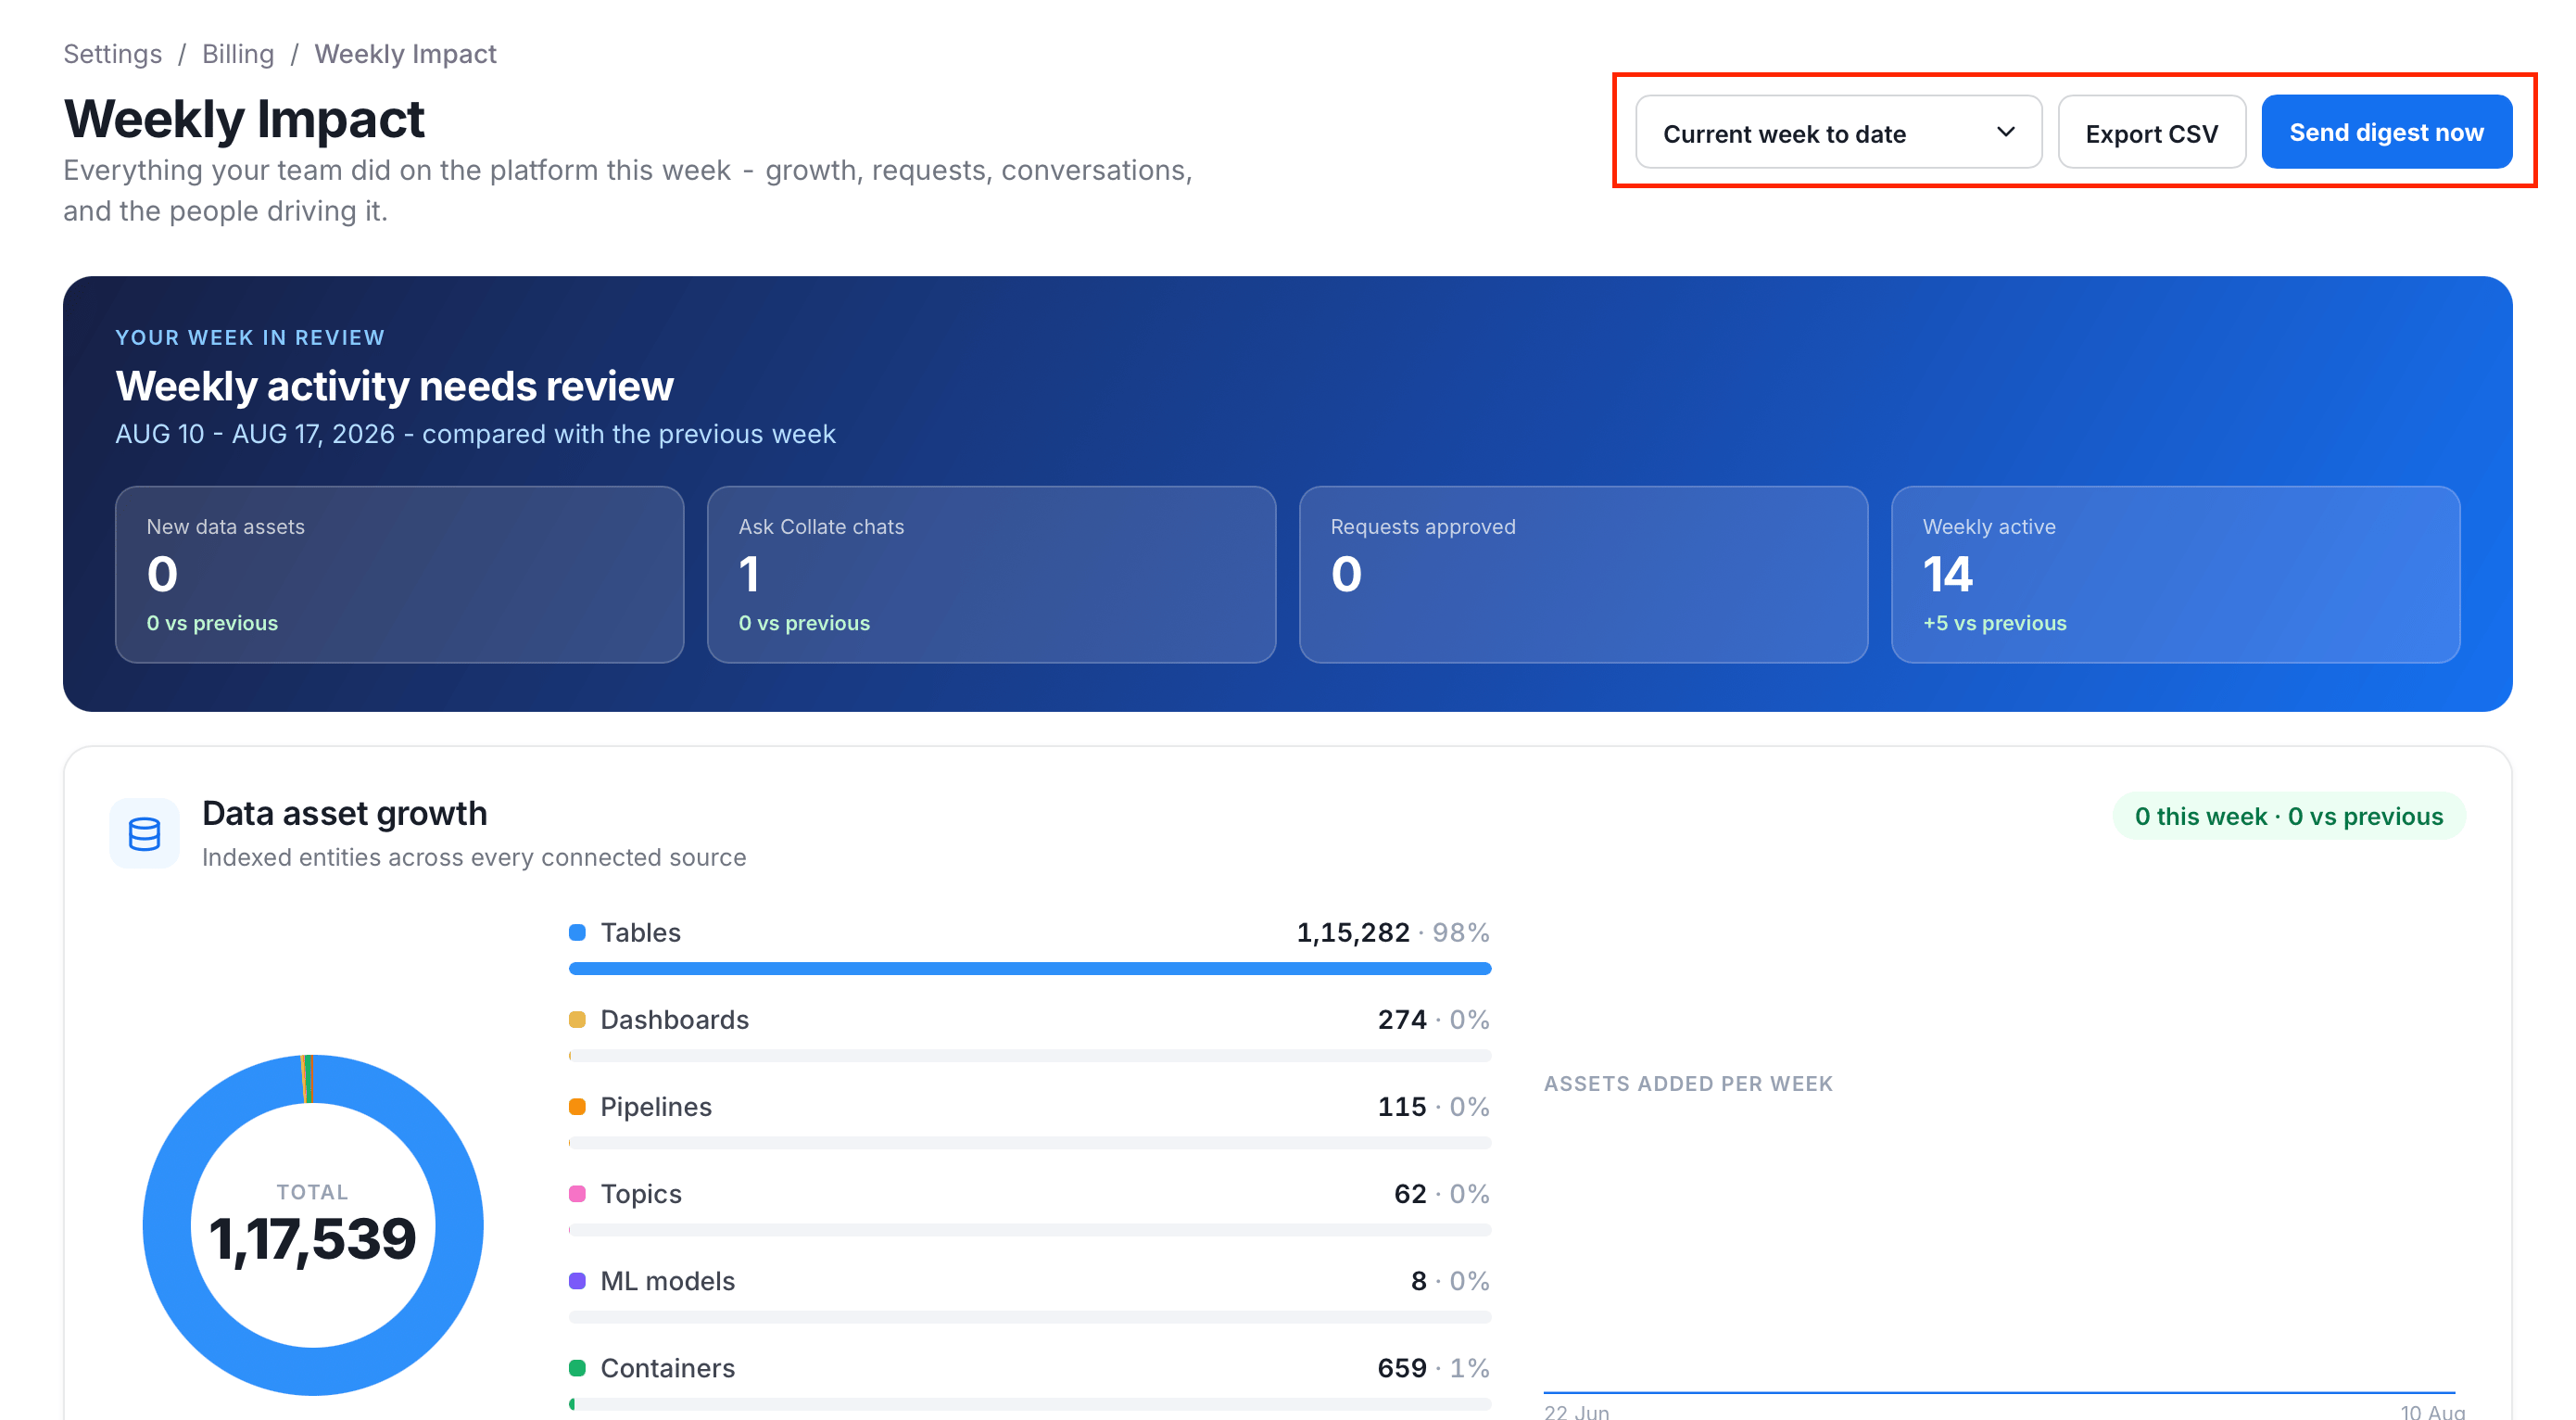
- Filter and share:
- Week selector: Choose which period to review: Current week to date, Previous complete week, or Two weeks ago.
- Export CSV: Downloads the underlying data for the selected period.
- Send digest now: Immediately emails this same summary to every active admin in the workspace, rather than waiting for its next scheduled run.
Plan and Credit Pool
A few things to know about your plan and credit pool:- Your plan (Free, Starter, Premium, Enterprise, or POV) and total credit pool are set for the whole workspace, not per team or per user.
- The billing cycle renews annually, not monthly.
- There’s no self-service way to change your plan or credit pool from within the product. Contact Collate to make changes.
Limits and Warnings
As your organization’s credit pool runs low, Collate AI Chat shows an increasingly urgent banner:- Low (fewer than 10 credits remaining): “You’re running low on Collate AI credits. Long conversations might not finish. Contact support to request more credits.”
- Exhausted (fewer than 2 credits remaining): “You have exceeded your Collate AI limits. Some features might not be available after this point. You can reach out to Collate Support for further assistance.”
- Status unavailable: If Collate can’t check the remaining balance, it warns that runs might fail if the pool has actually run out.
Blocked Runs
Once the pool is exhausted, Collate blocks new AI runs rather than letting them fail partway through. A run needs at least 2 credits remaining in the pool to start at all. This applies to every credit-consuming feature: Chat, search, agents, and automations alike. Credit checks refresh every few minutes rather than in real time, so a burst of concurrent AI calls right at the limit could briefly overshoot before being blocked. On the home dashboard, the Action Required and Recommended Improvements widgets show a dedicated out-of-credits message with a View Usage link back to this page, instead of a generic error. The Platform Health Summary widget uses an inline out-of-credits placeholder without that link.Troubleshooting
If a user reports they can’t run an AI feature, work through this checklist:- Check the pool: Open the AI Credits page gauge. Is the workspace’s pool near or at zero?
- Check the user: Look them up in the per-user credit usage table. Are they a particularly heavy consumer?
- Check the breakdown: Expand their row to see which agent or channel is consuming their share.
- Check the conversation: Use the Conversations page to find the specific interaction and its cost. A conversation with no recorded cost may predate per-conversation attribution, or the spend may have come from the search bar, which isn’t tied to a conversation.
- Check headroom: Even if the pool isn’t fully exhausted, a run needs at least 2 credits remaining to start. Confirm the workspace has that much headroom.