The Home Page
When you log in to Collate, you land on a dashboard that gives you a real-time picture of your data platform’s health, outstanding actions, AI-generated recommendations, and recent activity — all in one view.Navigation Sidebar
The left sidebar is the primary way to navigate between sections. It can be collapsed to a compact icon rail and supports persona-based customization by Admins.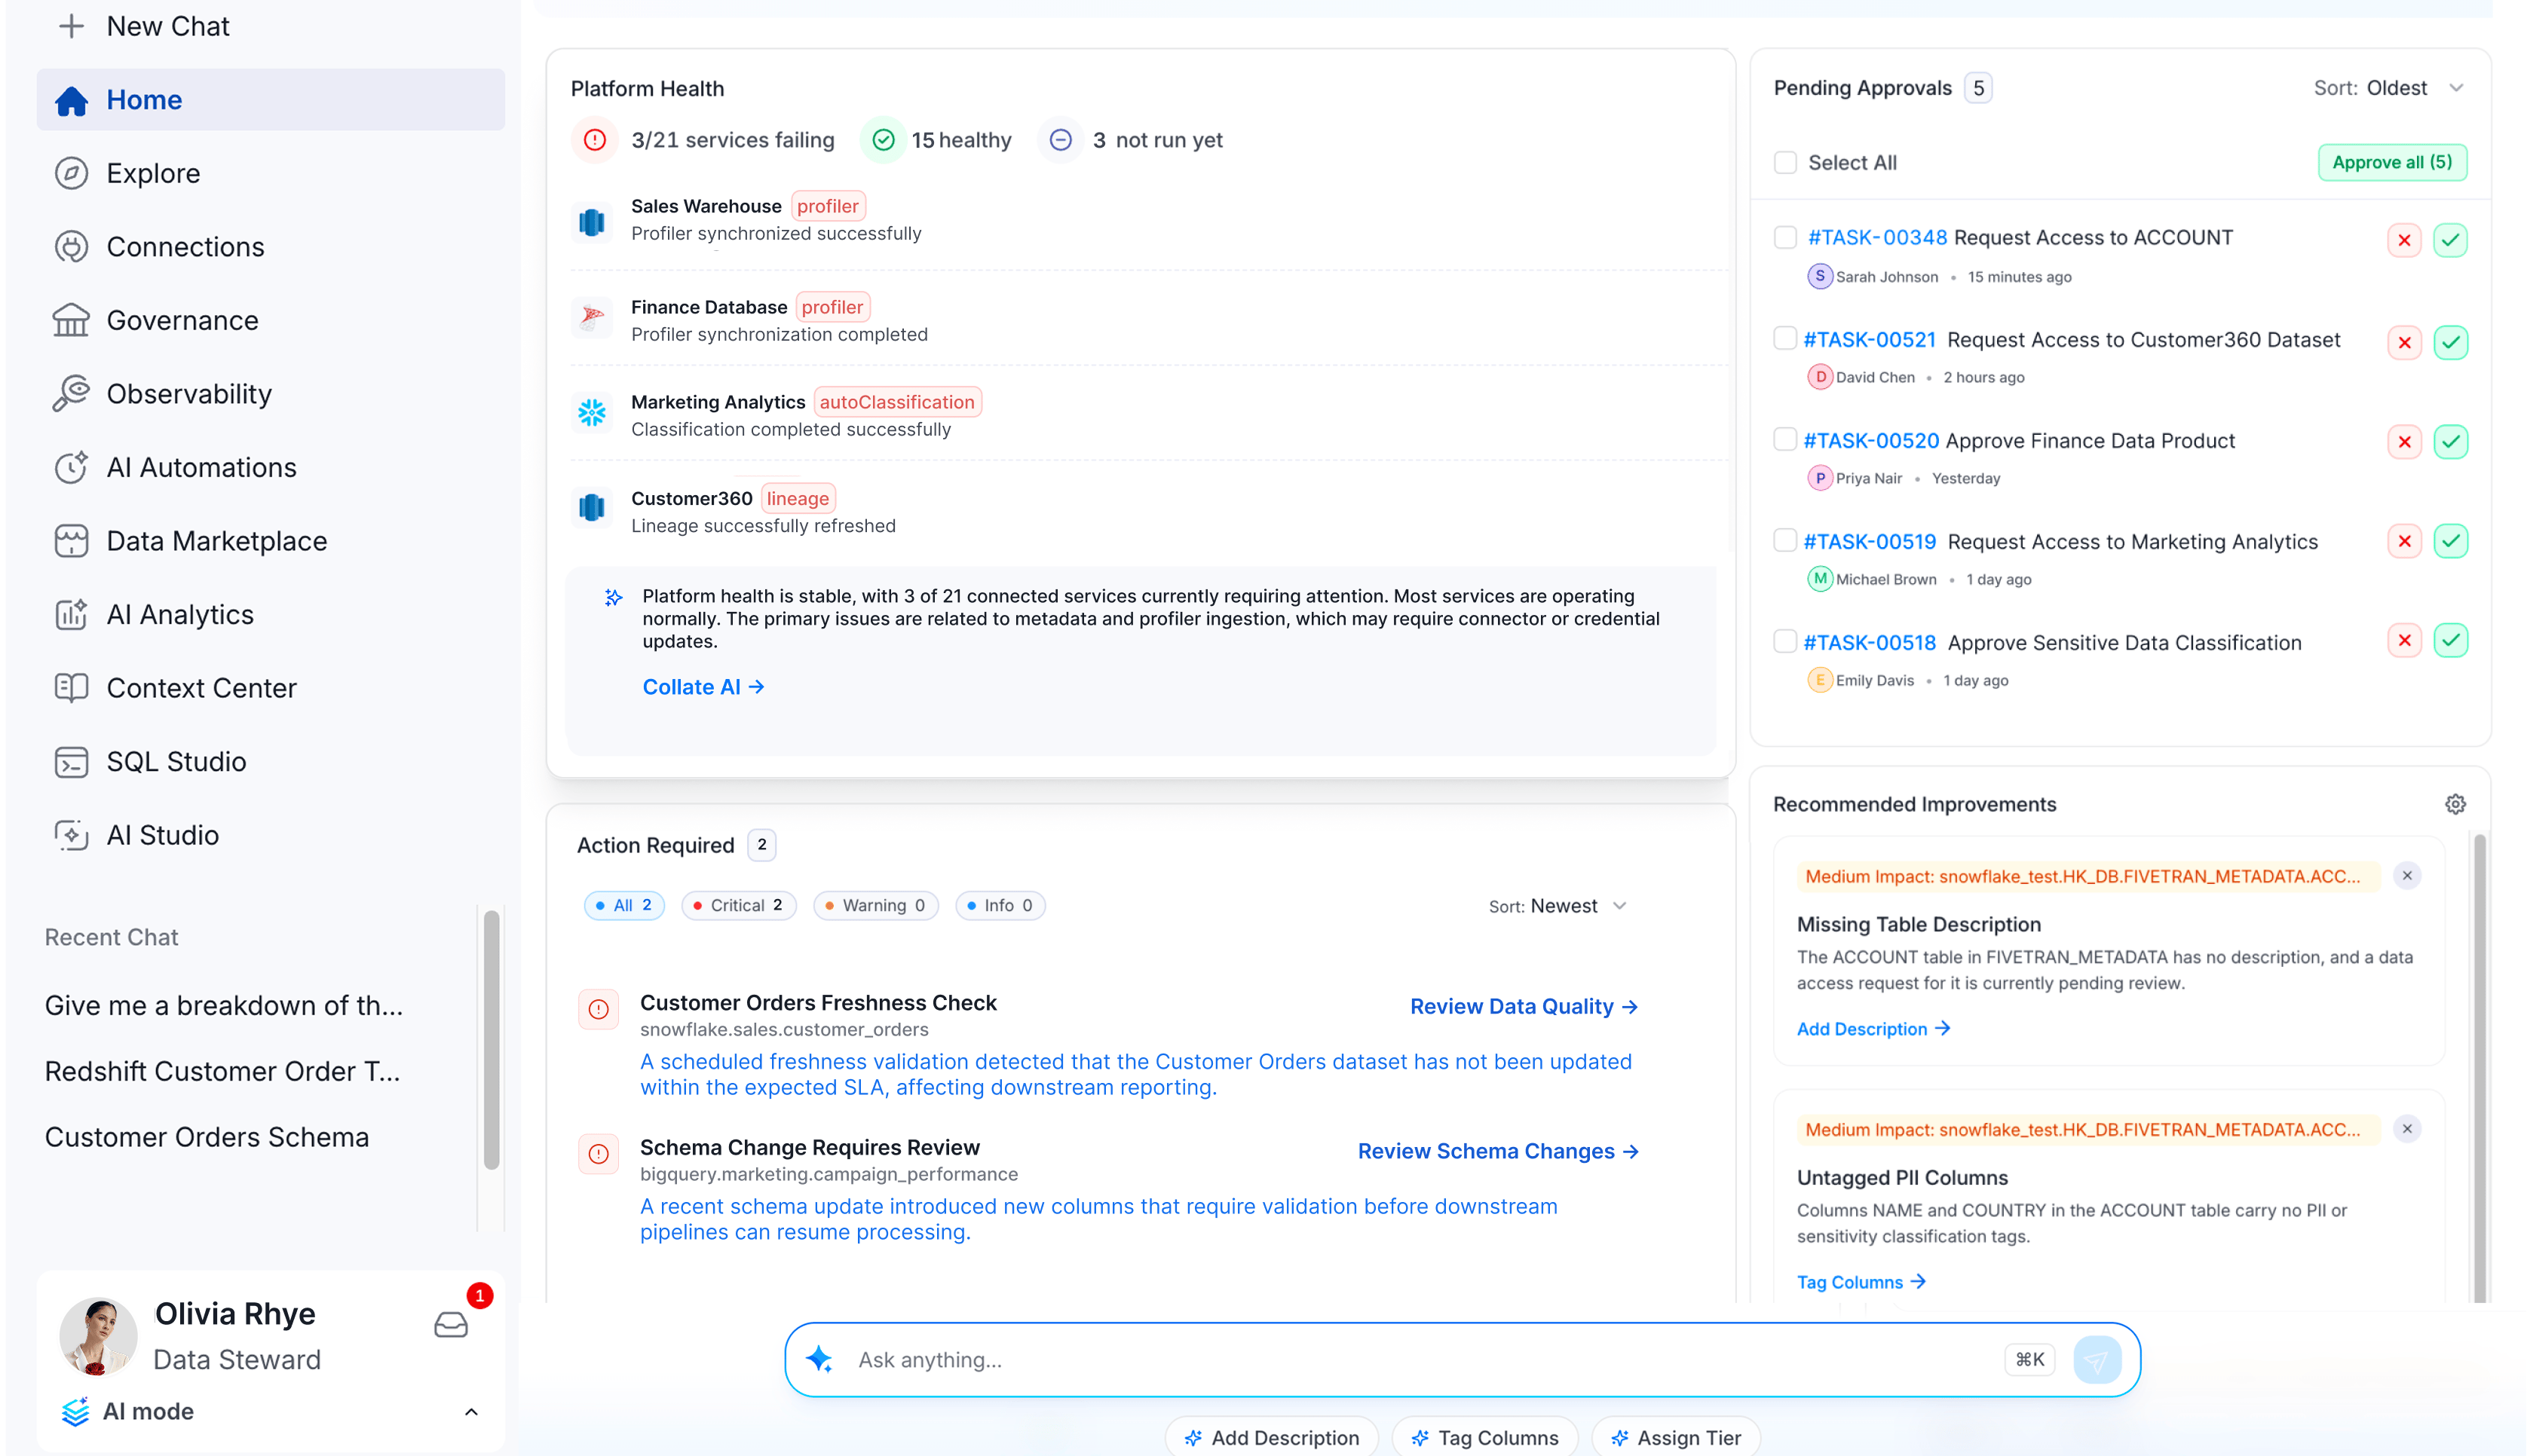
Home Page Dashboard
The home dashboard is organized into a grid of widgets. Each widget surfaces a different facet of your platform.
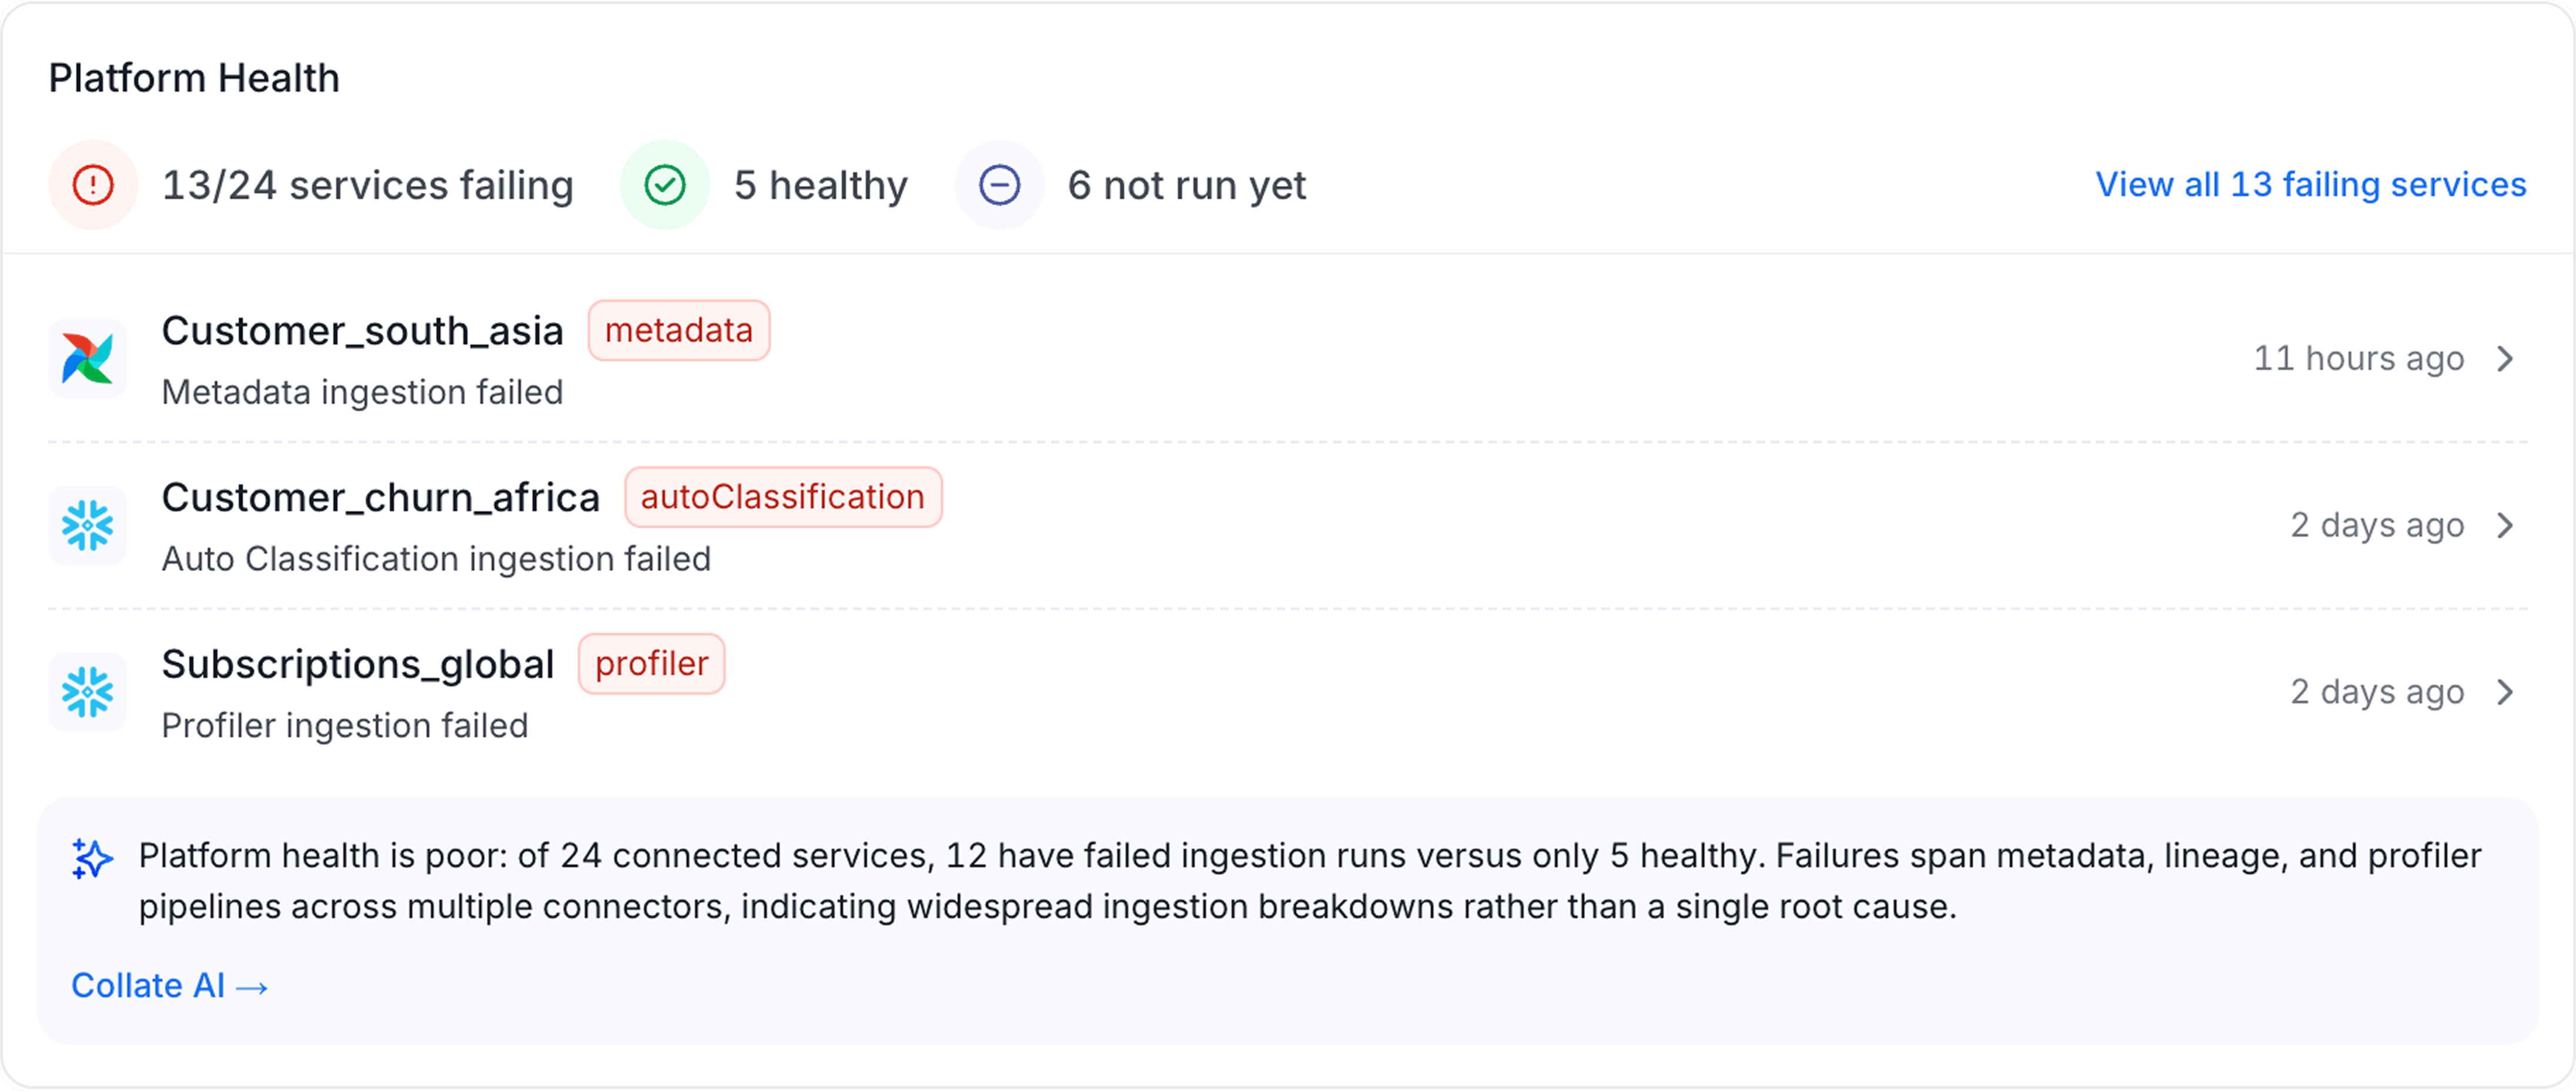
Platform Health Summary
The largest widget on the home page lists every service with a pipeline or agent that didn’t complete successfully. Each failure carries a badge colored by pipeline type, making the kind of failure recognizable before reading the label:
Click a service to open its Agents tab, where you can review the failing agent and its logs.
From there, use the Collate AI option to analyze the failure. It opens a new tab in the sidebar with a root-cause analysis and suggested fixes for that service. Collate hides both the option to retry the AI summary and the Collate AI button when credits are exhausted, because generating a new summary wouldn’t succeed until credits are restored.
Note: This widget is visible to platform admins only.
Pending Approvals
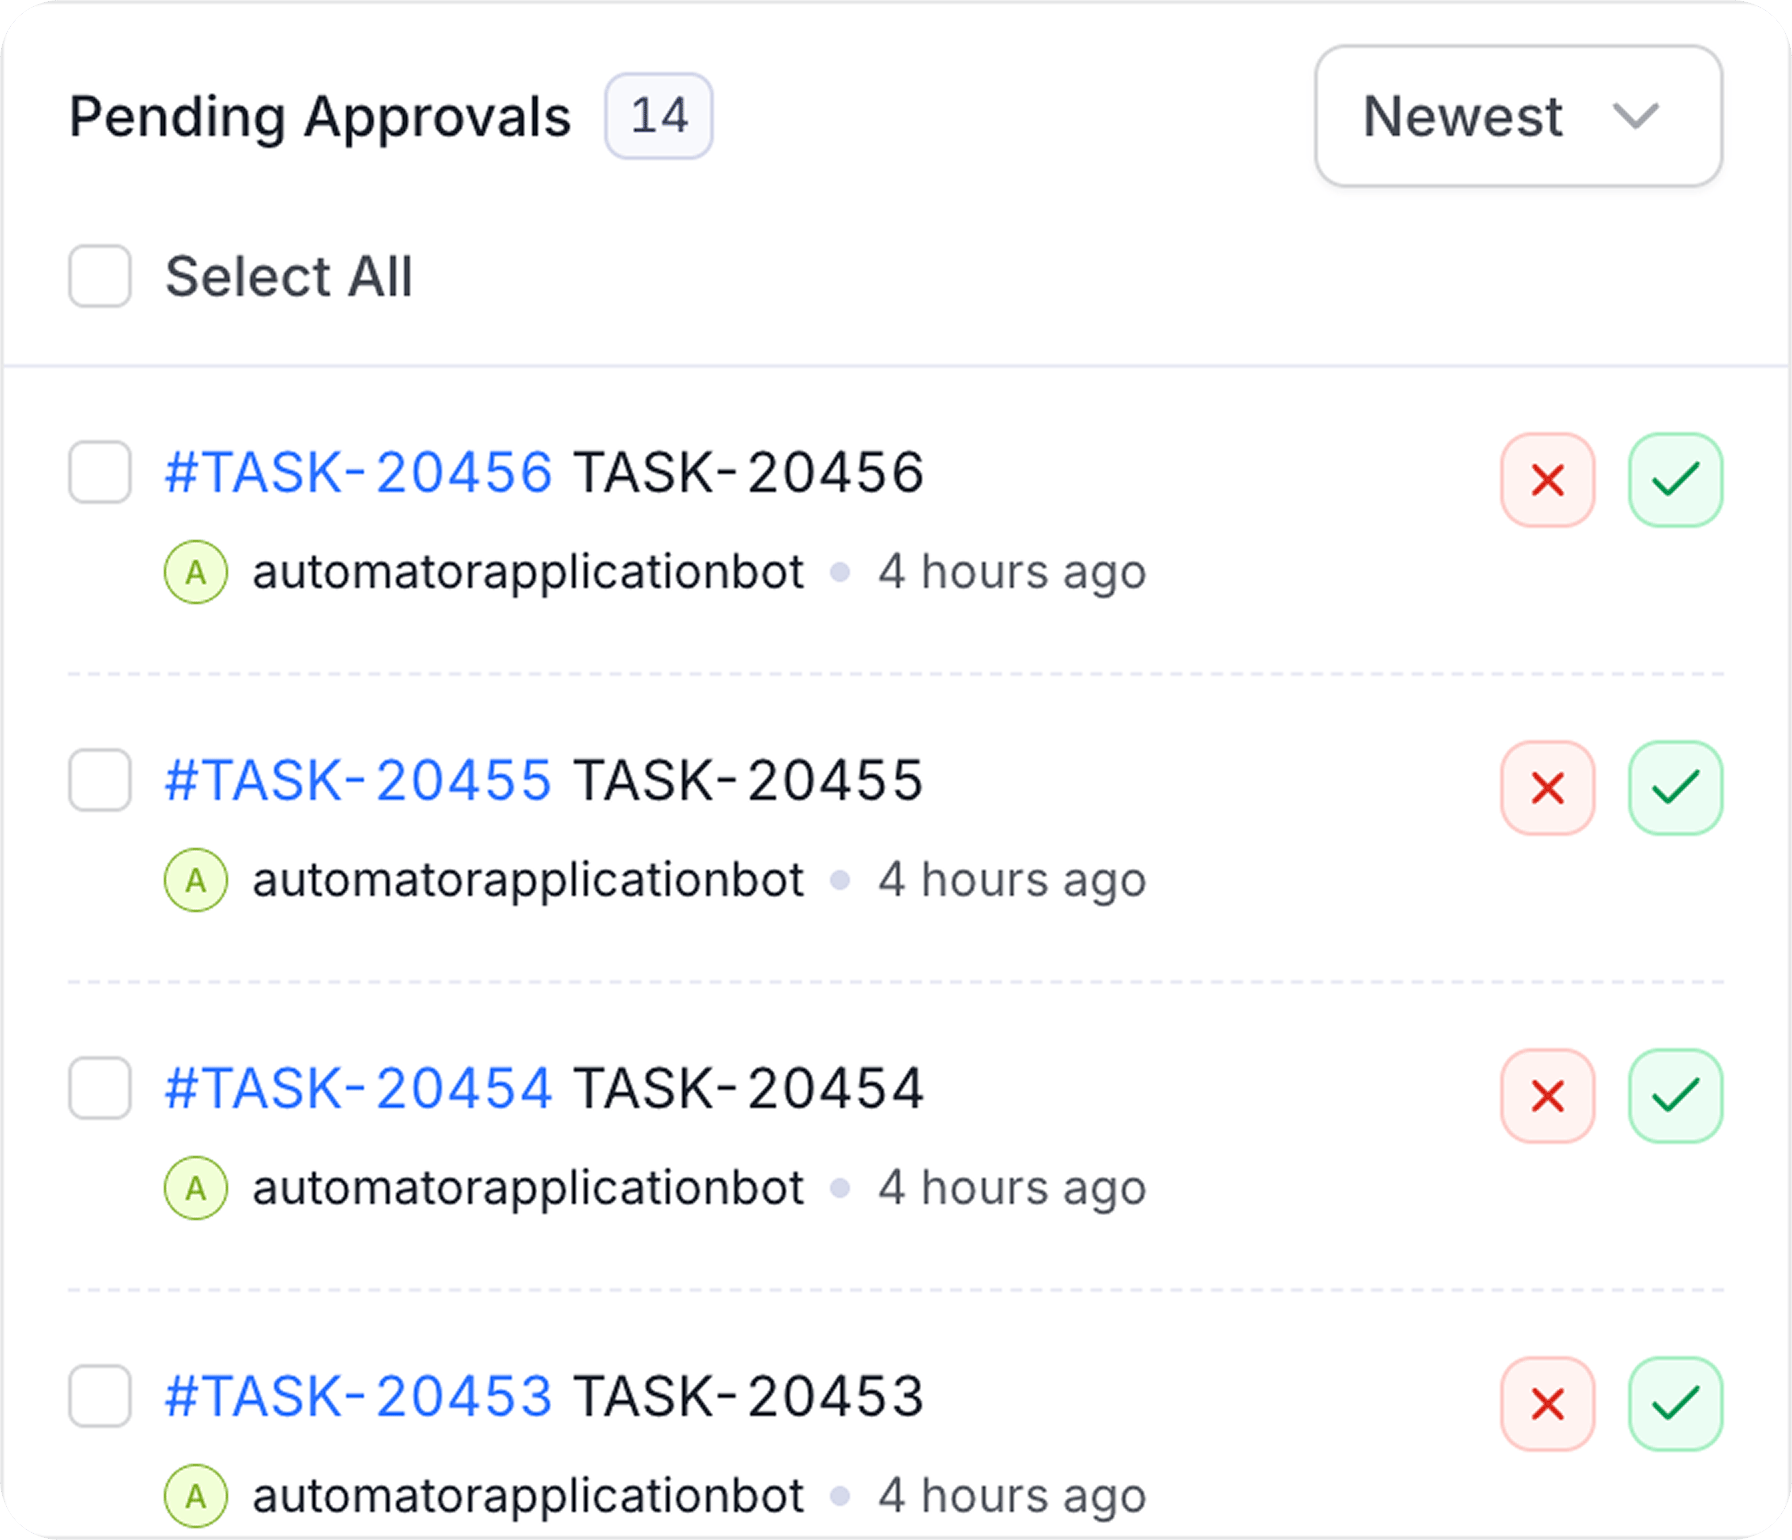
Lists open governance tasks that require your action: access requests, certification sign-offs, and ownership assignments waiting on you or your team.- Approve or reject directly from the widget: Most tasks show inline Approve and Reject buttons, so you can resolve them without leaving the home page.
- Incident tasks: Tasks tied to a data quality incident don’t have inline approve/reject actions. Click one to open its detail page instead.
- View All: Opens your full task list for a complete view of everything pending across your account.
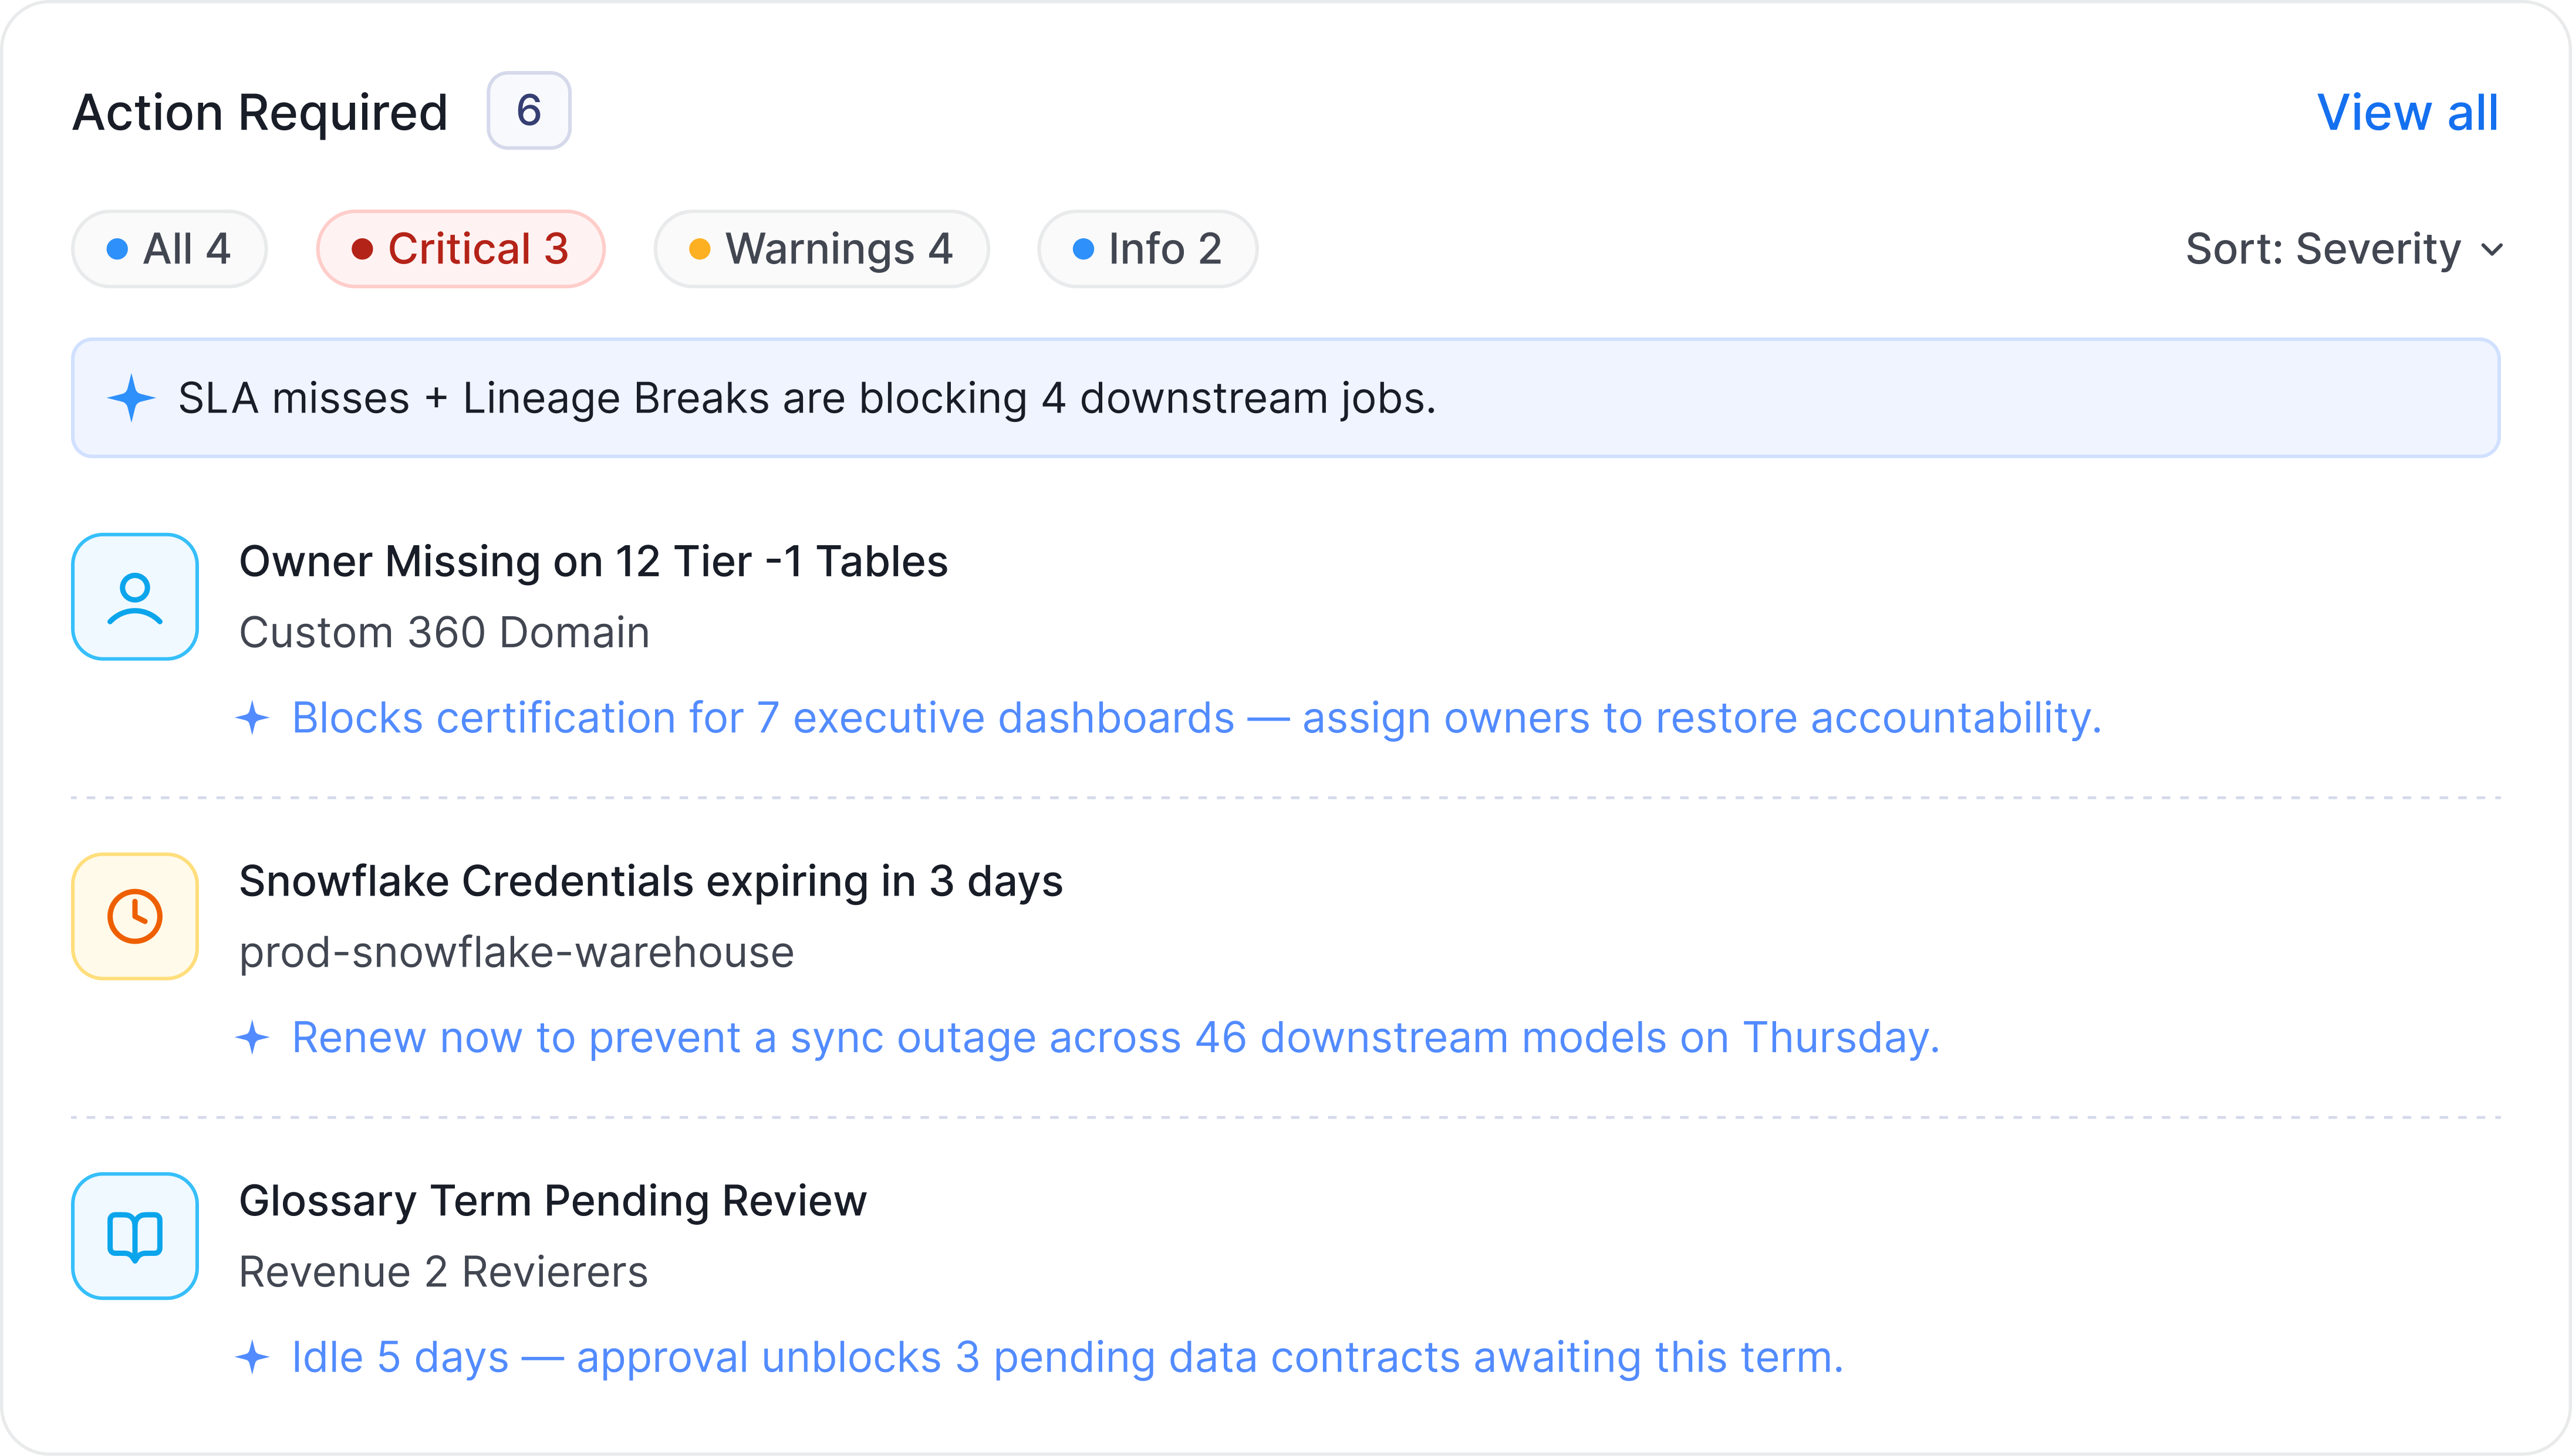
Action Required
AI-generated items that need your attention, prioritized by severity:- Critical — issues that may impact data consumers now
- Warning — items that should be addressed soon
- Info — lower-priority improvements
Recommended Improvements
AI-generated suggestions for improving your metadata coverage — descriptions, ownership gaps, quality issues, and classification opportunities. Each suggestion is tagged High, Medium, or Low impact so you can prioritize. Click a suggestion to open a Collate AI conversation with the context pre-loaded so you can act on it directly.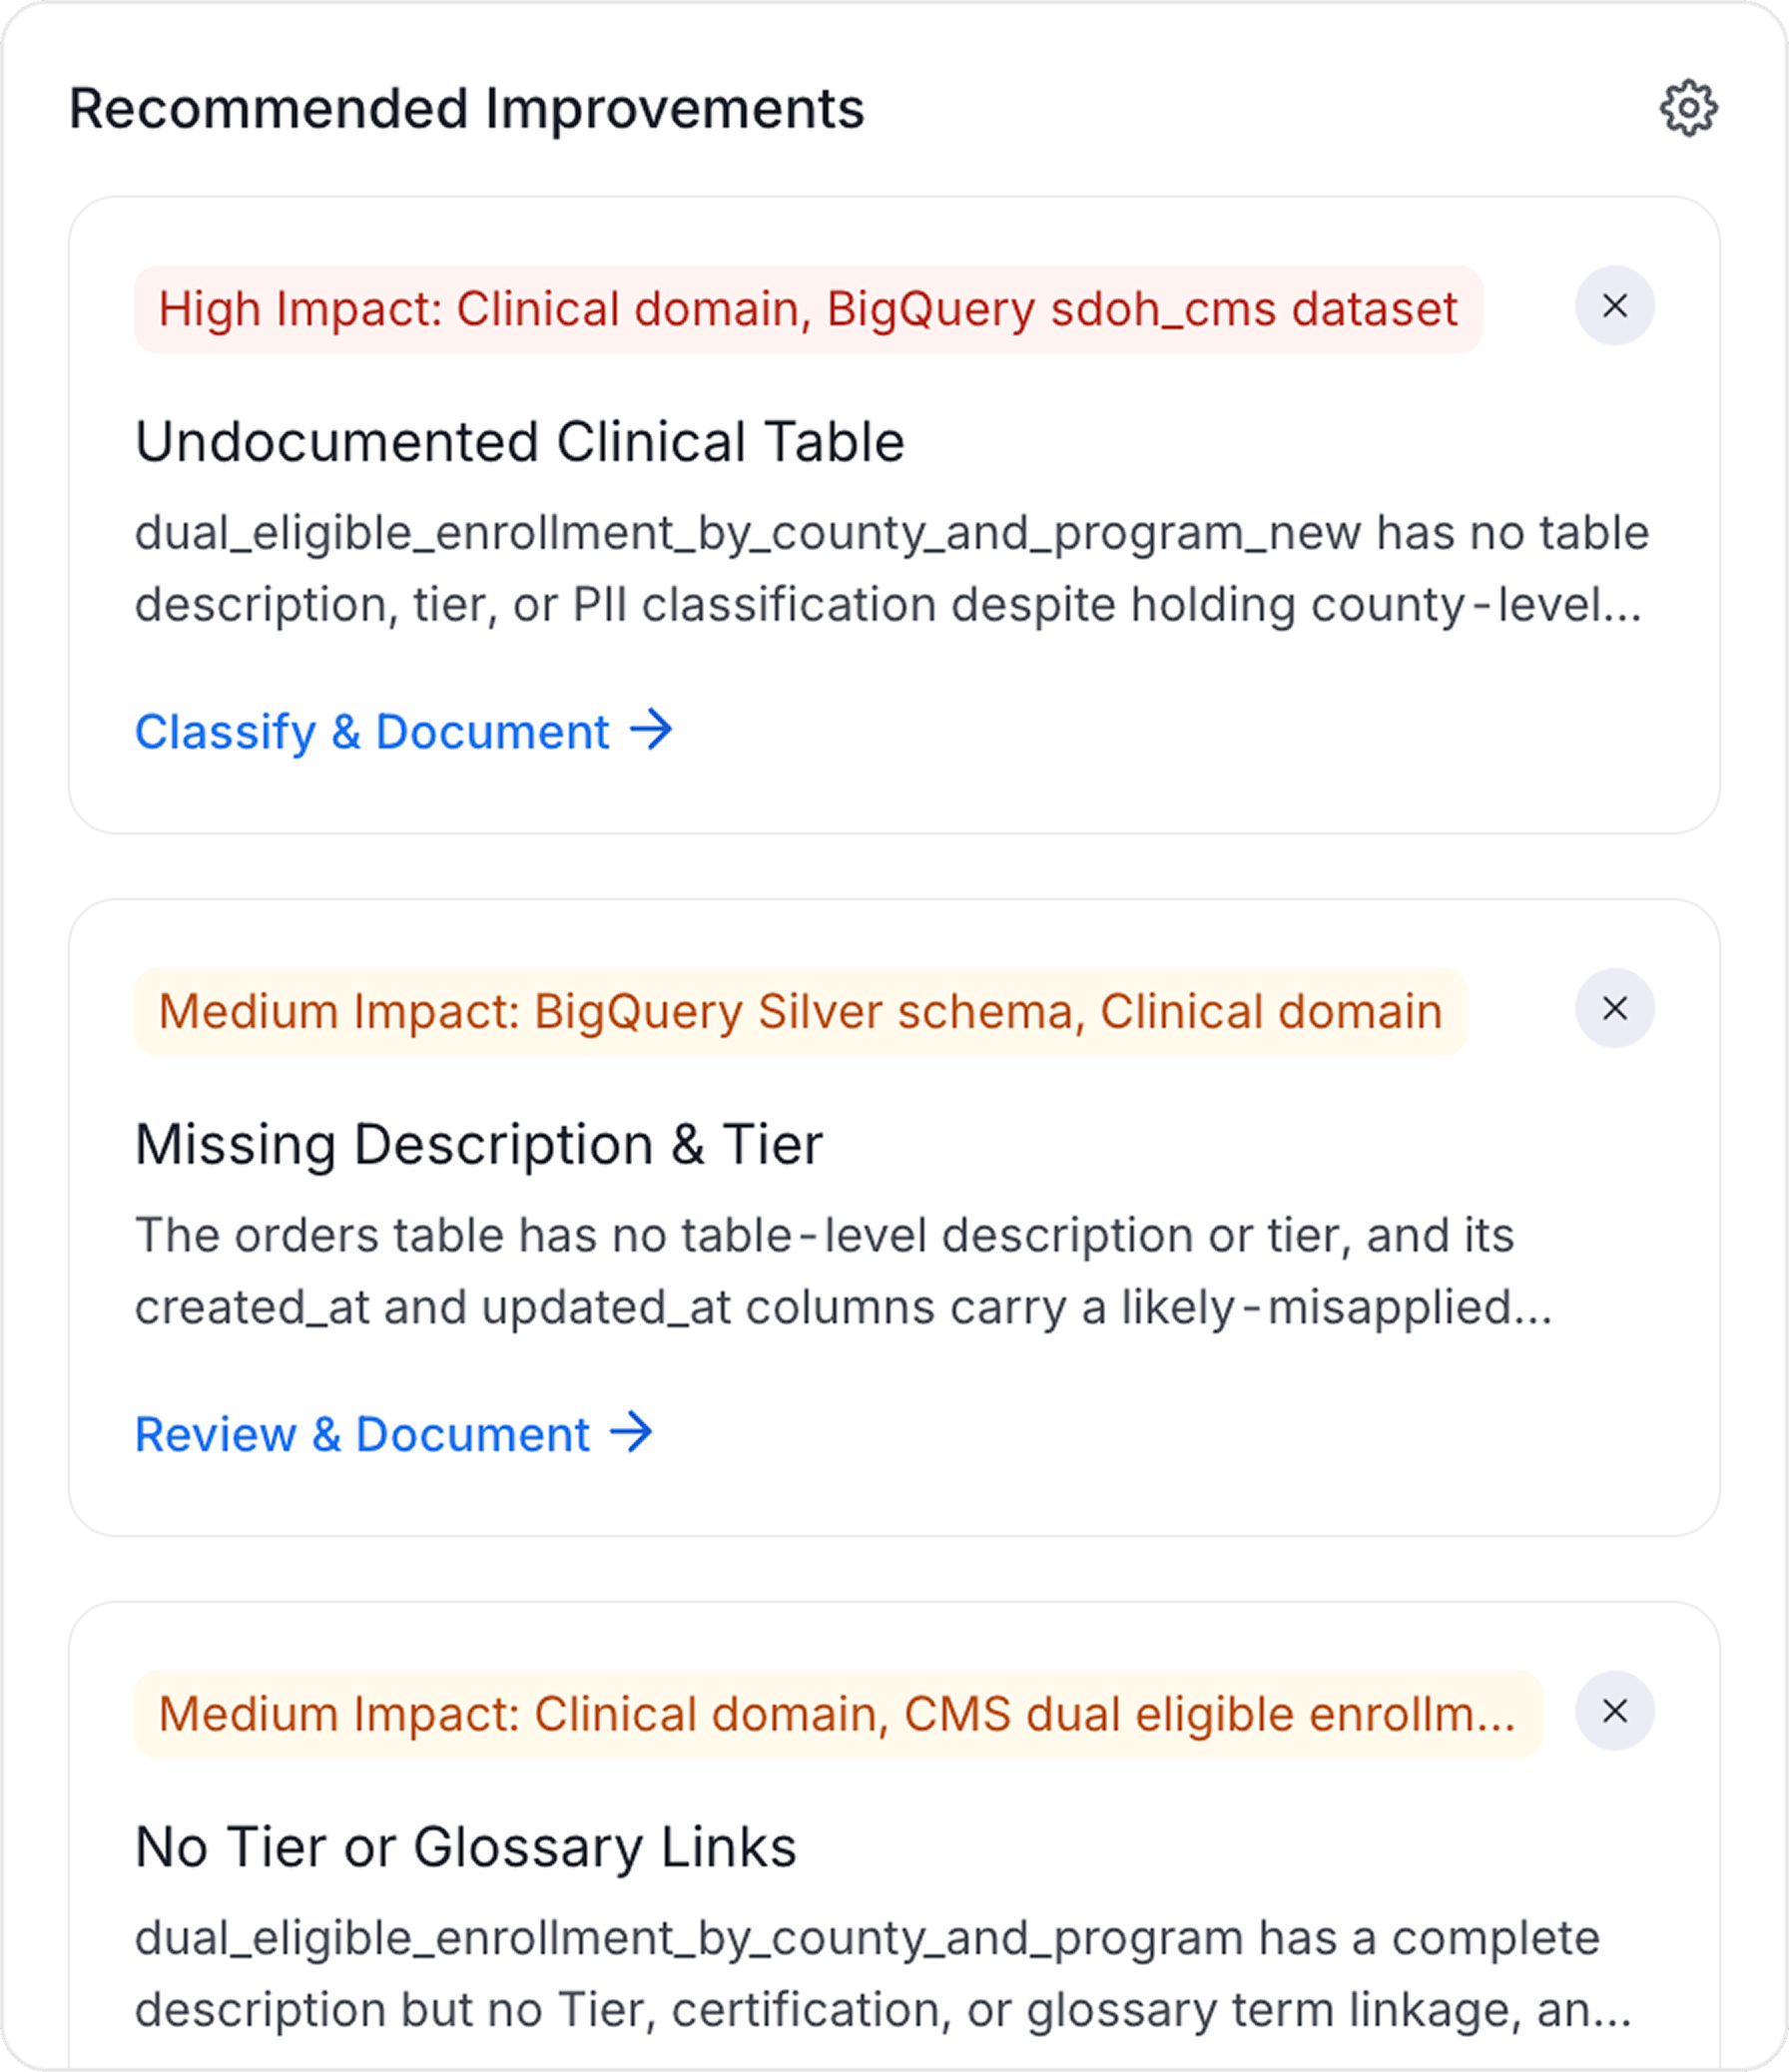
Announcements
Recent announcements posted on data assets you own or follow. Only appears when there are active announcements. Each card shows the announcement’s title, a preview of its description, who posted it, and how long ago. Click a card to jump to the announcement on its asset, or click the X to dismiss it from the widget.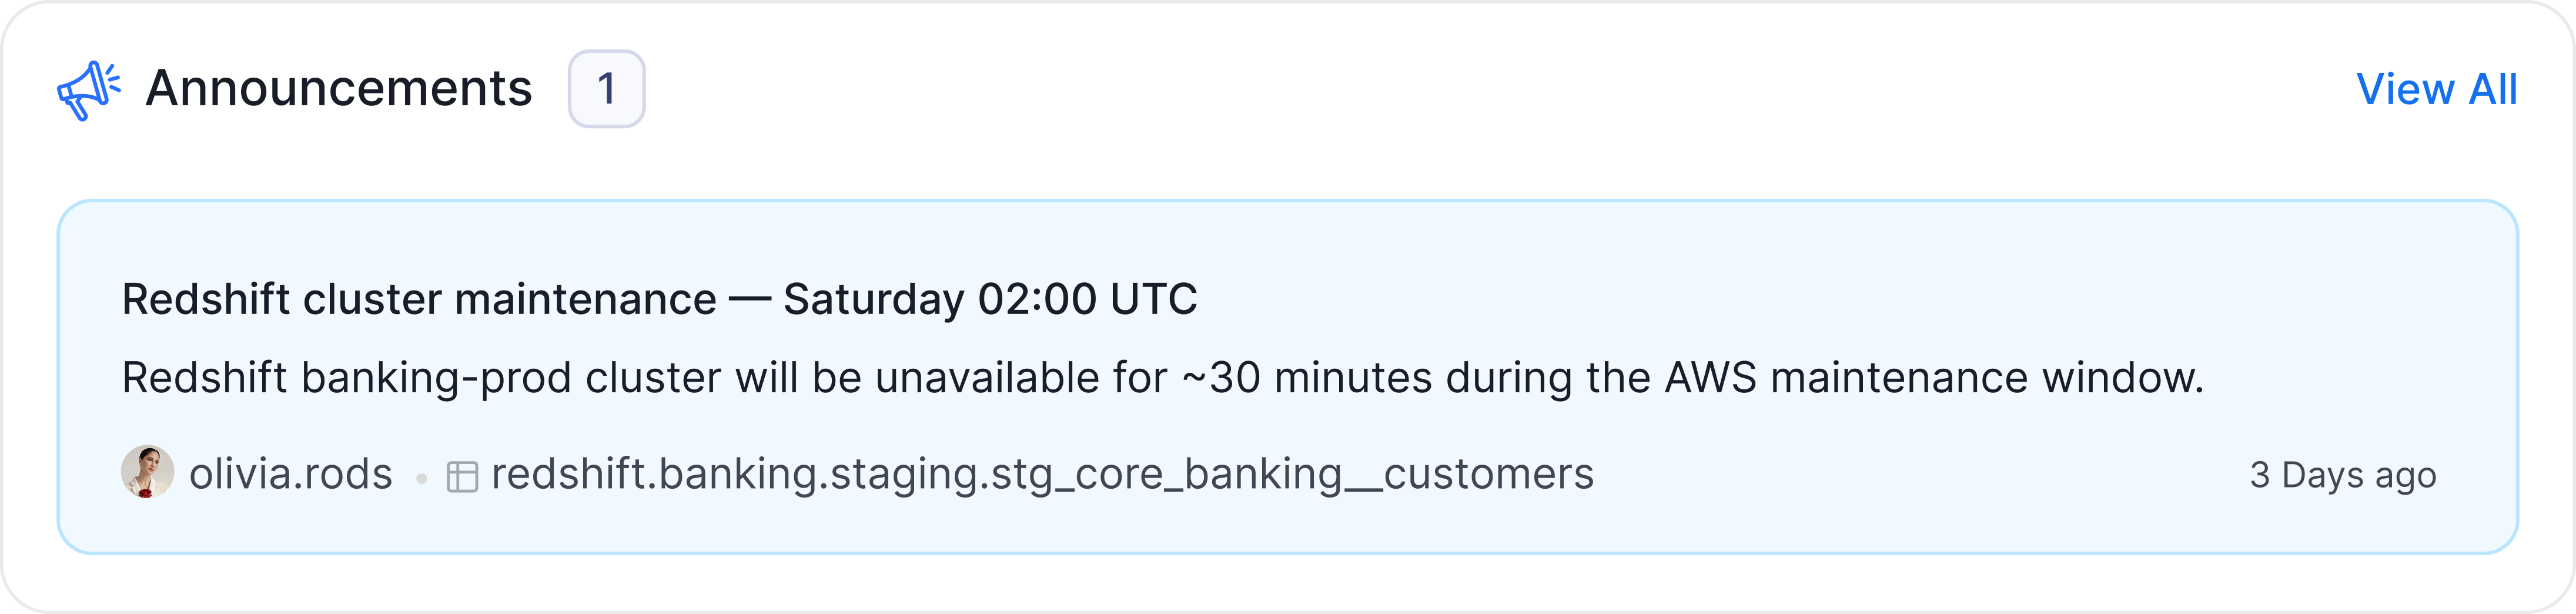
Data Products
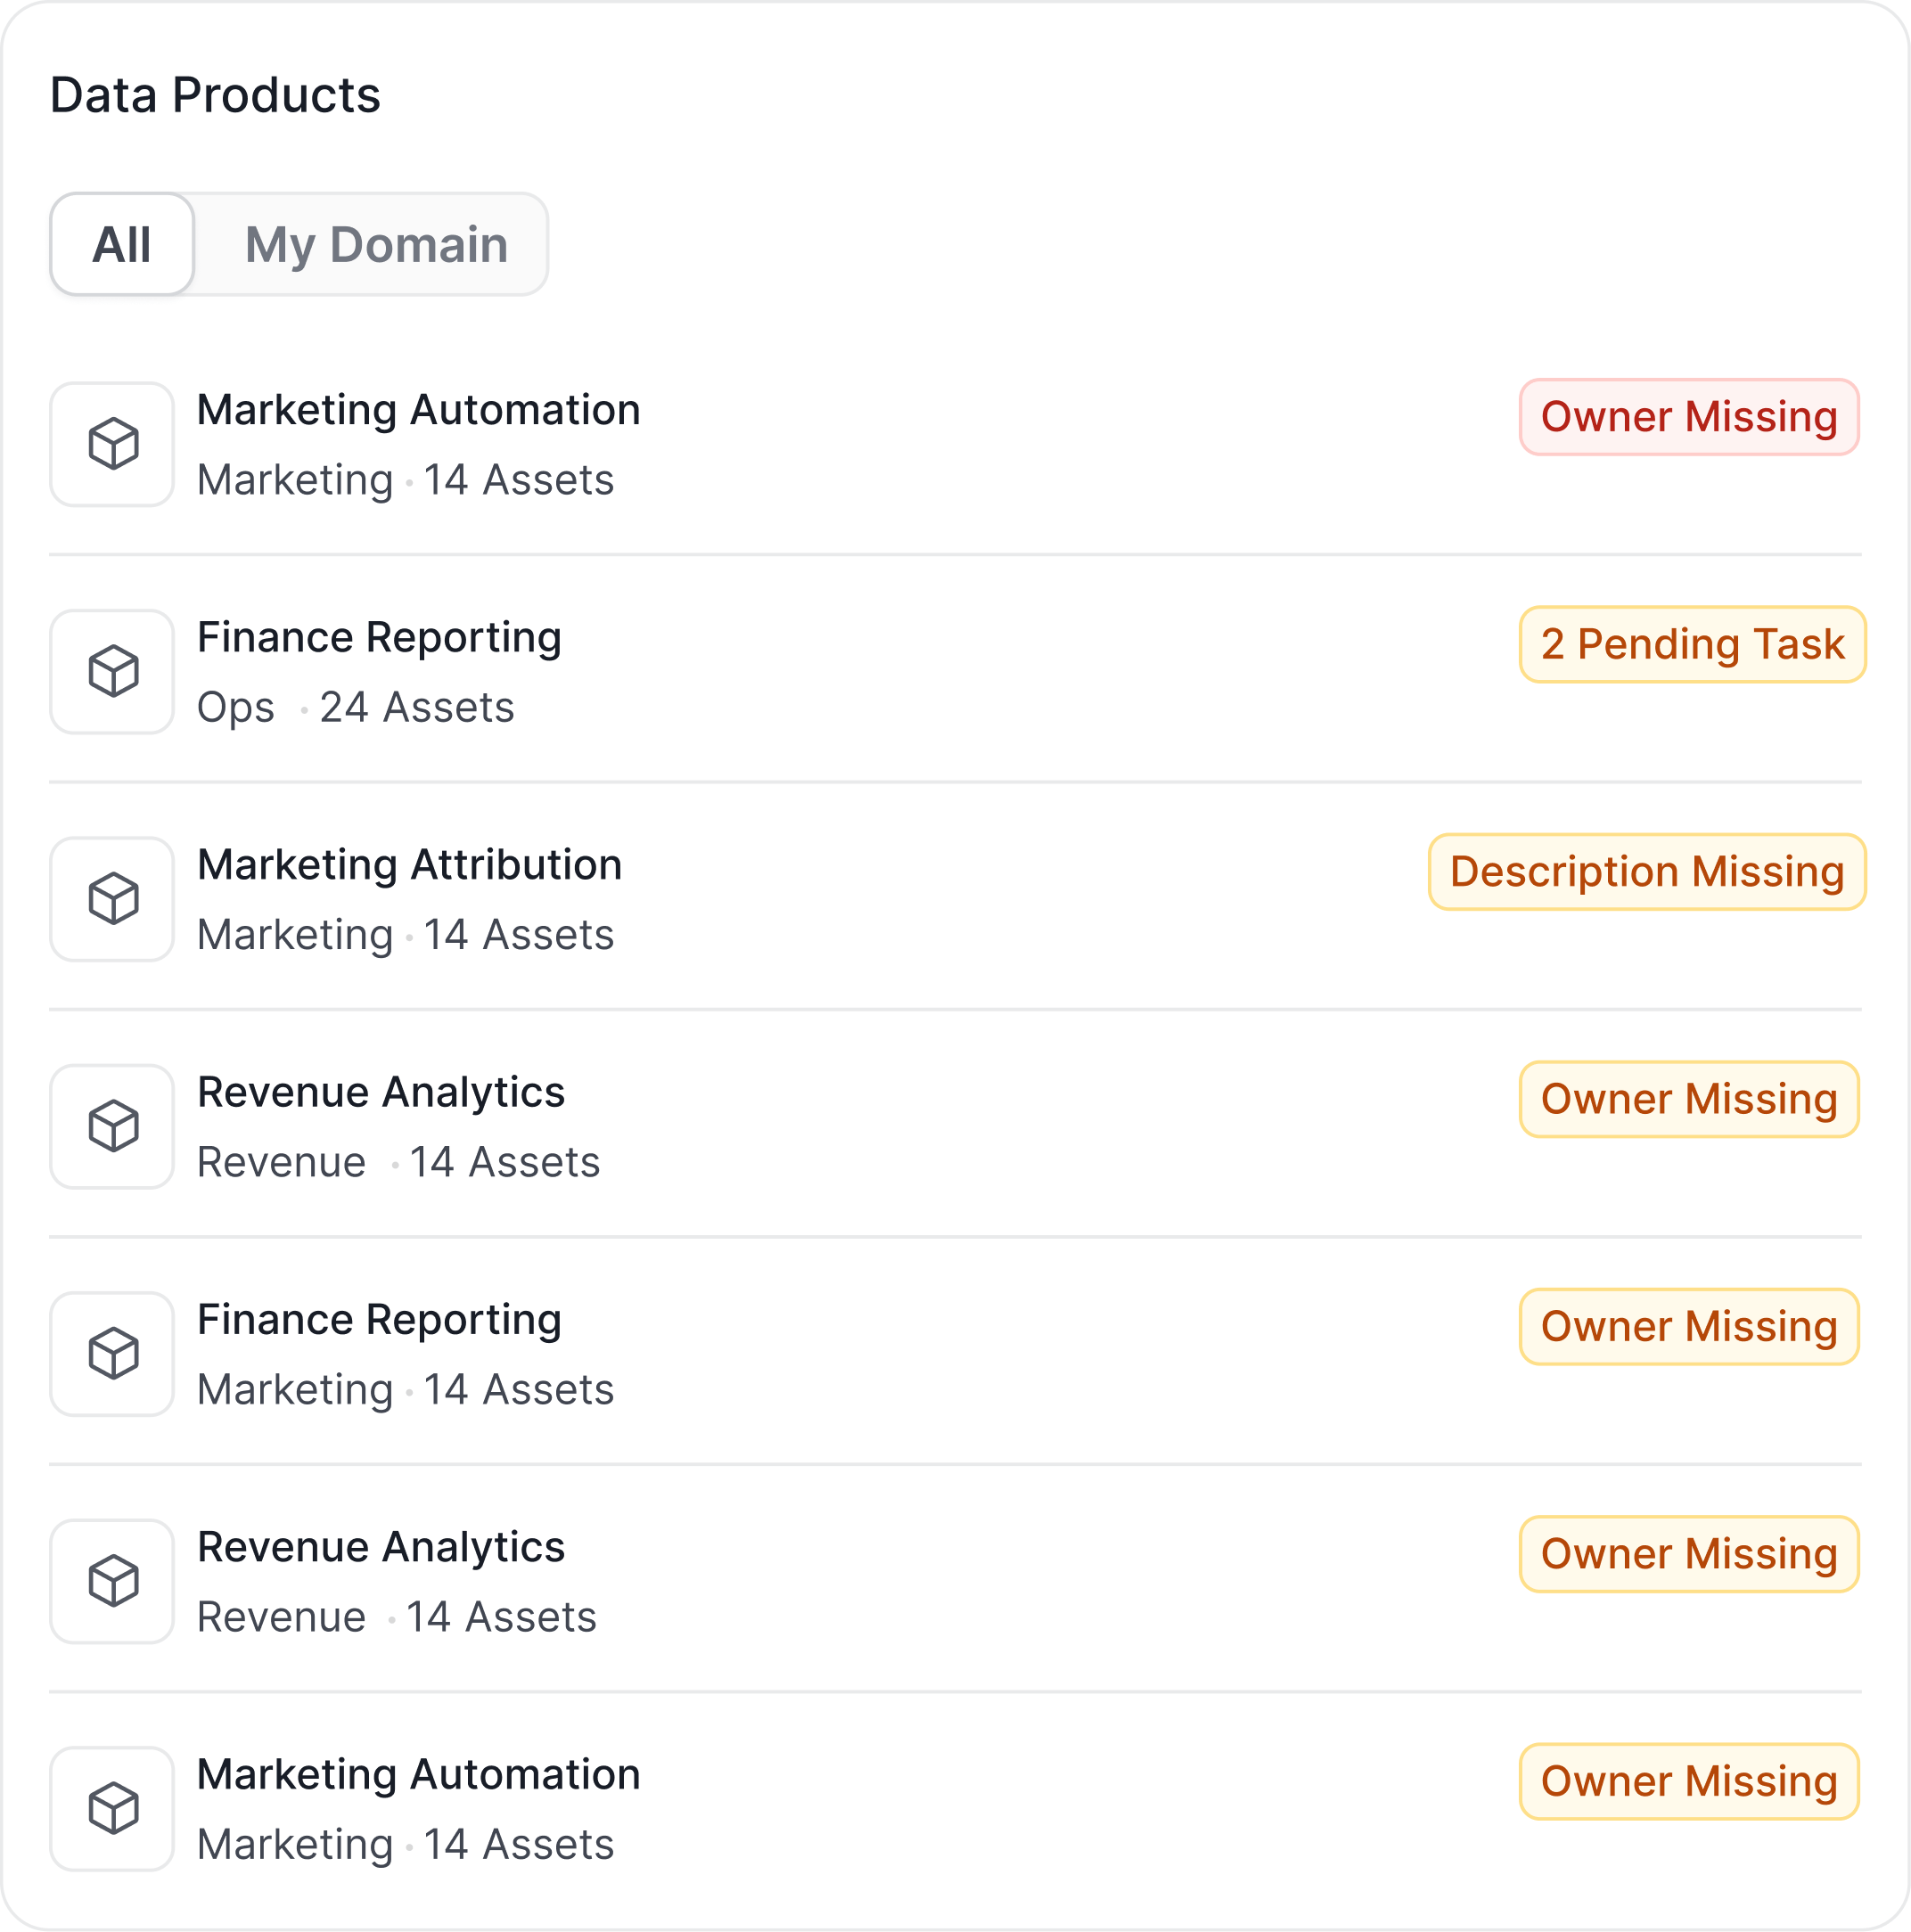
A list of data products published in your organization’s marketplace.- Filter: Switch between All and My Domain to scope the list to data products in your own domain.
- Each row shows the data product’s domain and how many assets it contains.
- Attention badges: A data product missing an owner, description, or domain, or with an expired certification, shows a badge flagging the gap.
- New Data Product: If you have permission, create a new data product directly from the widget.
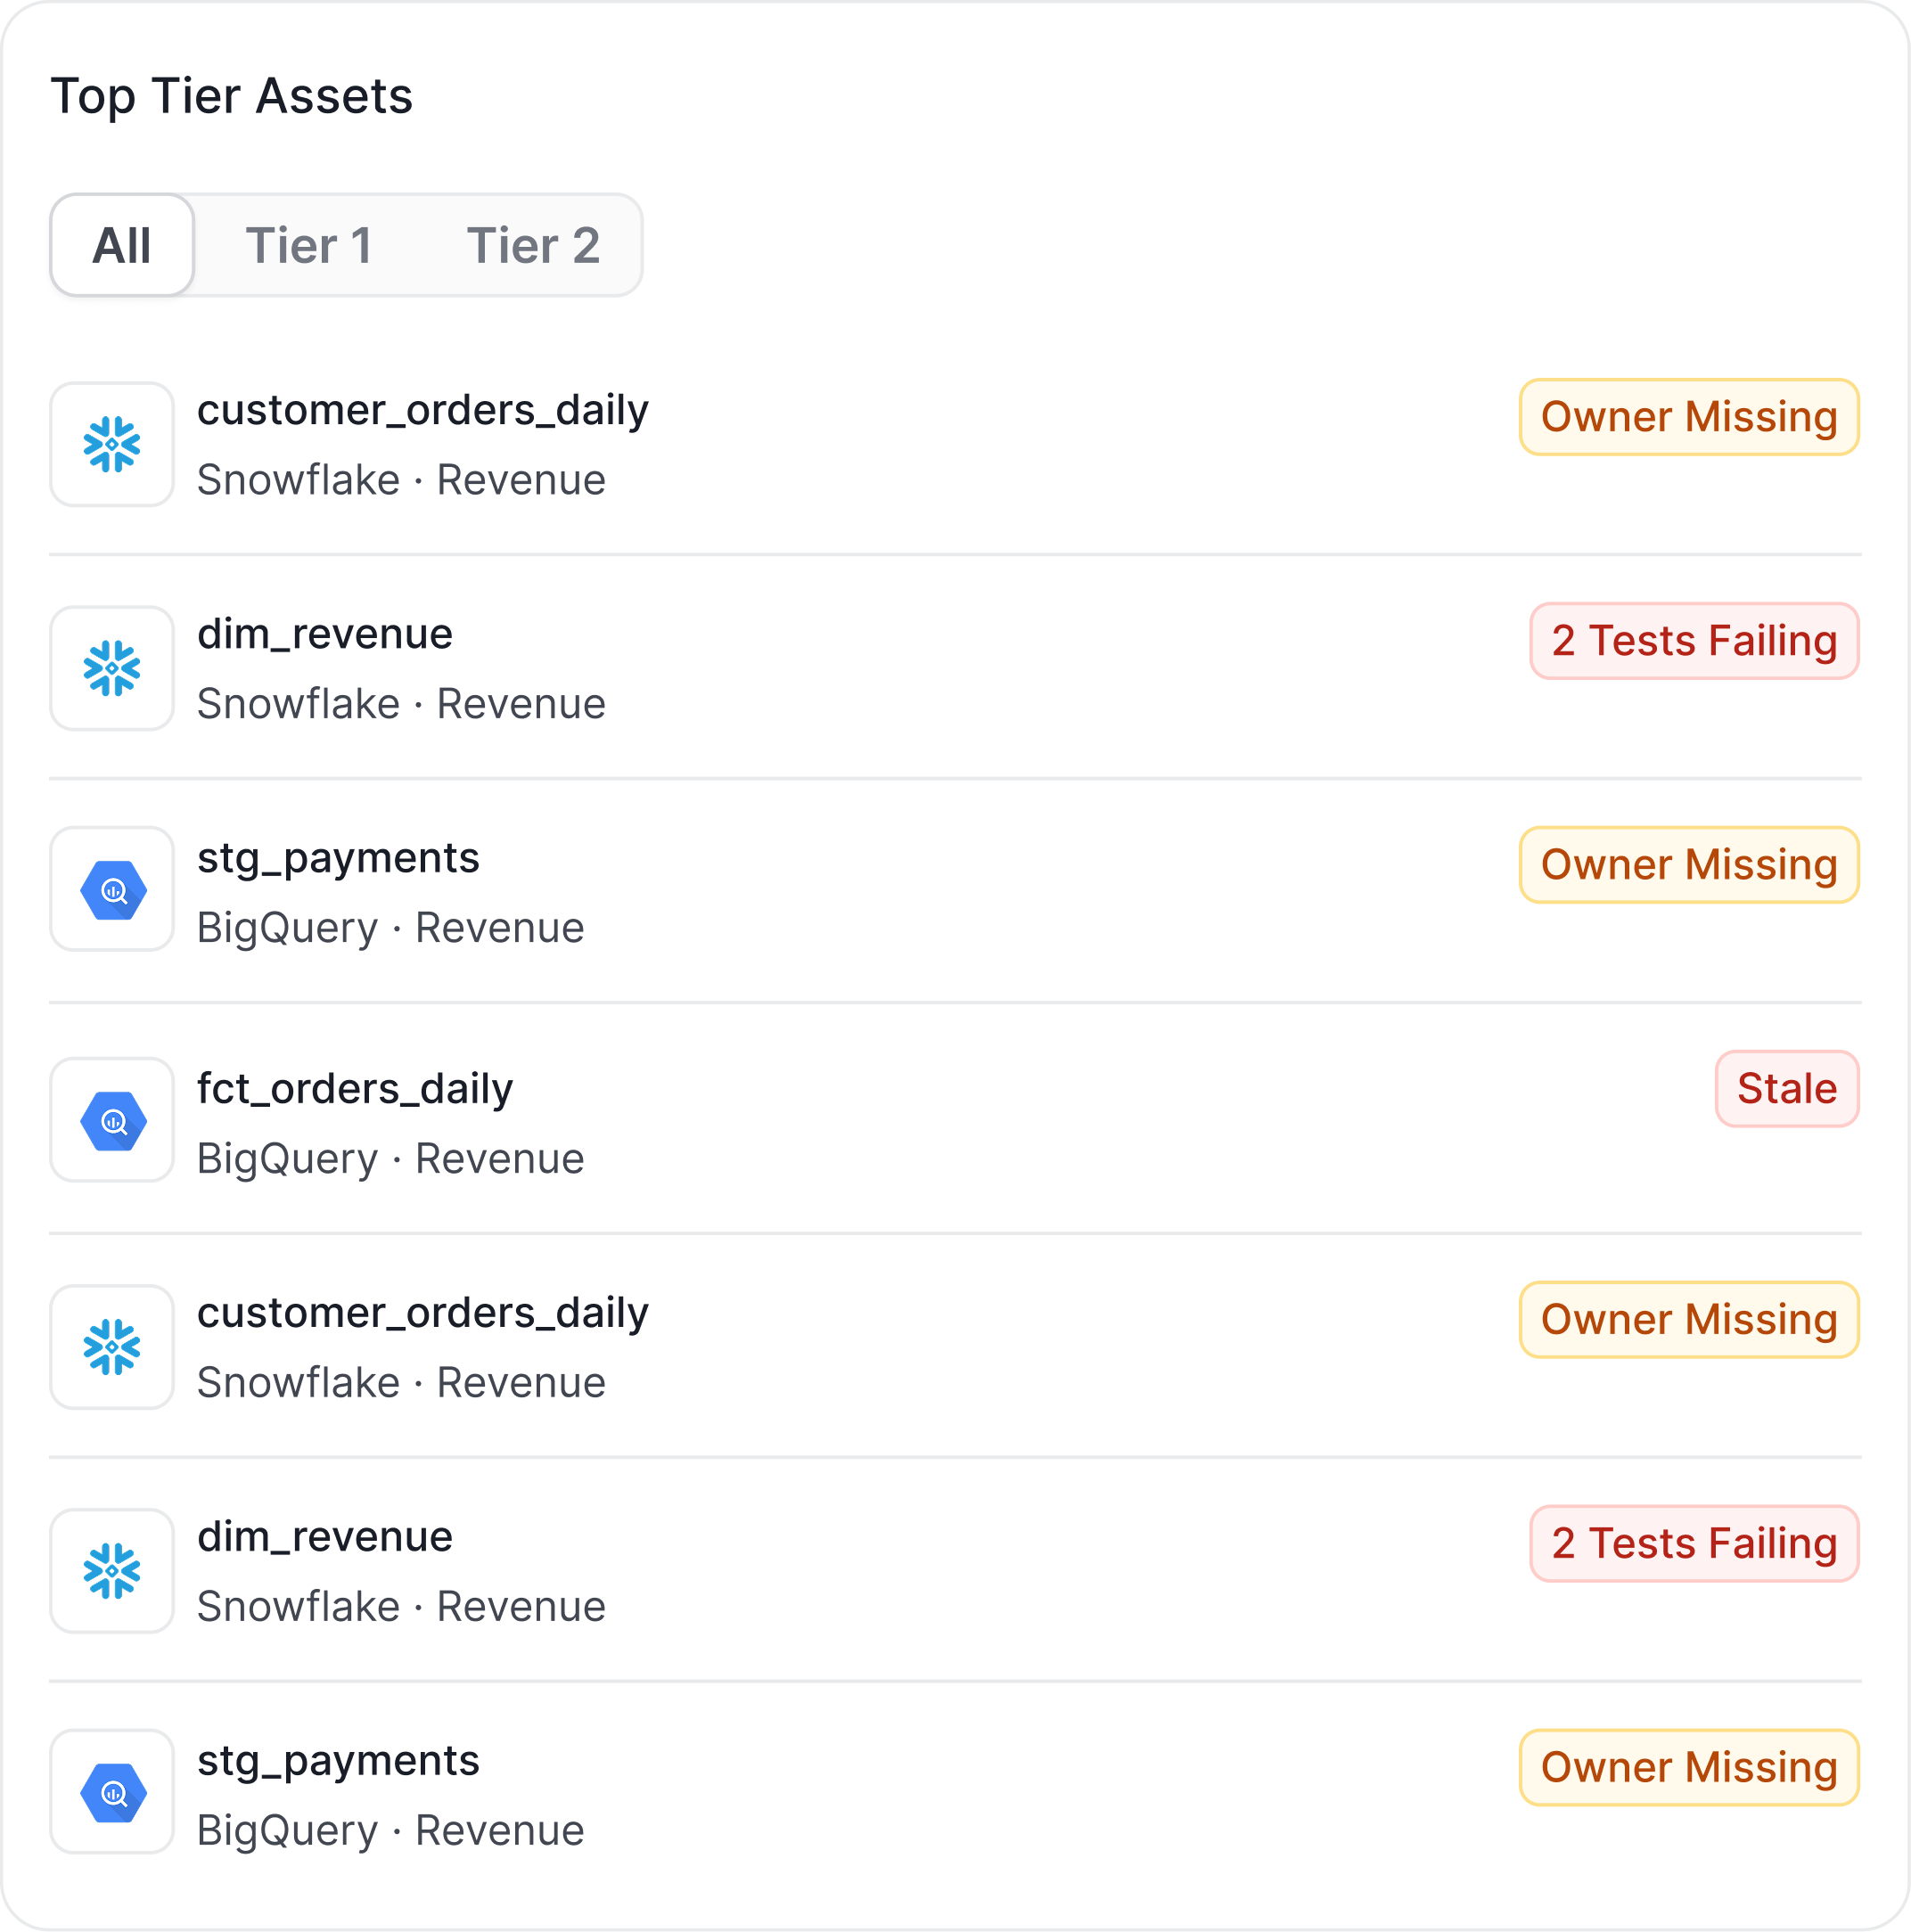
Top Tier Assets
Your most important data assets, surfaced here for quick access and visibility.- Filter: Switch between All, Tier 1, and Tier 2 to narrow the list.
- Results are sorted alphabetically and limited to assets you have permission to view.
- Attention badges: The same governance-gap badges as Data Products (missing owner, description, domain, expired certification, or undocumented columns) appear here too, so you can spot high-visibility assets that need cleanup.