
Data Quality Tab
The Profiler & Data Quality tab appears on every Table page and gives you three sub-tabs to explore your data’s health:- Table Profile: Summary statistics and row counts for the table
- Column Profile: Column-level statistics including nulls, distinct values, and value distributions
- Data Quality: Test results for all tests run on this table
Viewing Test Results
The Data Quality sub-tab shows a summary of all tests run on the table — how many passed, failed, or were aborted — along with a list of individual test cases showing which table or column each test covers.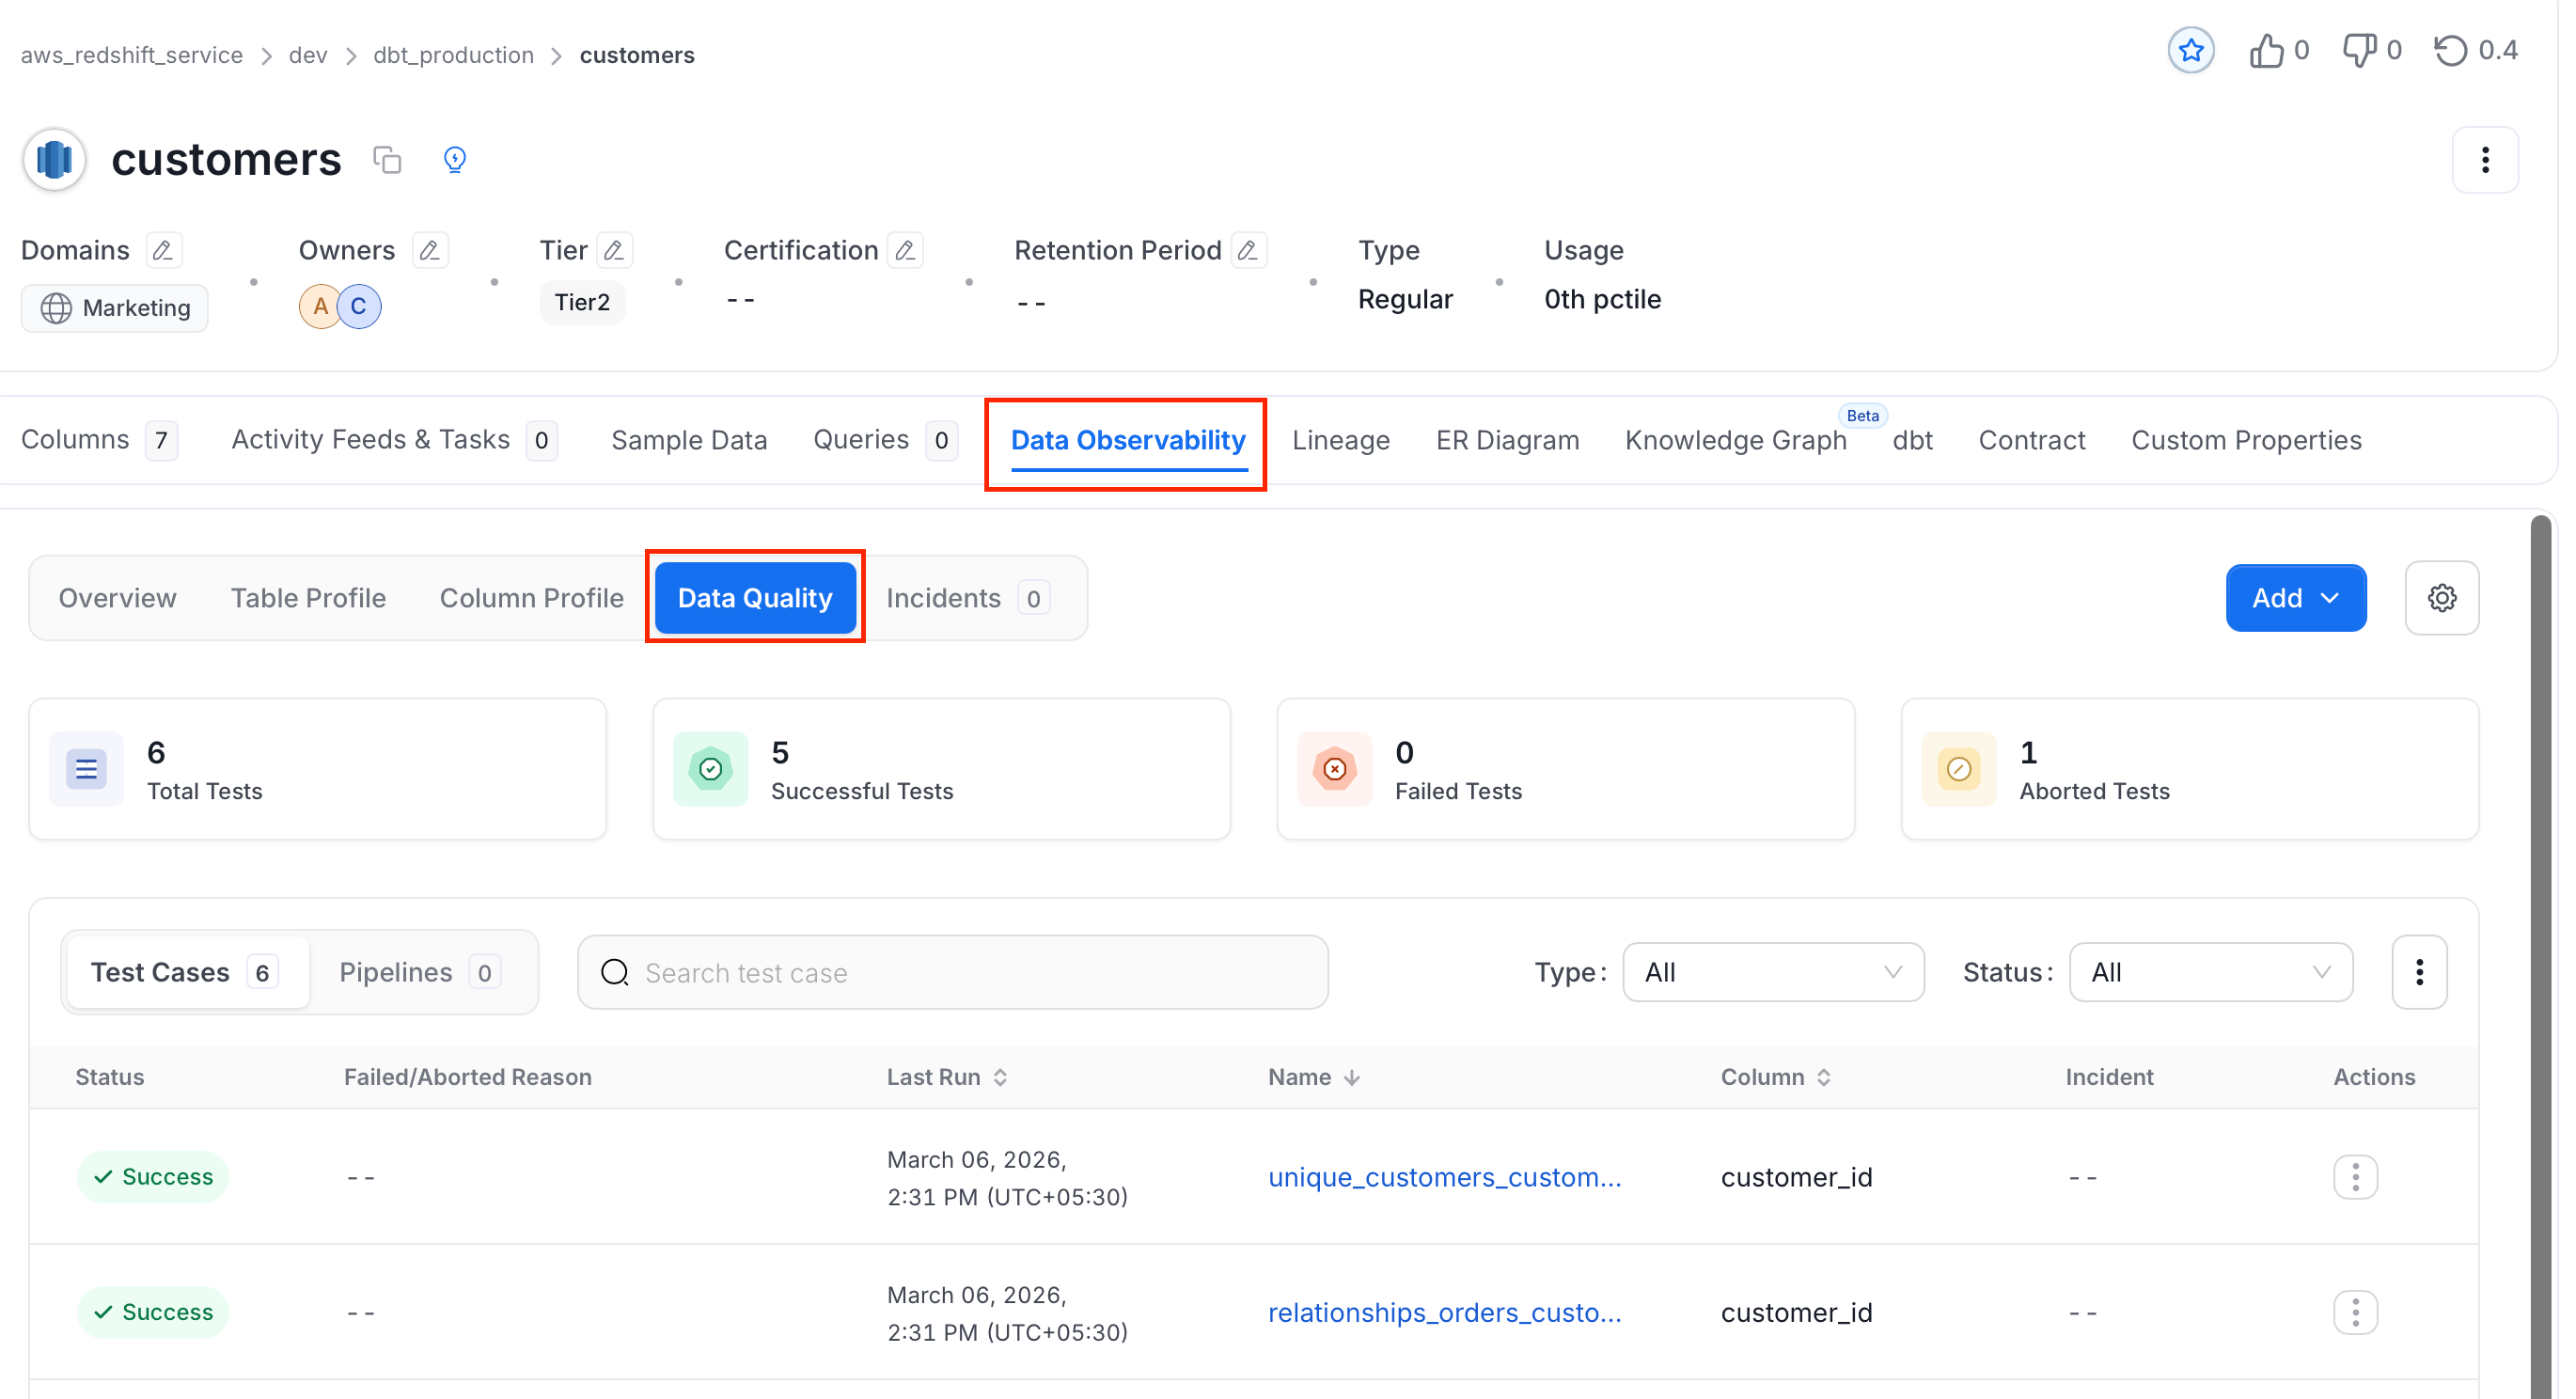
How to Write and Deploy No-Code Test Cases from the UI
Verify your data quality with table and column level tests.