Data Observability Overview
The Overview sub-tab on a Table’s Data Observability page gives you an instant snapshot of that table’s quality health — without digging through individual test cases.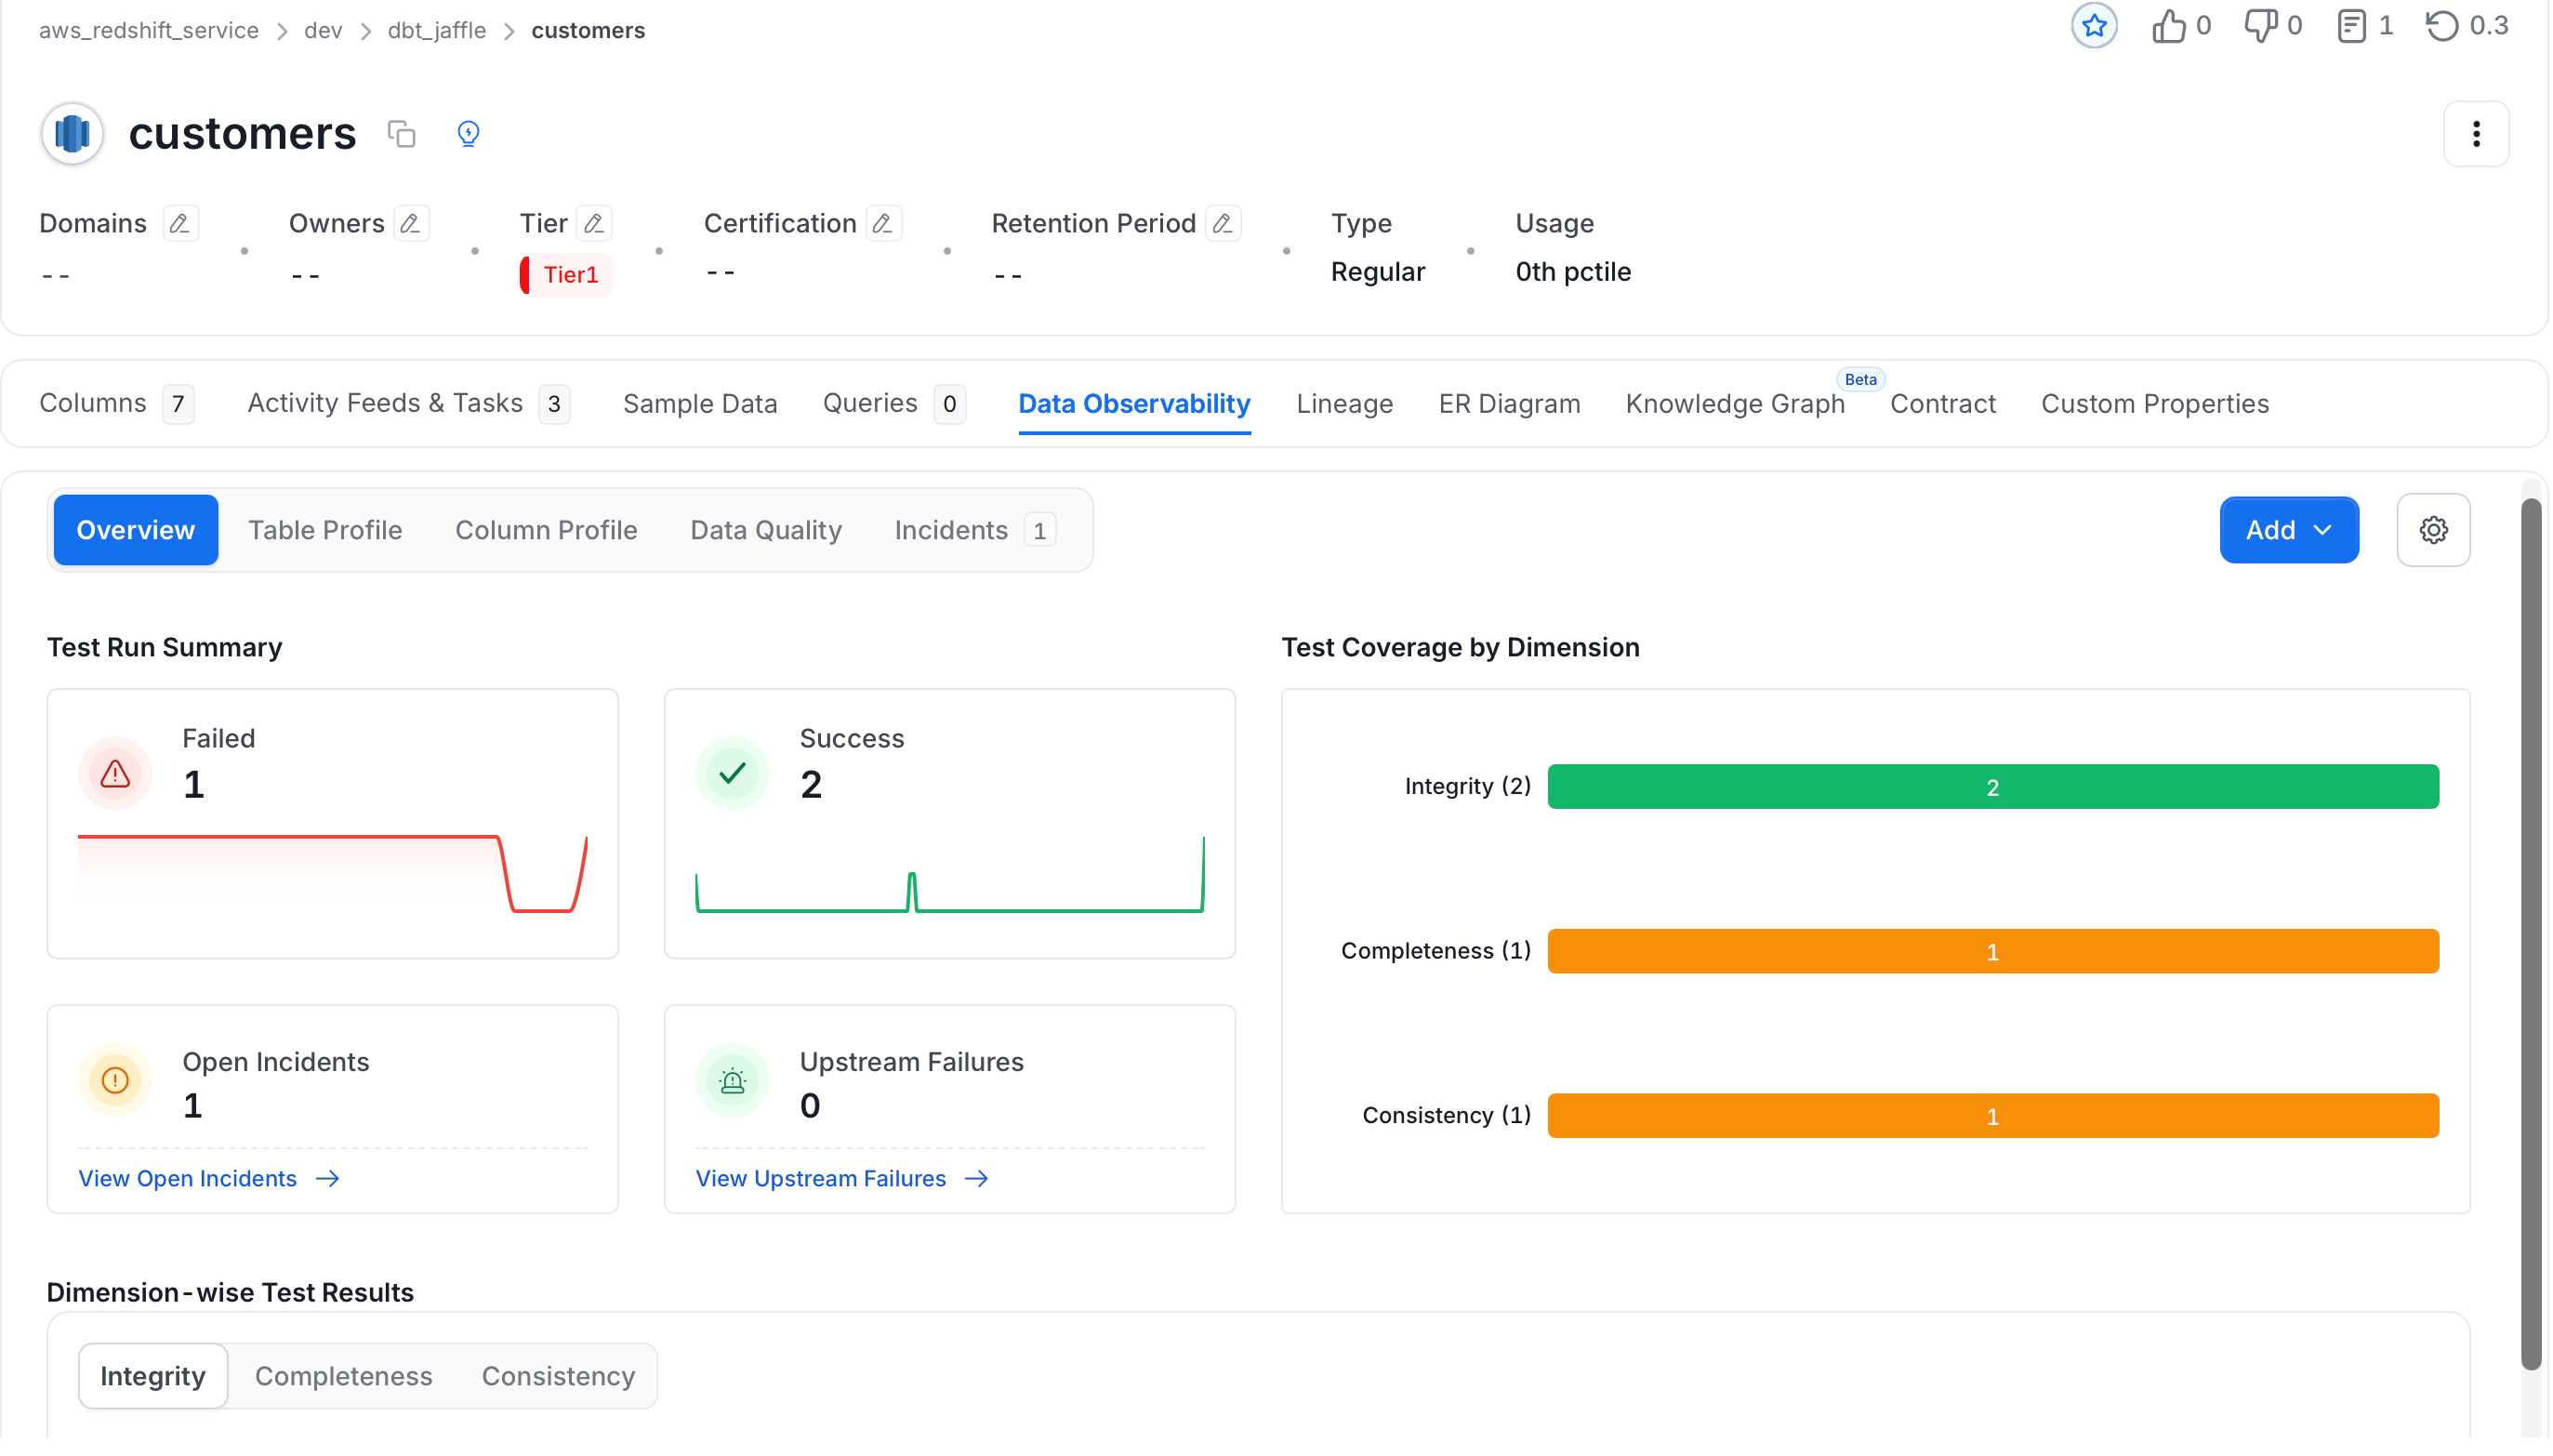
Test Run Summary
The top section shows four key metrics for the table:- Failed: Number of tests that failed in the selected time window, with a trend chart showing how failures have changed over time
- Success: Number of tests that passed, with a trend chart
- Open Incidents: Active incidents triggered by test failures — click View Open Incidents to jump straight to the incident list
- Upstream Failures: Test failures in tables upstream in your lineage that may be causing issues here — click View Upstream Failures to investigate
Test Coverage by Dimension
The bar chart on the right shows how your tests are distributed across quality dimensions — Integrity, Completeness, Consistency, and so on. Use this to spot gaps: if a dimension has no bar, you have no tests covering that category for this table.Dimension-wise Test Results
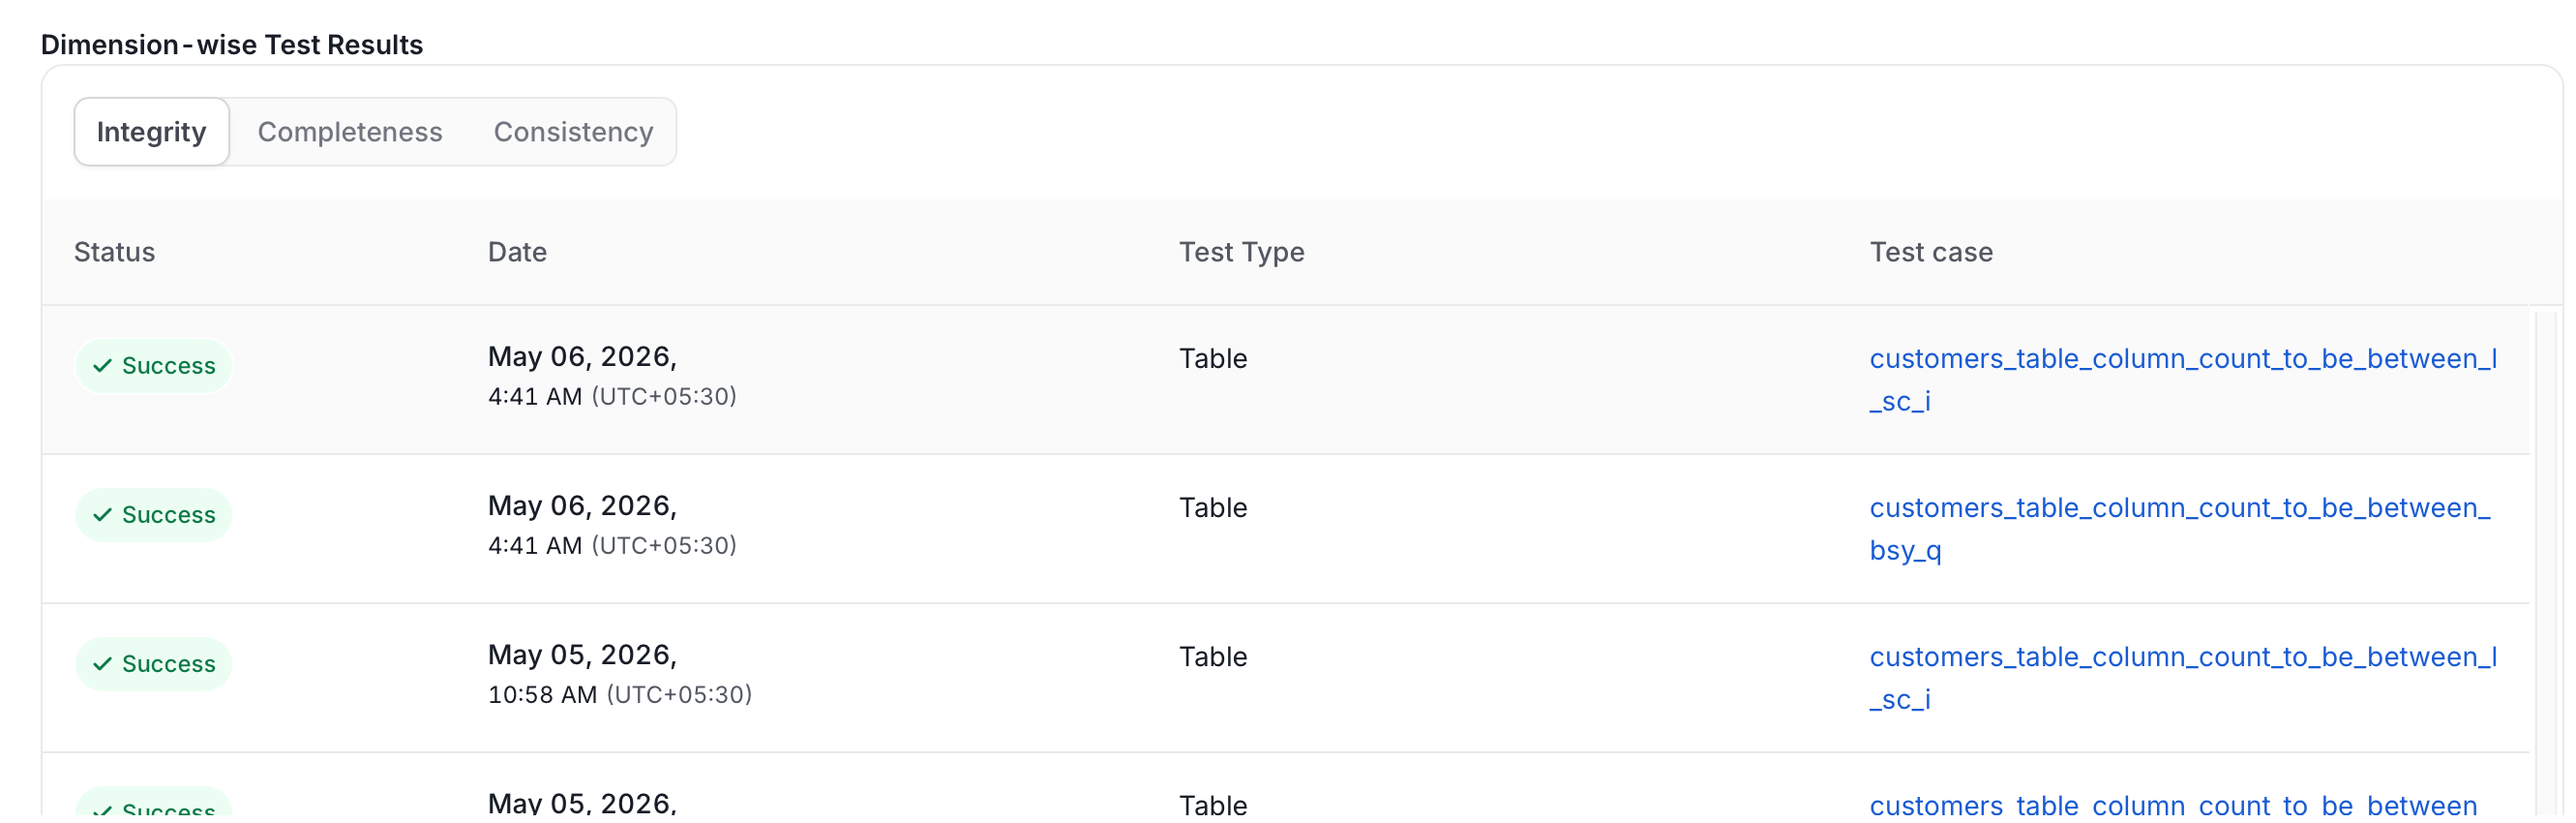
Scroll down to see test results broken down by dimension. Each tab shows the test cases assigned to that category and their current pass/fail status.- Integrity: Tests that validate the structural rules of your data — for example, checking that column counts, row counts, or foreign key relationships are within expected bounds
- Completeness: Tests that check for missing or null values — ensuring required fields are populated where they should be
- Consistency: Tests that verify data stays stable and predictable across processing steps — for example, comparing values between tables or checking that a column’s value distribution hasn’t shifted unexpectedly
- Accuracy: Tests that confirm values reflect real-world expectations — for example, that a price column stays within a valid range
- Uniqueness: Tests that catch duplicate values where only unique entries are expected
- Validity: Tests that enforce formatting or domain rules — for example, that an email column matches a valid pattern