
Overview of Data Assets
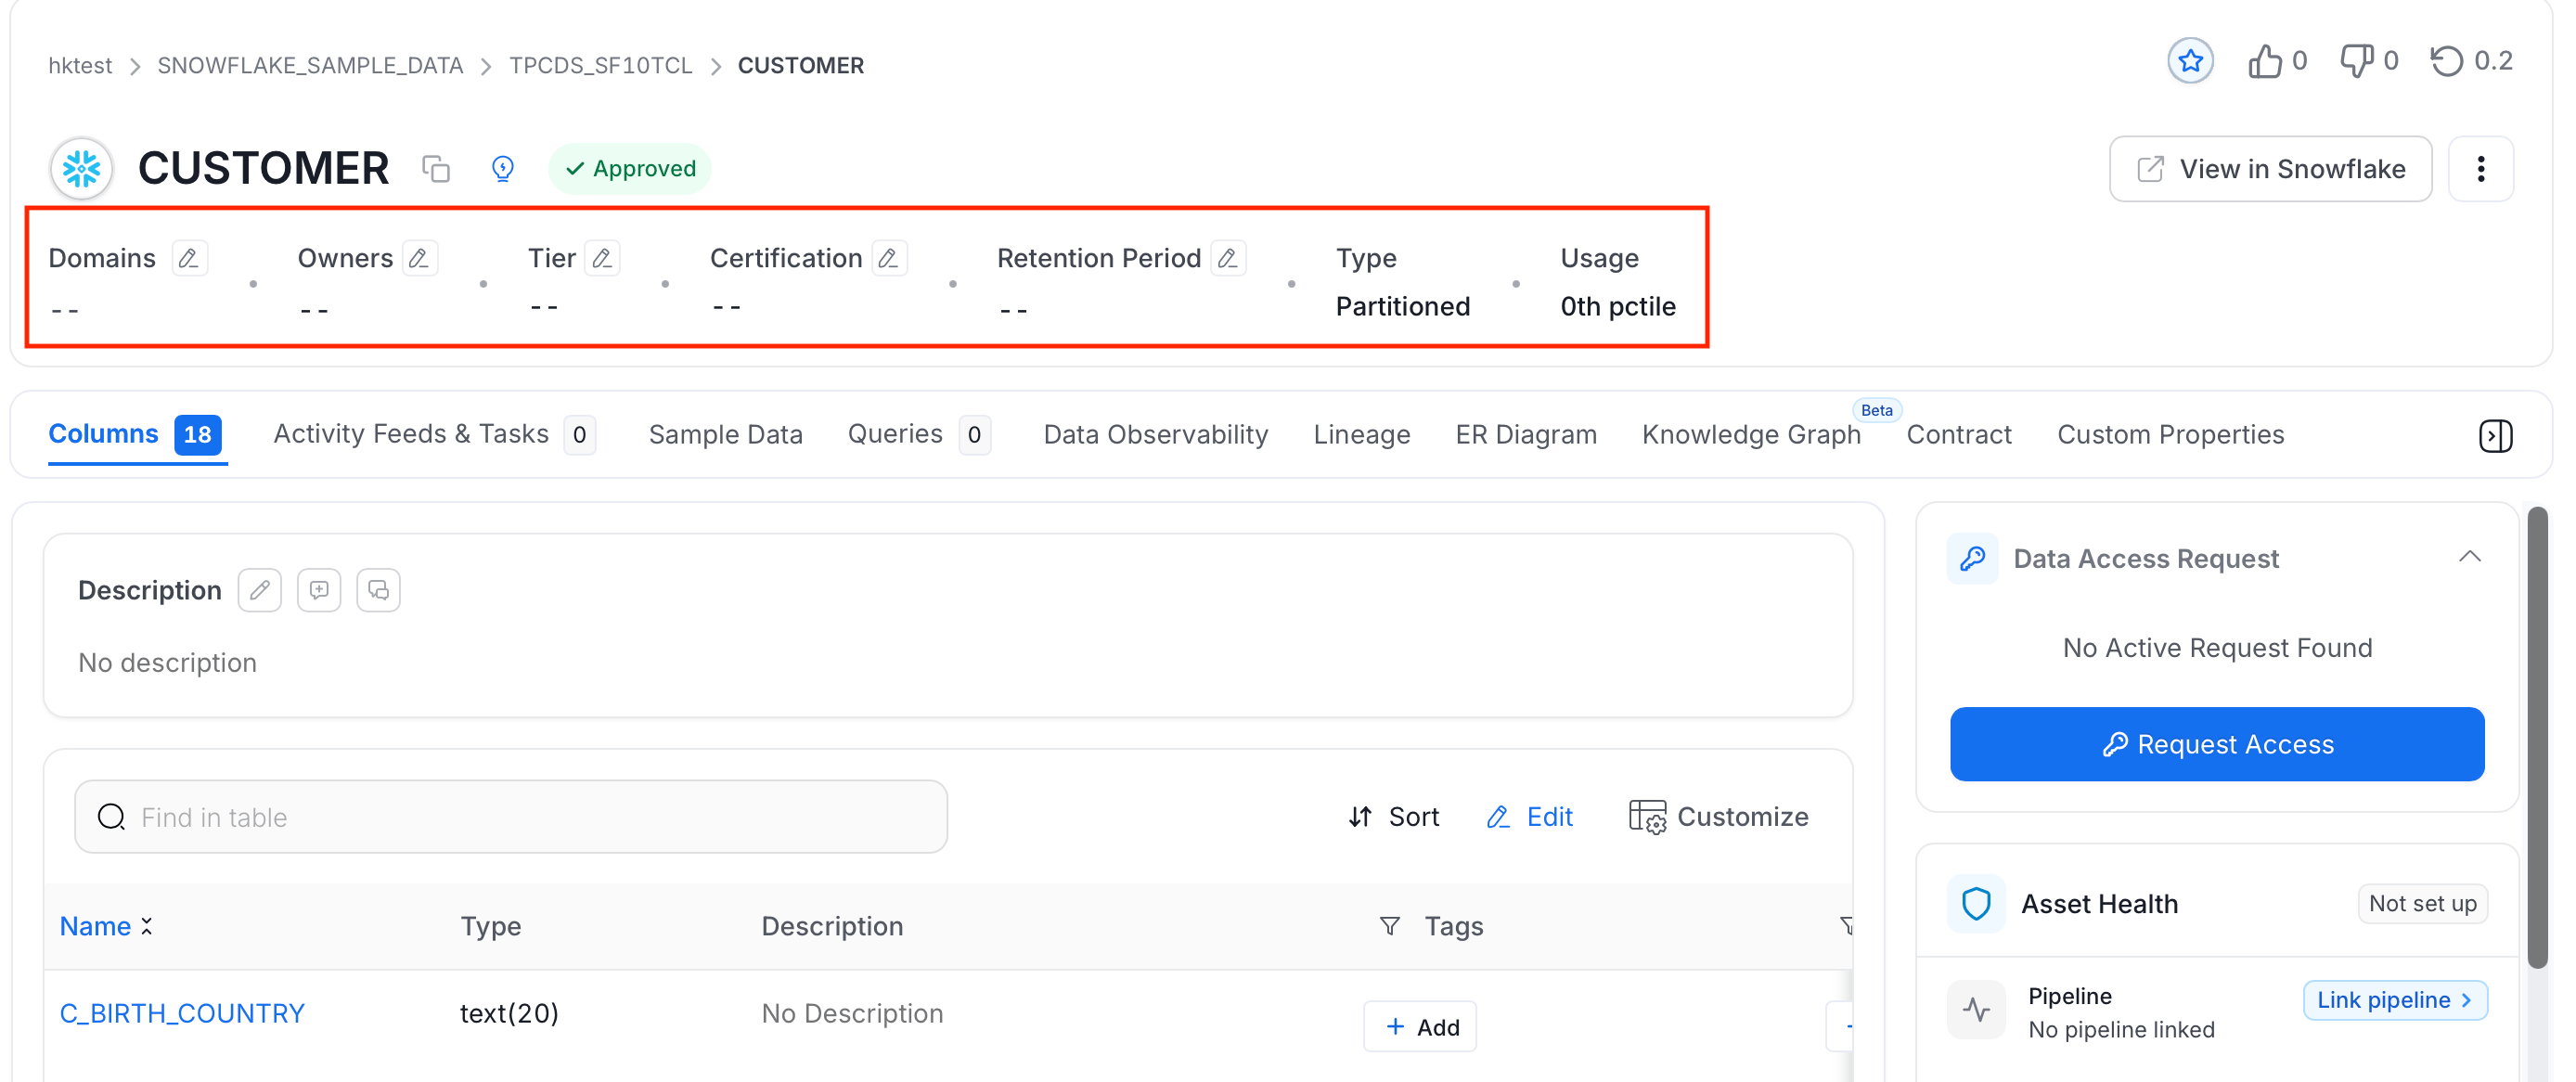
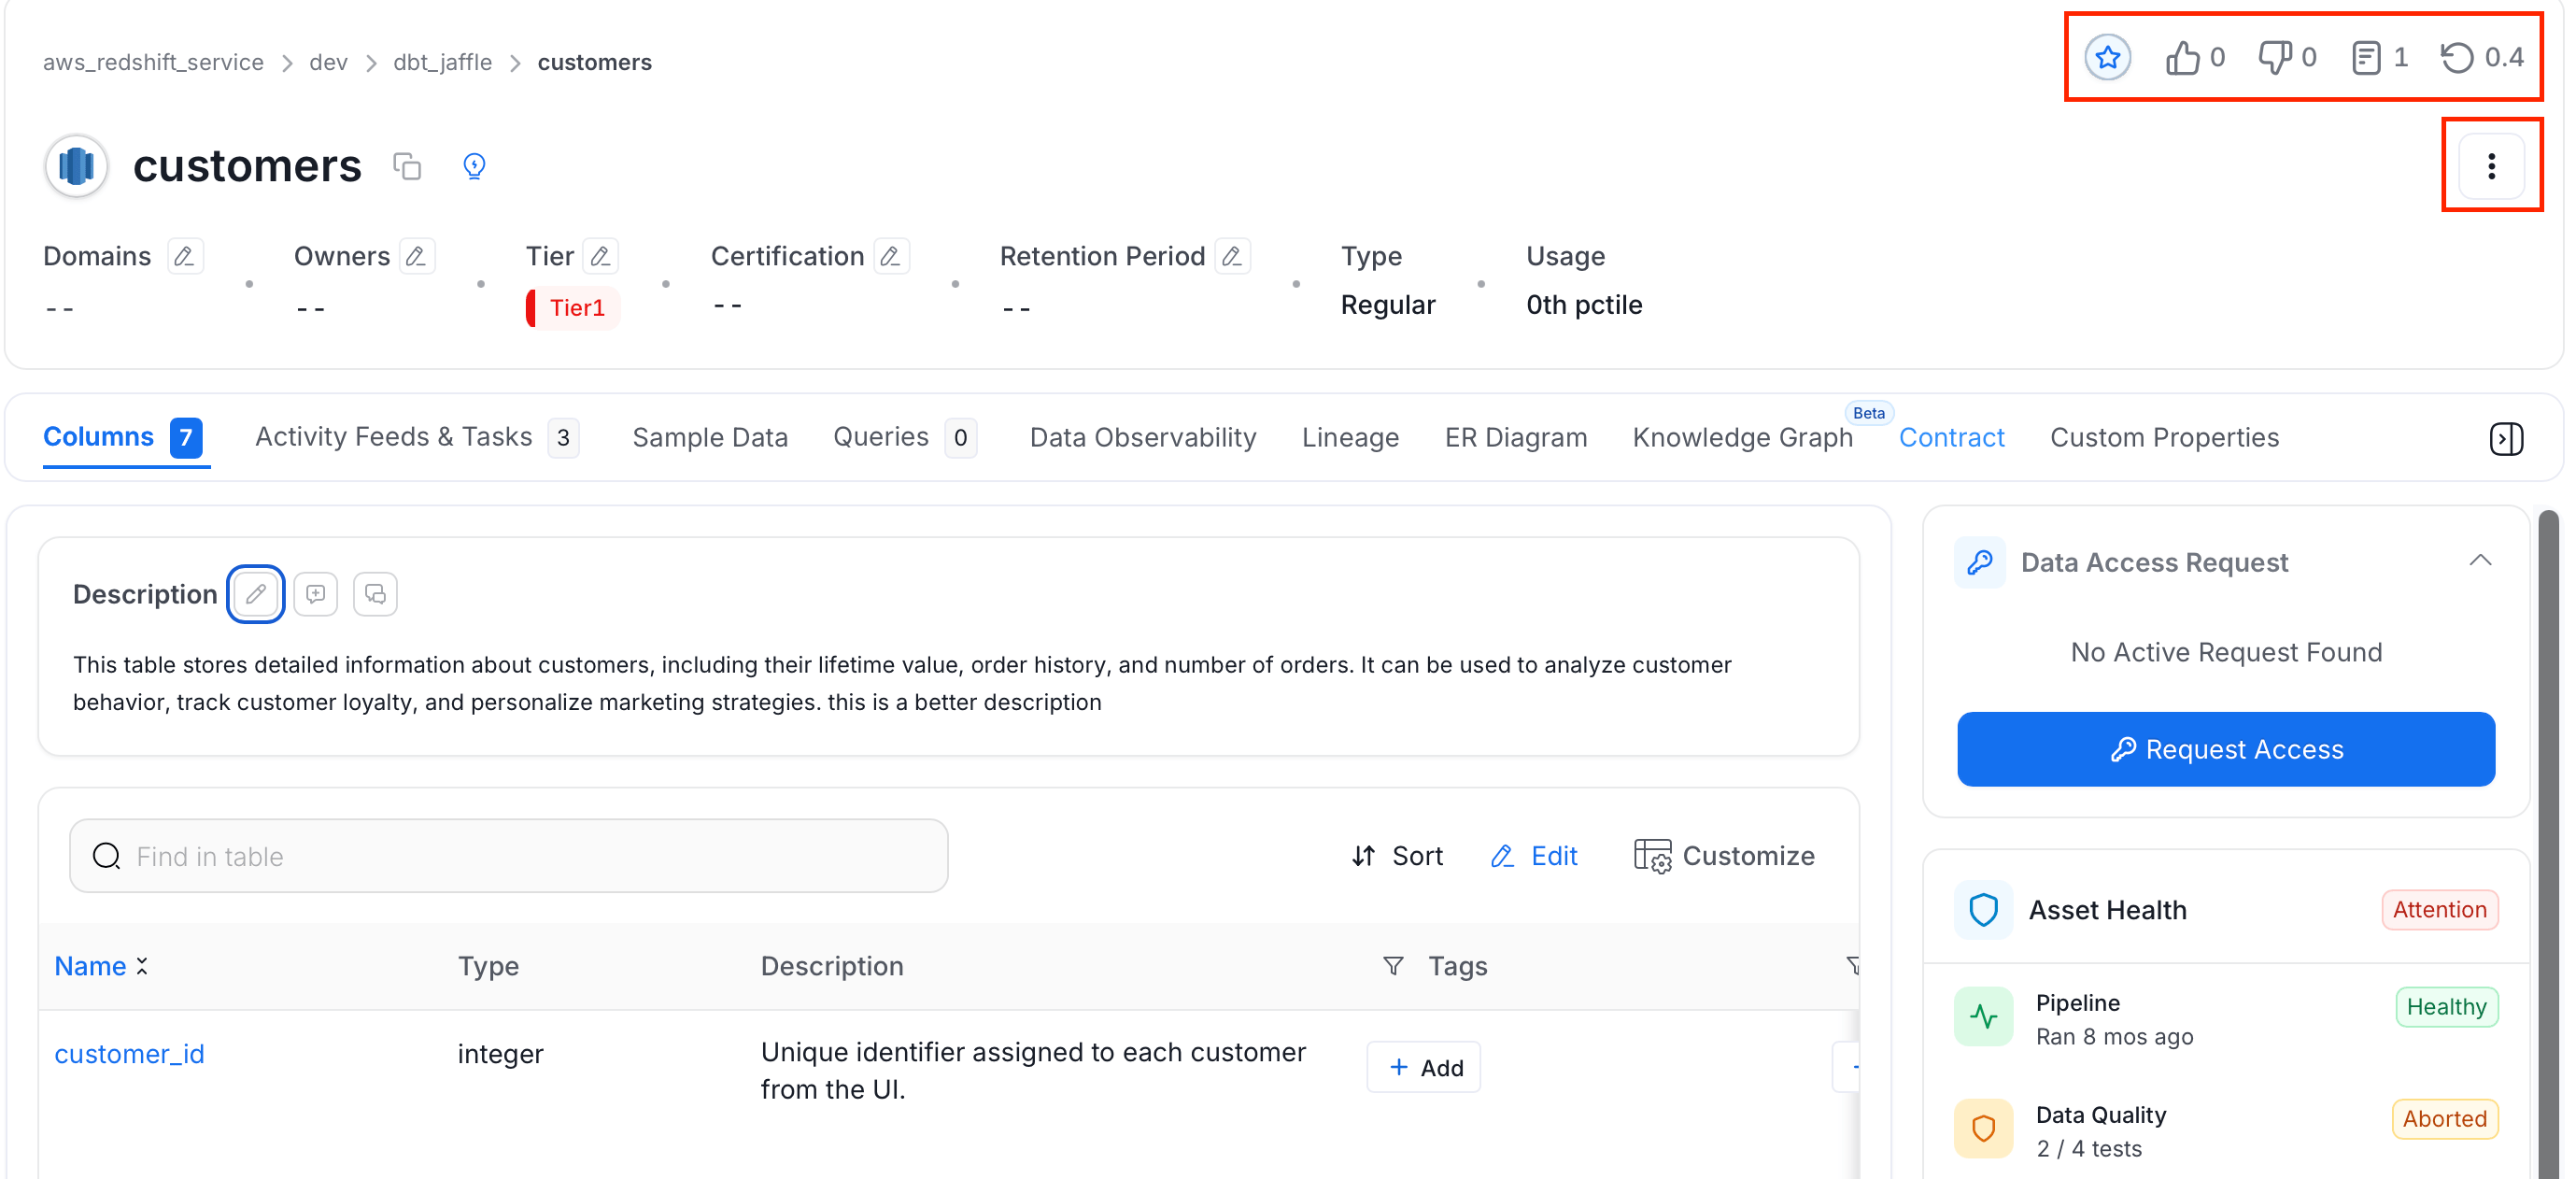
Every data asset in Collate has a dedicated detail page that gives you a complete picture of that asset — from schema and sample data to lineage, data quality, and governance. The top panel shows key metadata at a glance:- Source — the connected data service
- Owner — team or user responsible for the asset
- Tier — data criticality level
- Type — asset type (Table, Topic, Dashboard, etc.)
- Usage — query and access frequency
- Description — what the asset contains and how it’s used
Data Asset Tabs
Tabs vary depending on the type of data asset. The table below shows which tabs are available for each asset type.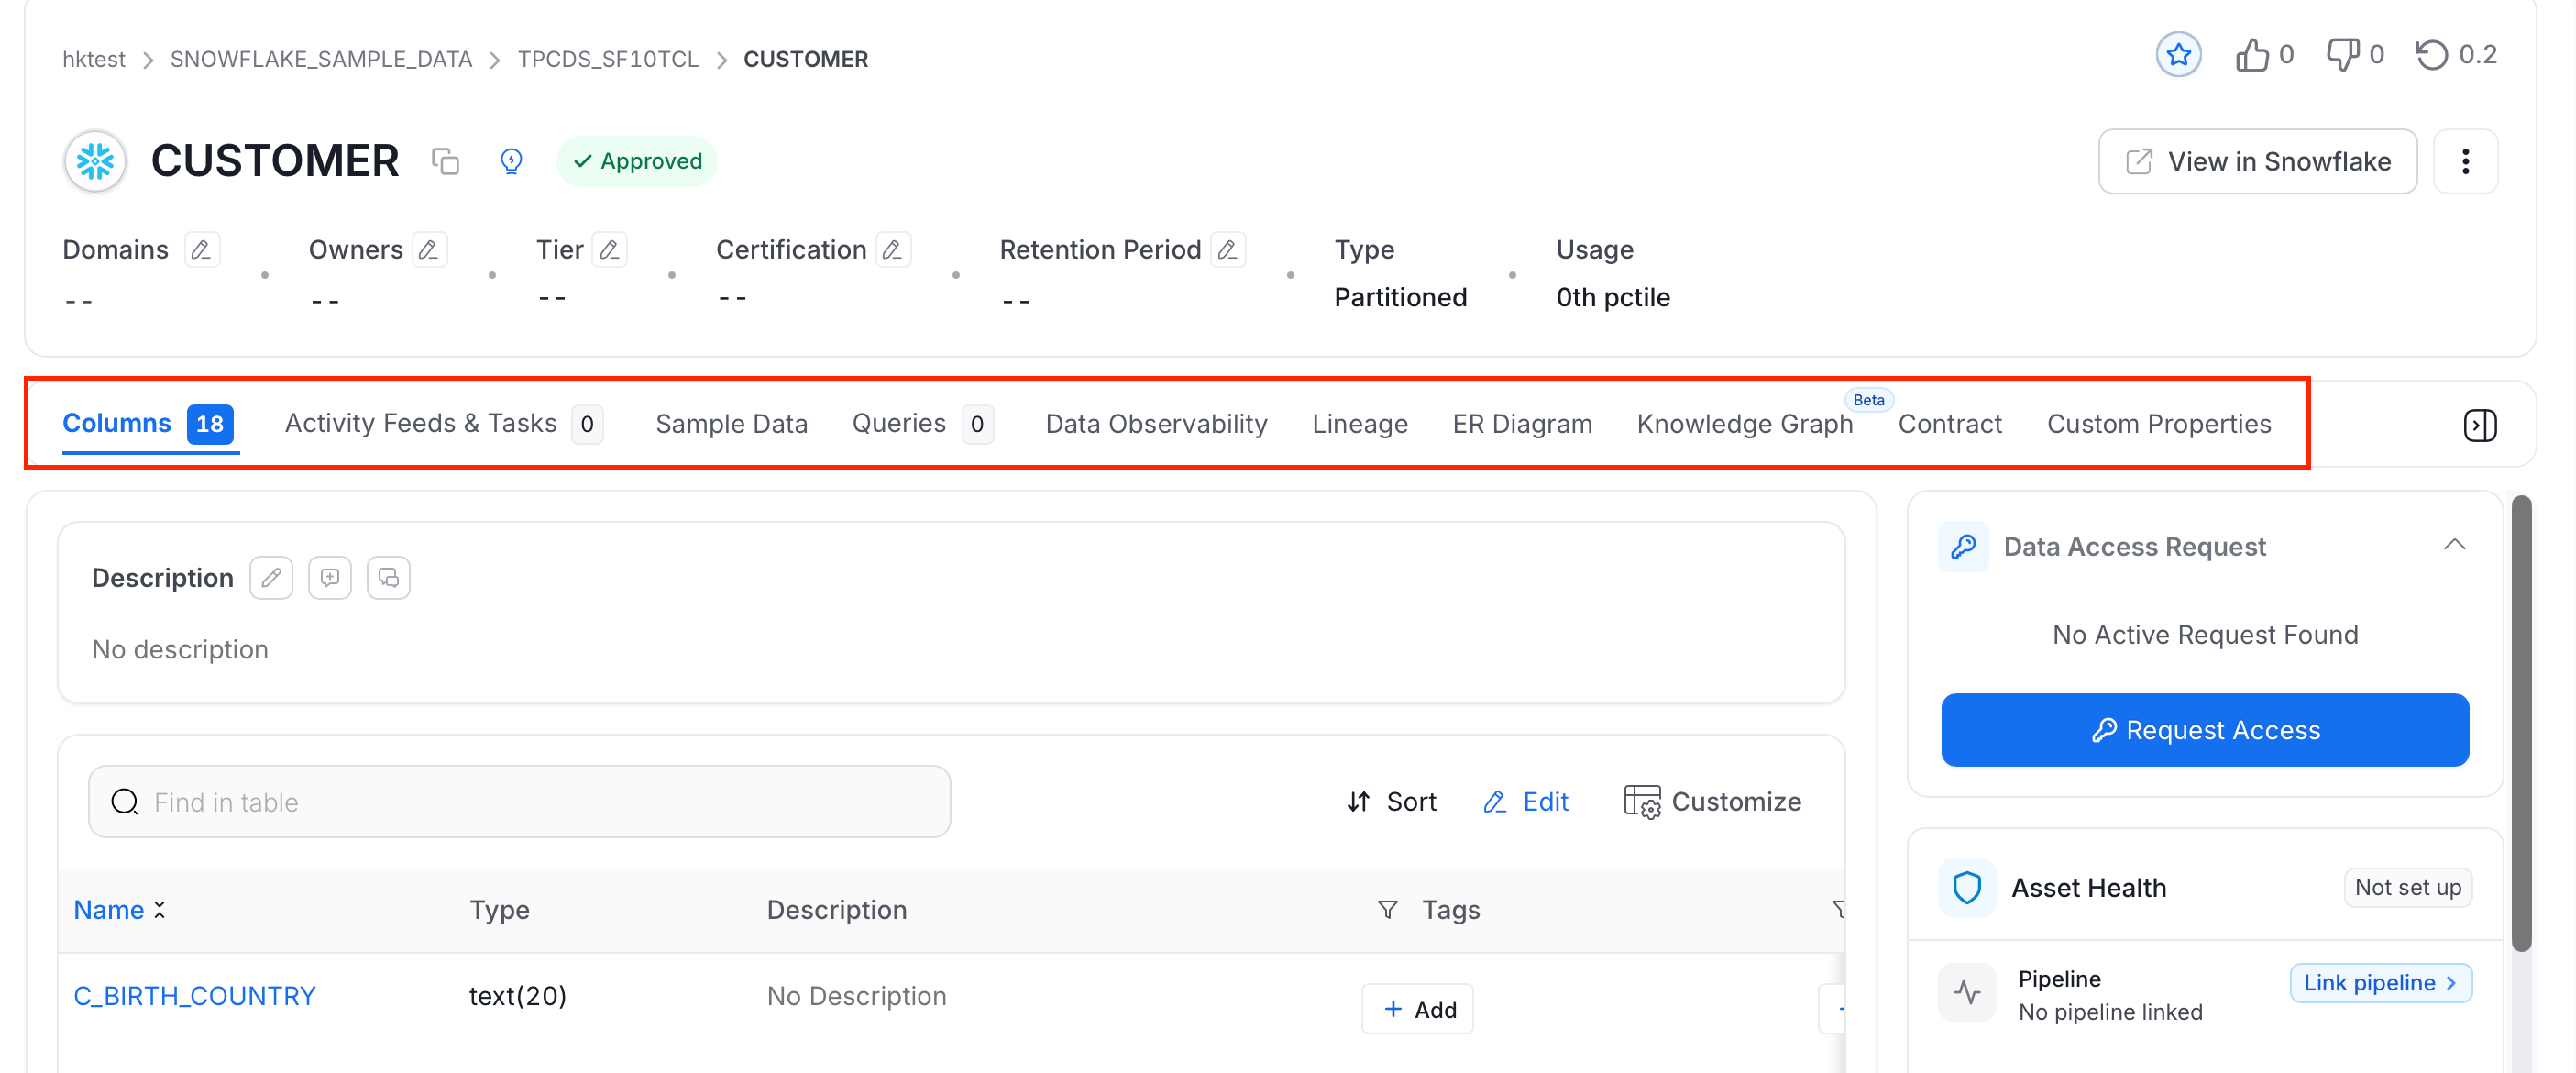
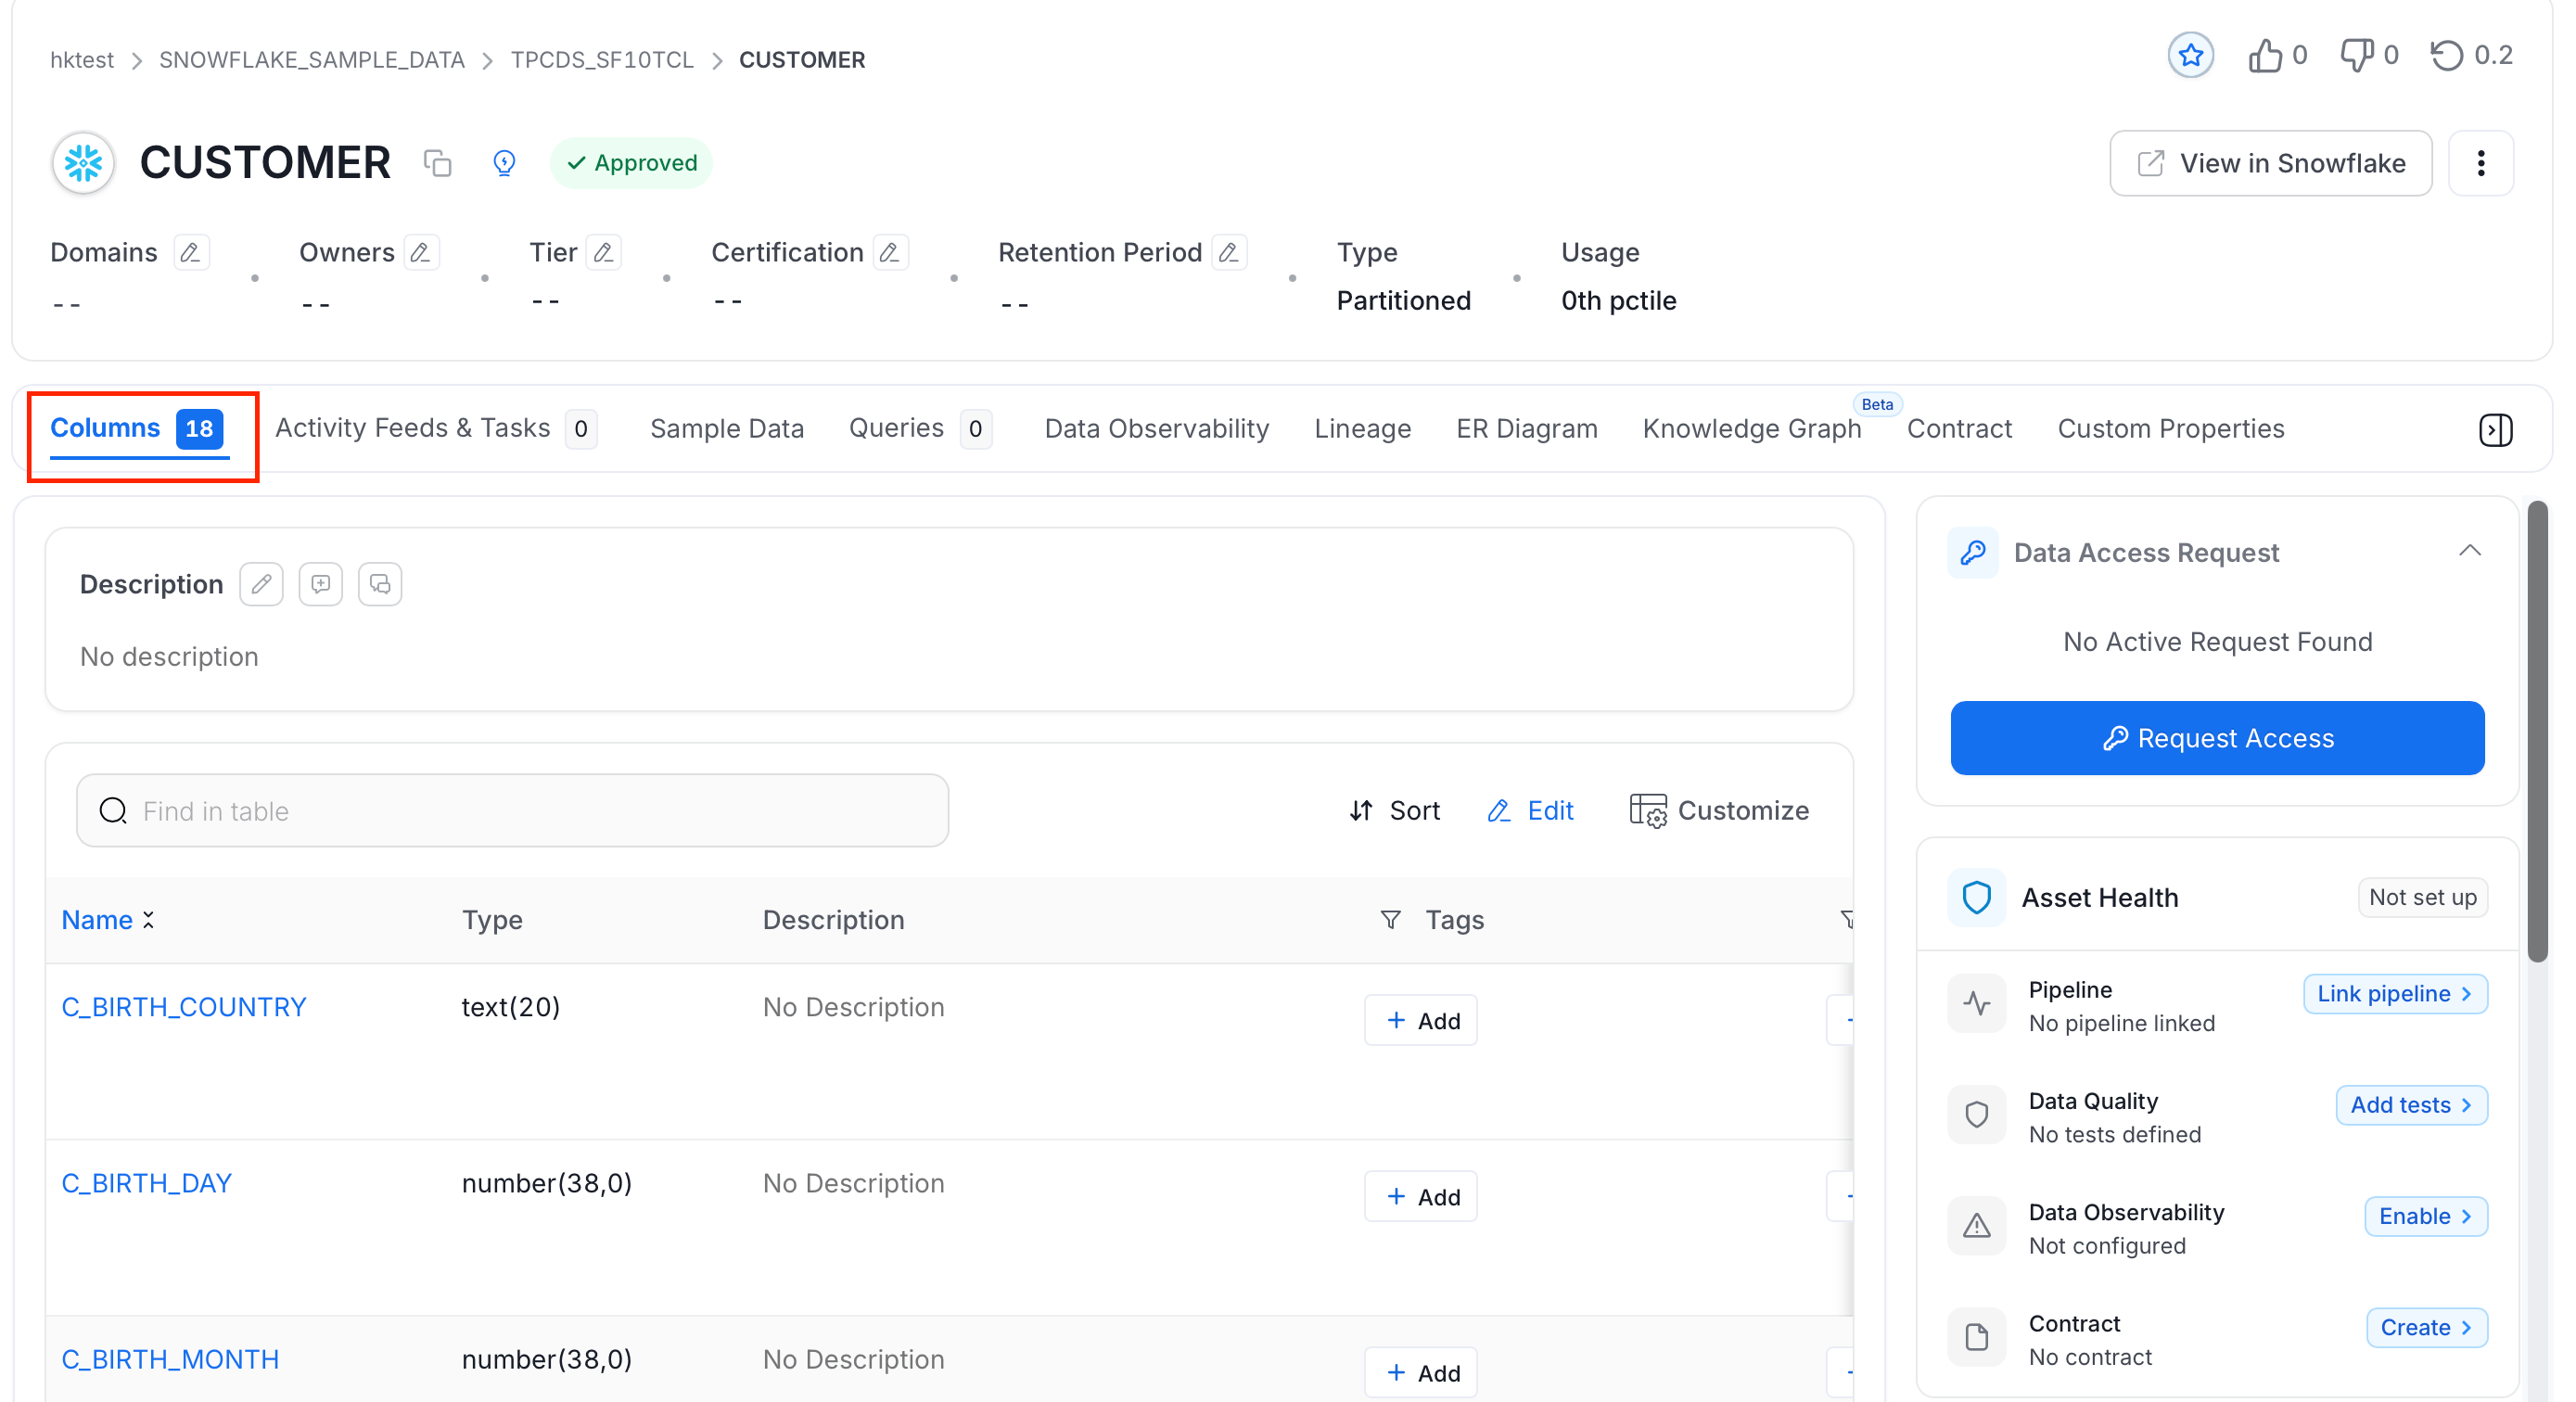
Columns Tab
Available for Tables, Topics, and Containers. The Columns tab displays the full schema of the asset:- Column names, data types, and descriptions
- Tags and glossary terms associated with each column
- Frequently joined tables and their relationship context
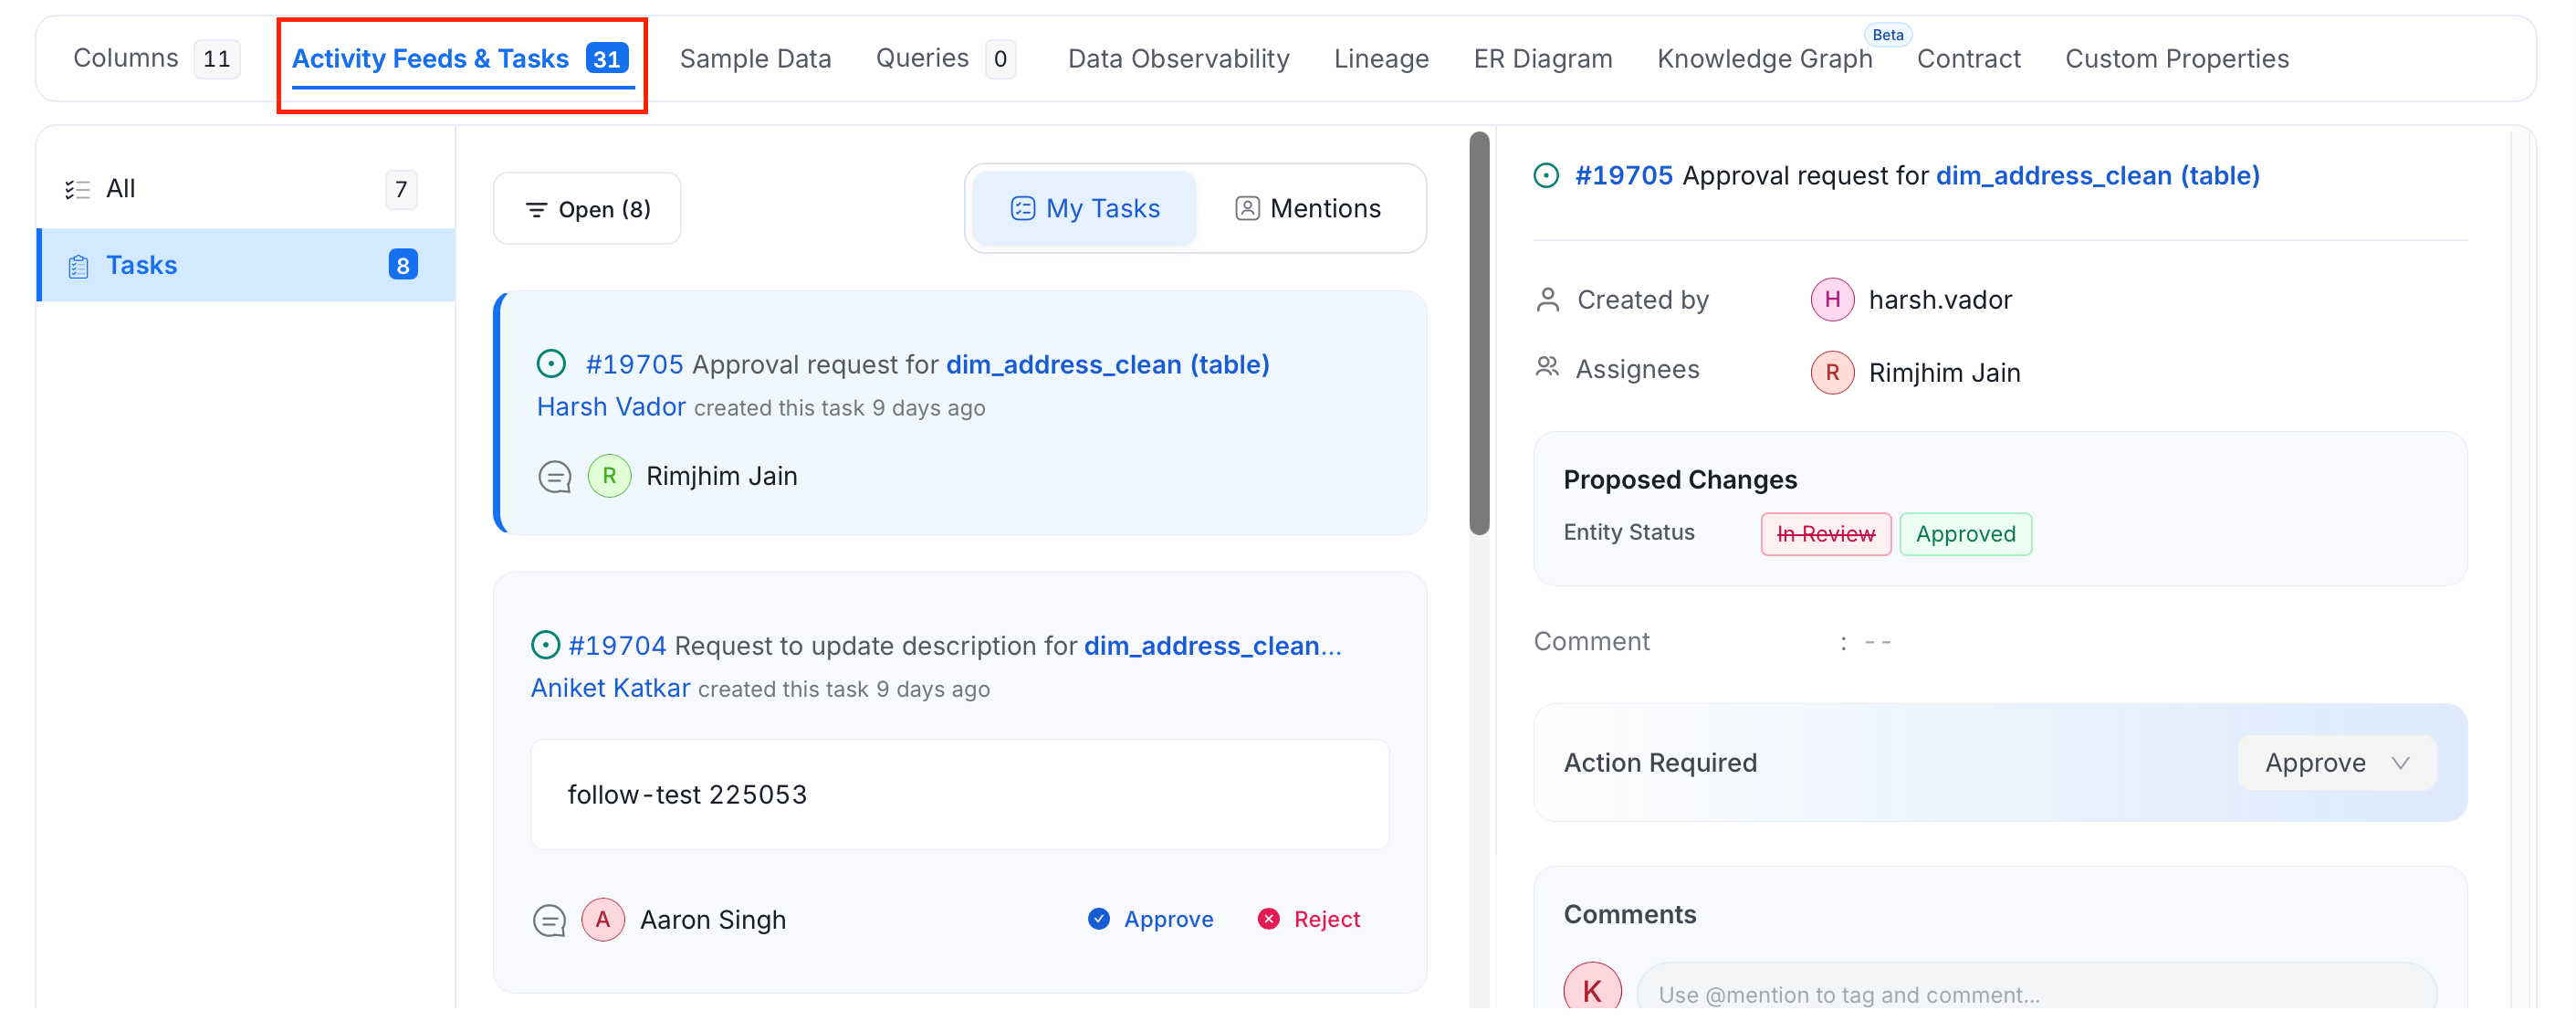
Activity Feeds & Tasks Tab
Available for all asset types. This tab centralizes all collaboration and workflow activity for a data asset:- All — every activity on assets you own, follow, or are mentioned in
- @Mentions — feeds where you’re directly mentioned
- Tasks — open tasks created by you or assigned to you, including approval requests and update requests
Sample Data Tab
Available for Tables and Topics. If sample data ingestion is enabled for the connector, this tab displays a preview of actual data rows — making it easy to understand what the asset contains without writing a query.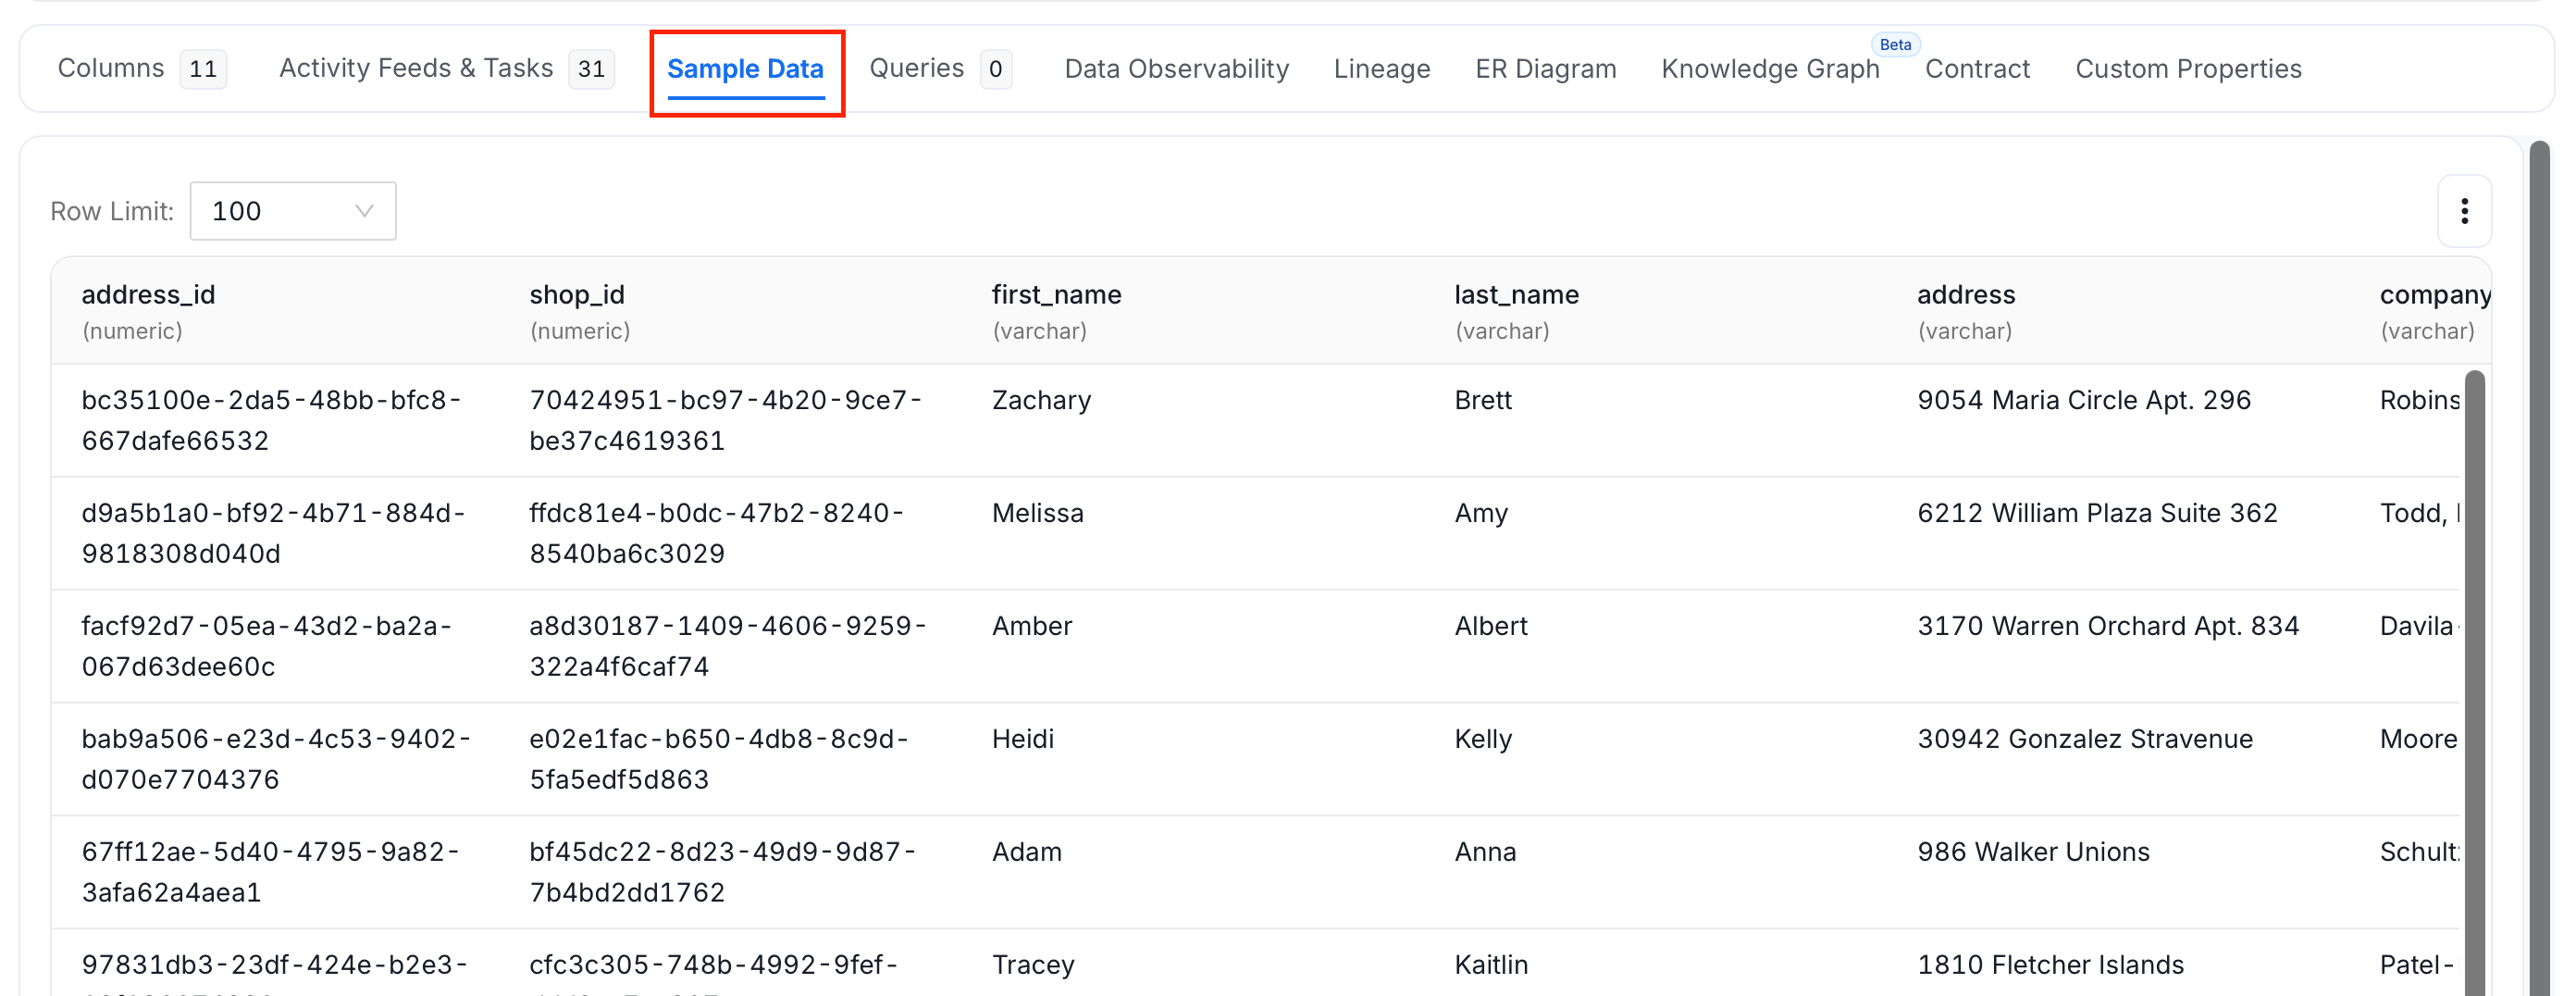
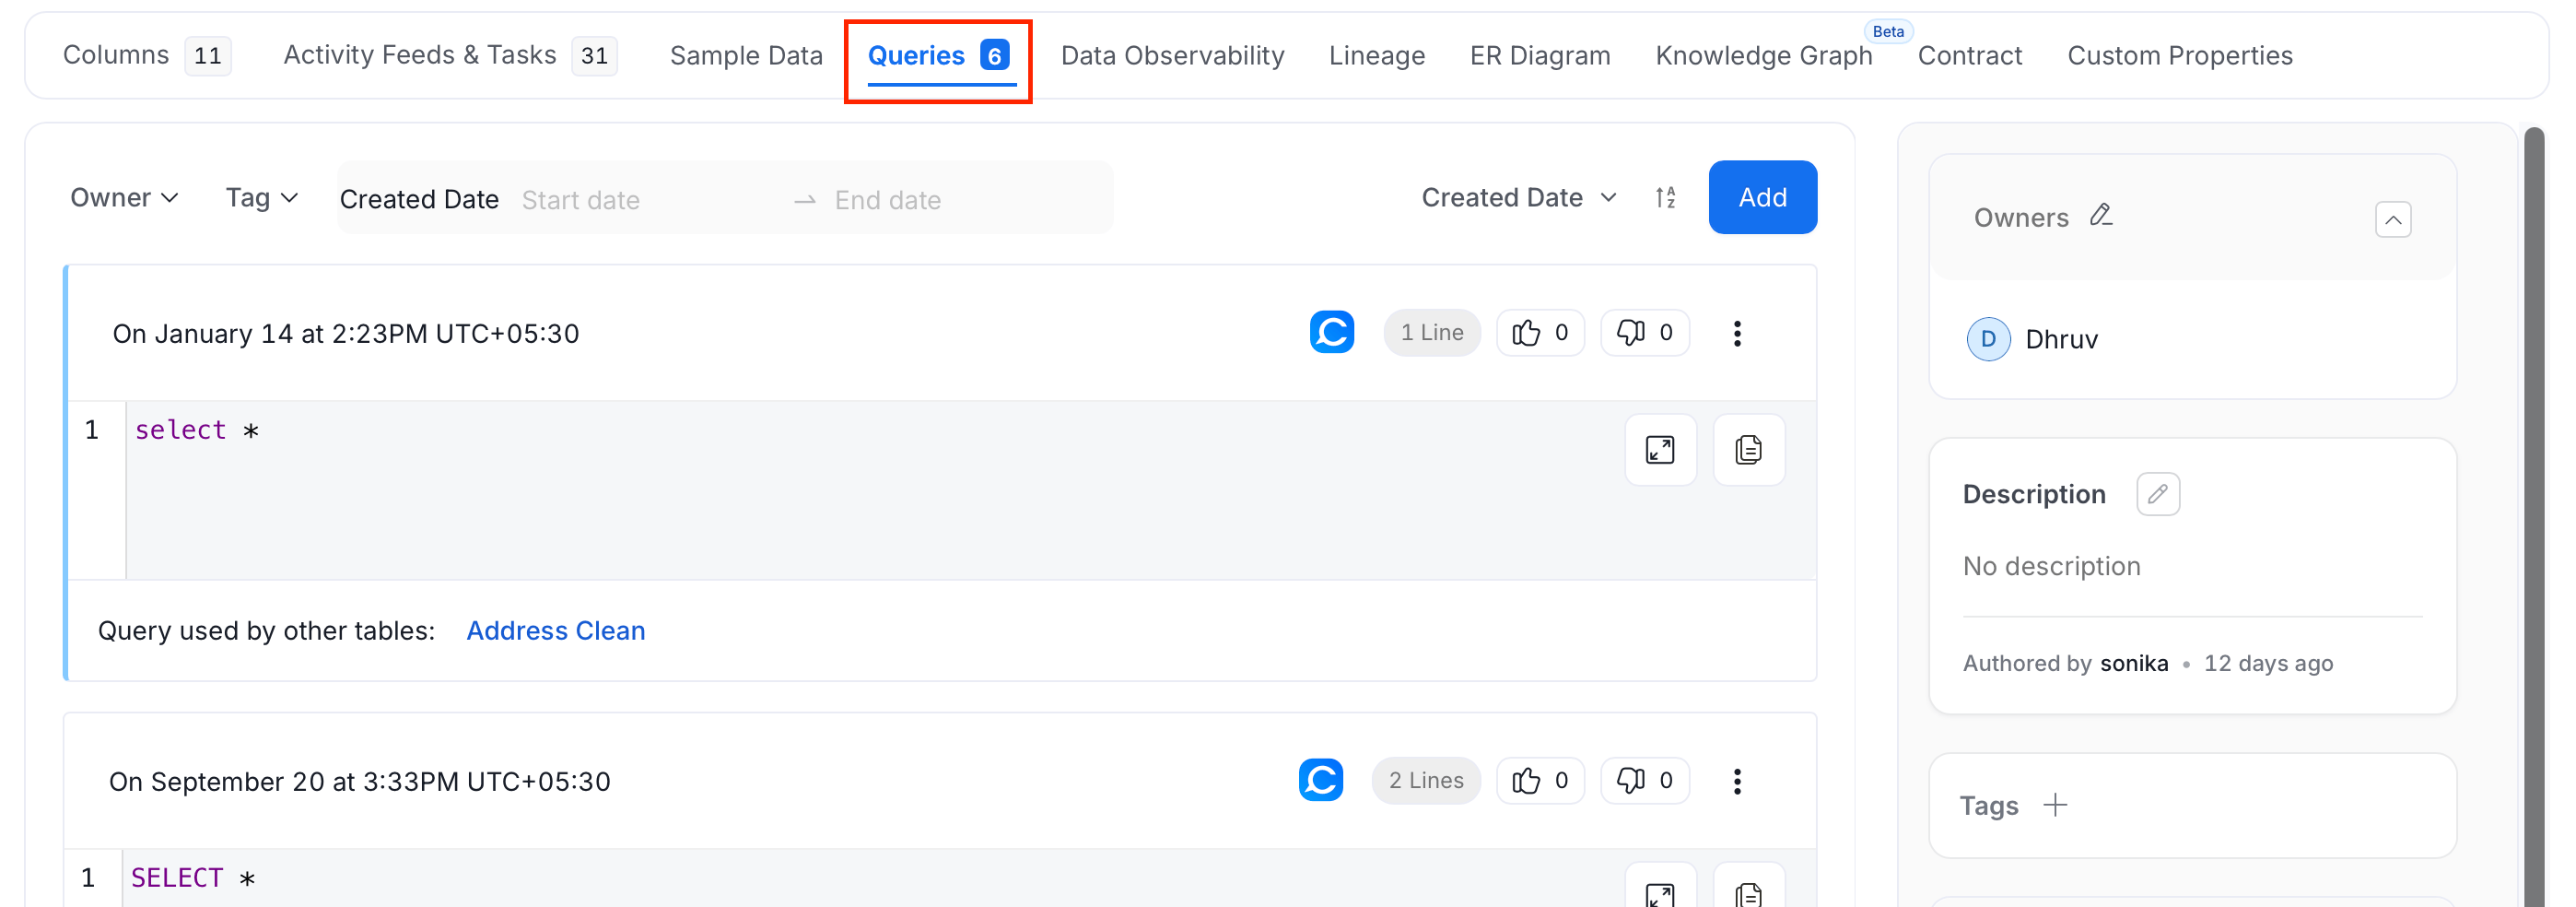
Queries Tab
Available for Tables only. This tab shows all SQL queries run against the table:- Query text with syntax highlighting
- When the query was run and how long it took
- Whether the query is used by other tables
- Ability to add new queries manually
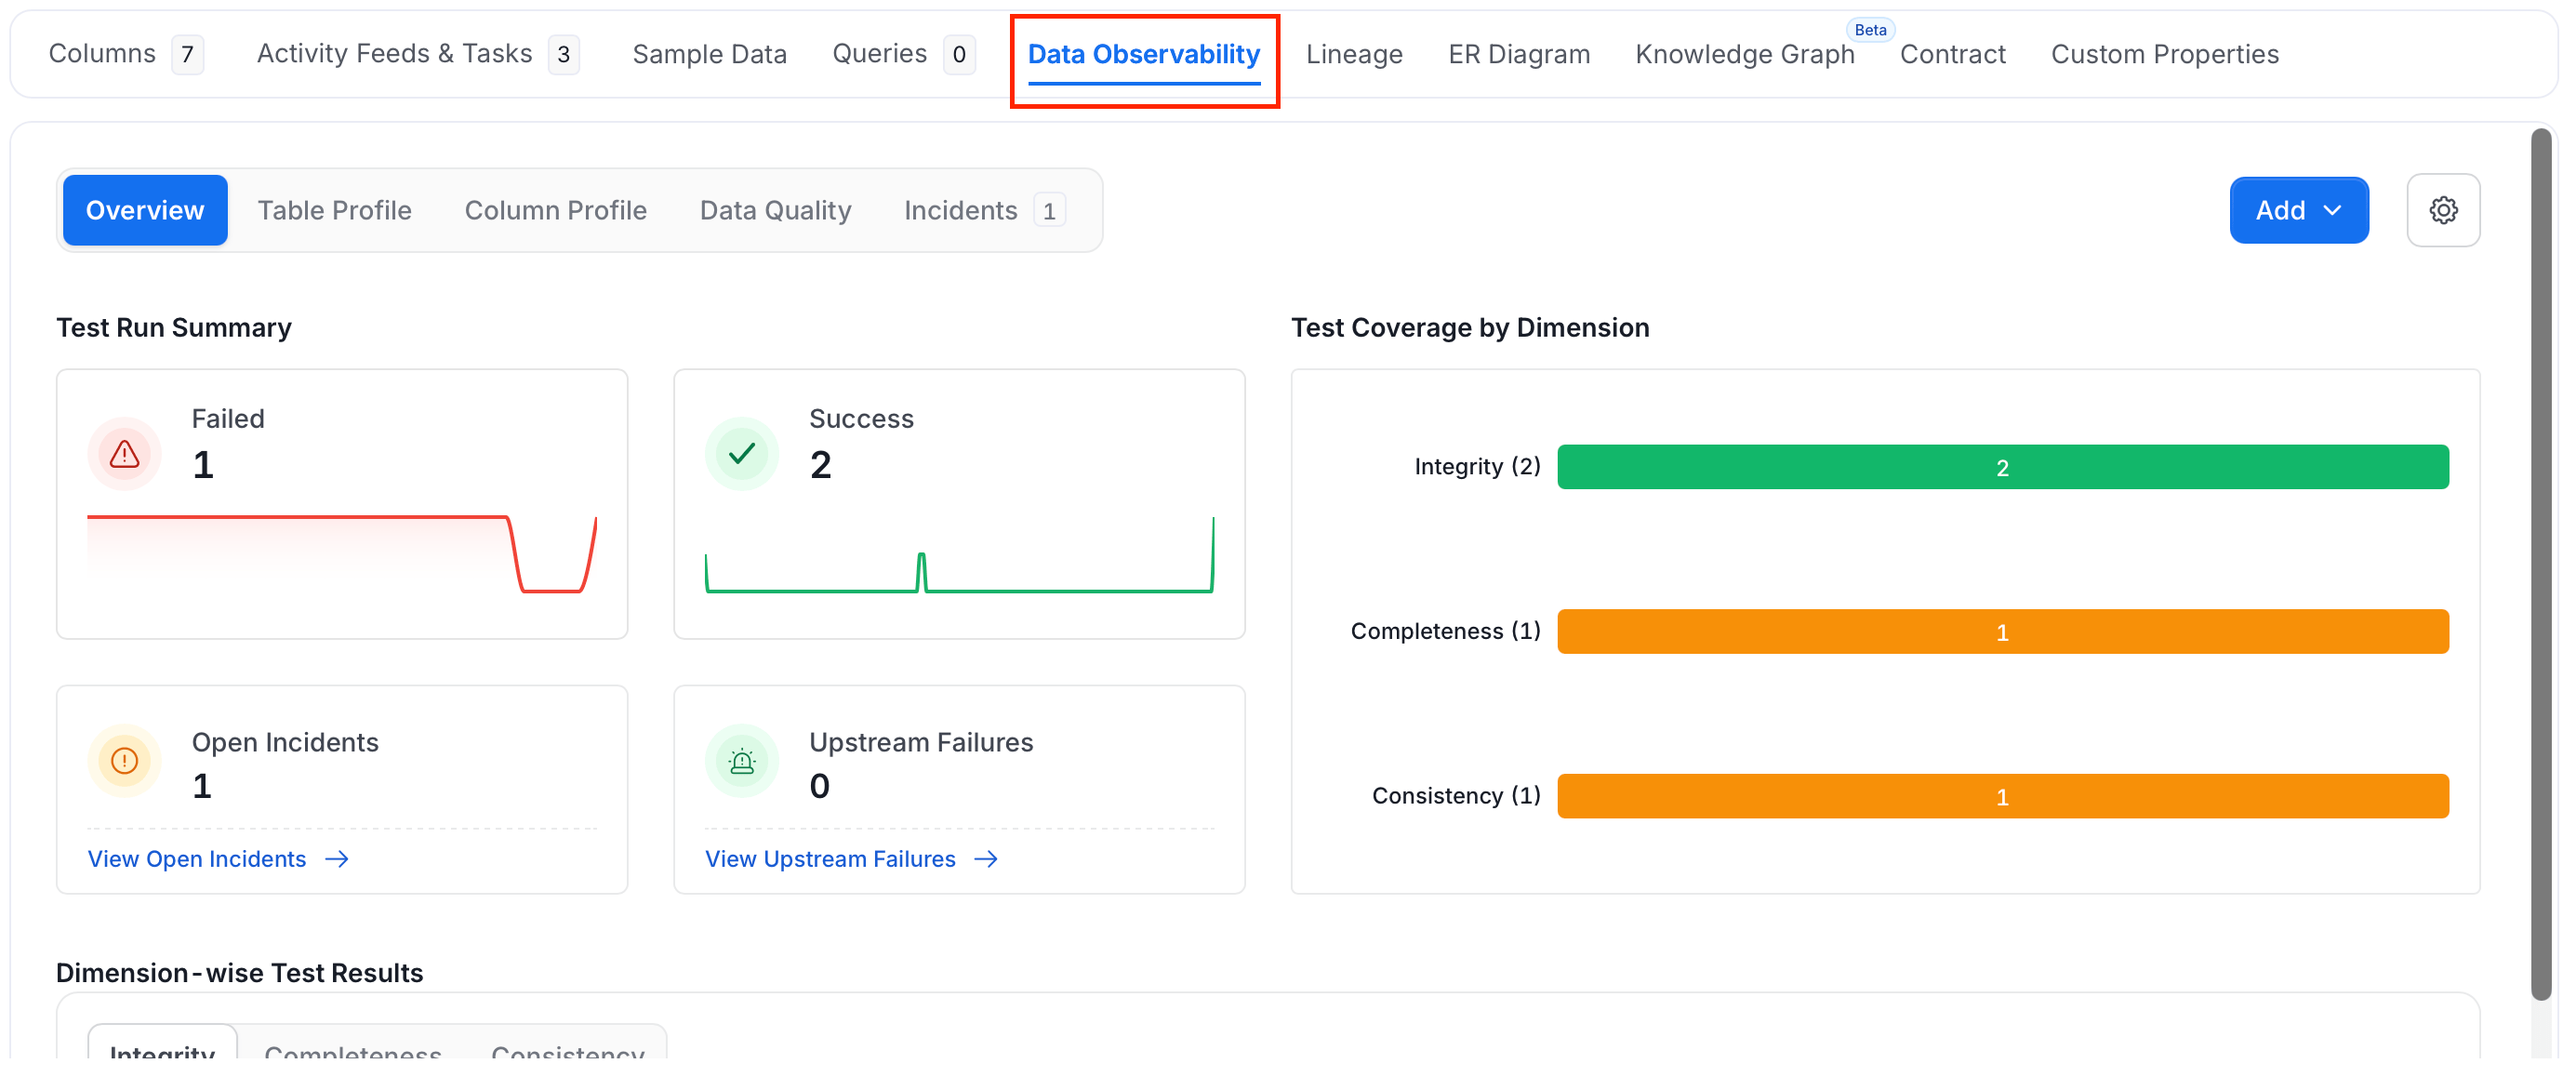
Data Observability Tab
Available for Tables only. This tab consolidates profiling, data quality, and observability into a single view with the following sub-tabs:- Overview — test run summary (failed, success, open incidents, upstream failures) and test coverage by dimension
- Table Profile — row count, volume trends, and table update frequency
- Column Profile — value count, null %, distinct %, and unique % per column
- Data Quality — test results at table and column level
- Incidents — active anomalies and data quality alerts
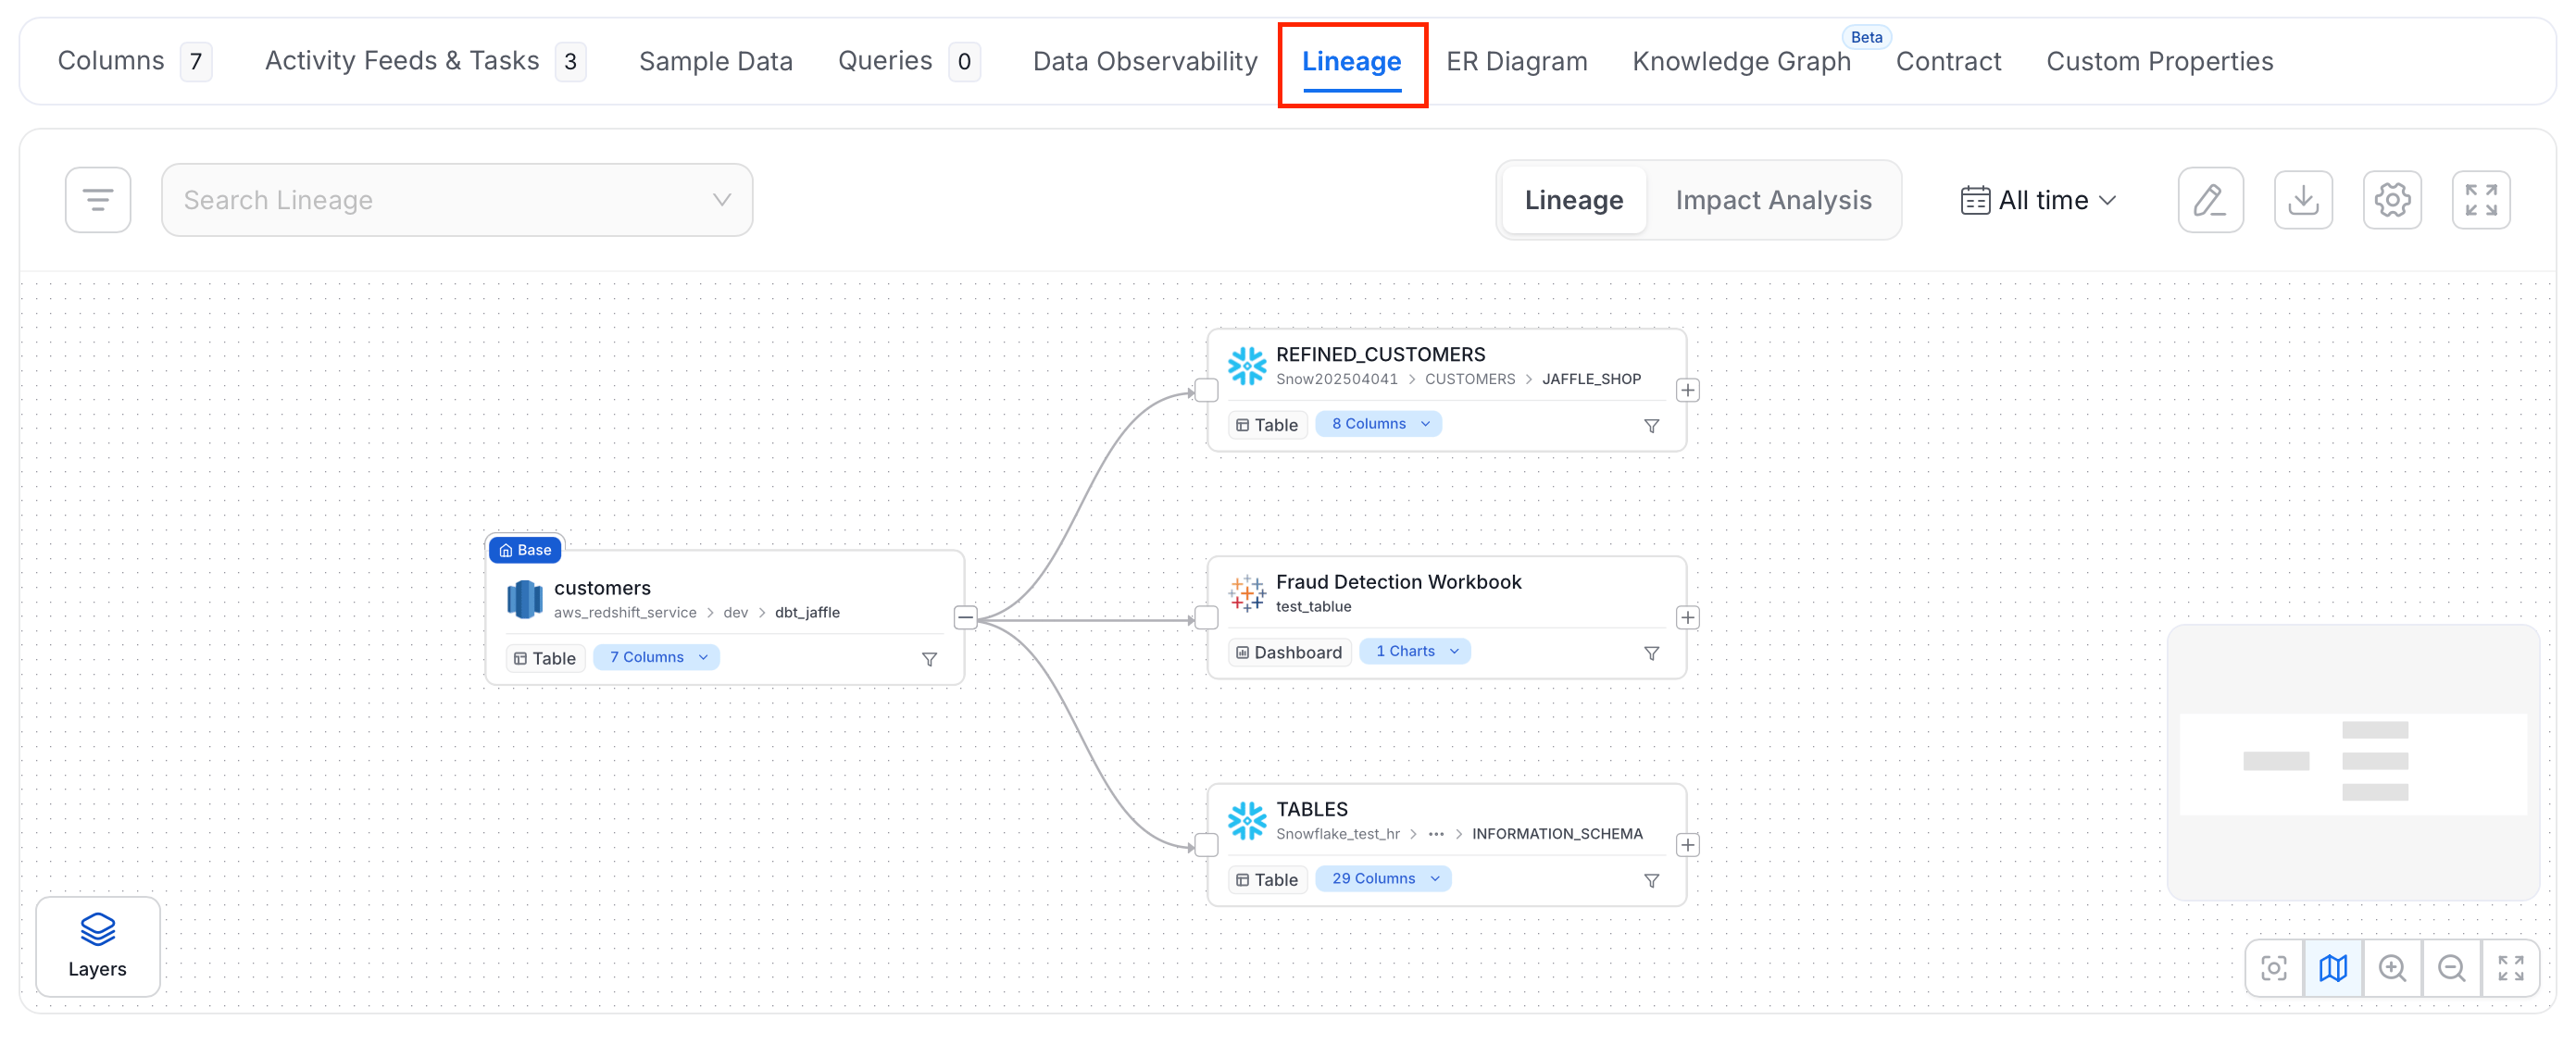
Lineage Tab
Available for all asset types. The Lineage tab shows the full data journey for an asset:- End-to-end lineage at both table and column level
- Upstream and downstream dependencies for each node
- Clickable nodes that show asset previews with tags, schema, and quality metrics
ER Diagram Tab
Available for Tables only. The ER Diagram tab shows the entity-relationship view of the table — how it connects to other tables through foreign keys and join patterns. This is useful for quickly understanding data model structure and table relationships.
Knowledge Graph Tab
Available for Tables (Beta). The Knowledge Graph tab visualizes semantic relationships between the selected asset and other assets, glossary terms, and business concepts — surfacing hidden connections across your data platform.
Contract Tab
Available for all asset types. Data Contracts define the expected quality, schema, and ownership agreement for a data asset. From this tab you can:- View any active contract and its compliance status
- Create a new contract if none exists
- Track who owns the contract and when it was last updated
Custom Properties Tab
Available for all asset types. Organizations can define custom attributes to extend standard metadata. This tab lets users view and edit those values directly — for example, business owner name, data classification, compliance tier, or SLA requirements.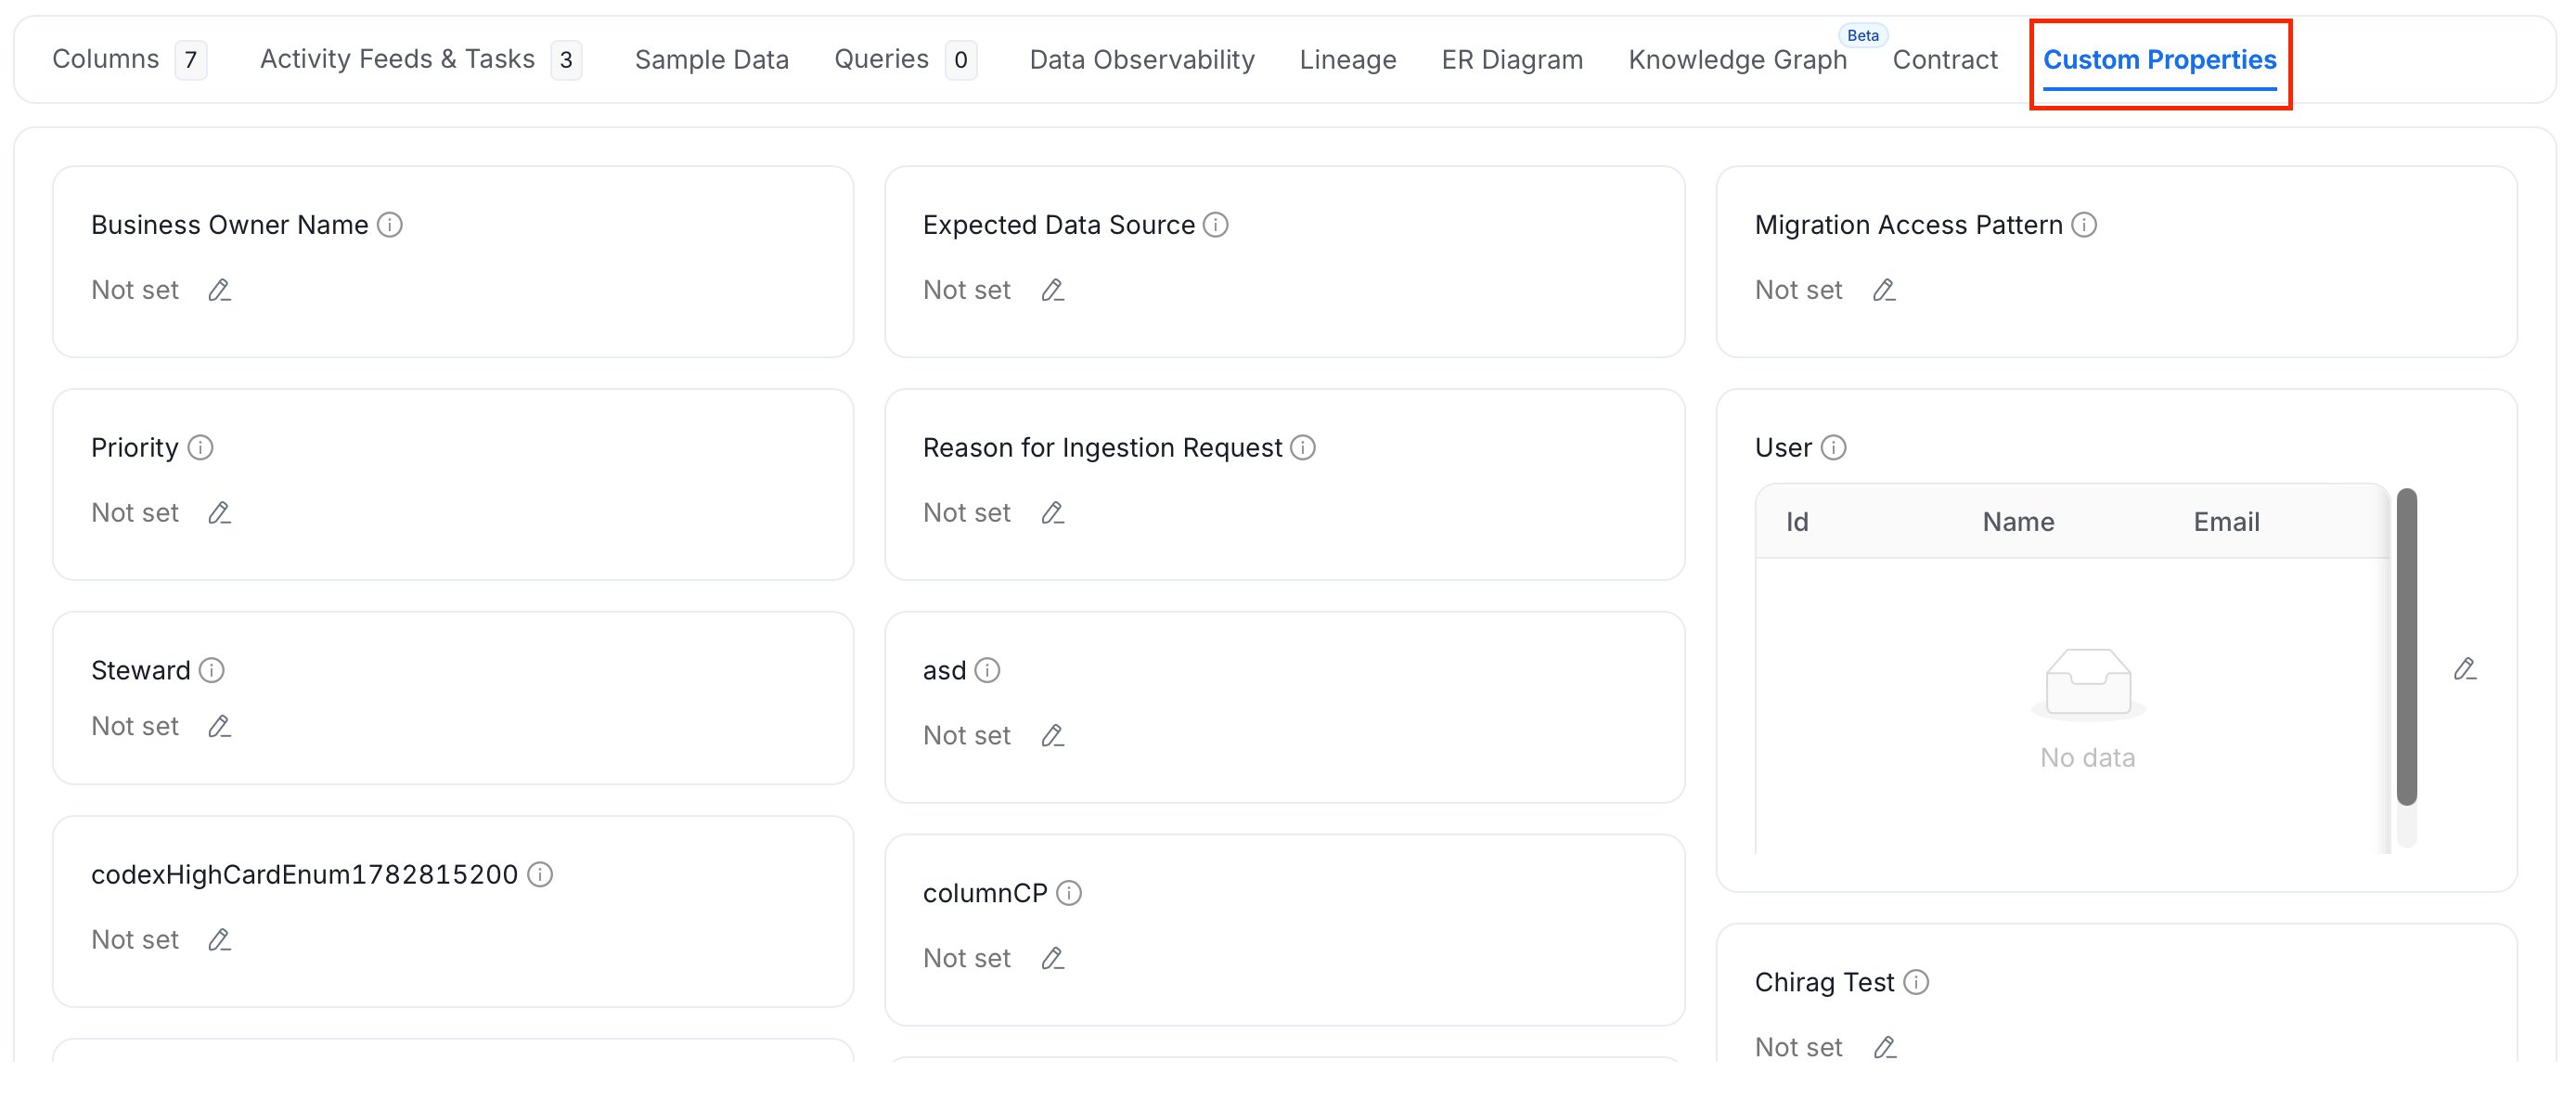
Config Tab
Available for Topics only. The Config tab shows the technical configuration of a messaging topic, such as partition count, replication factor, cleanup policy, and retention settings.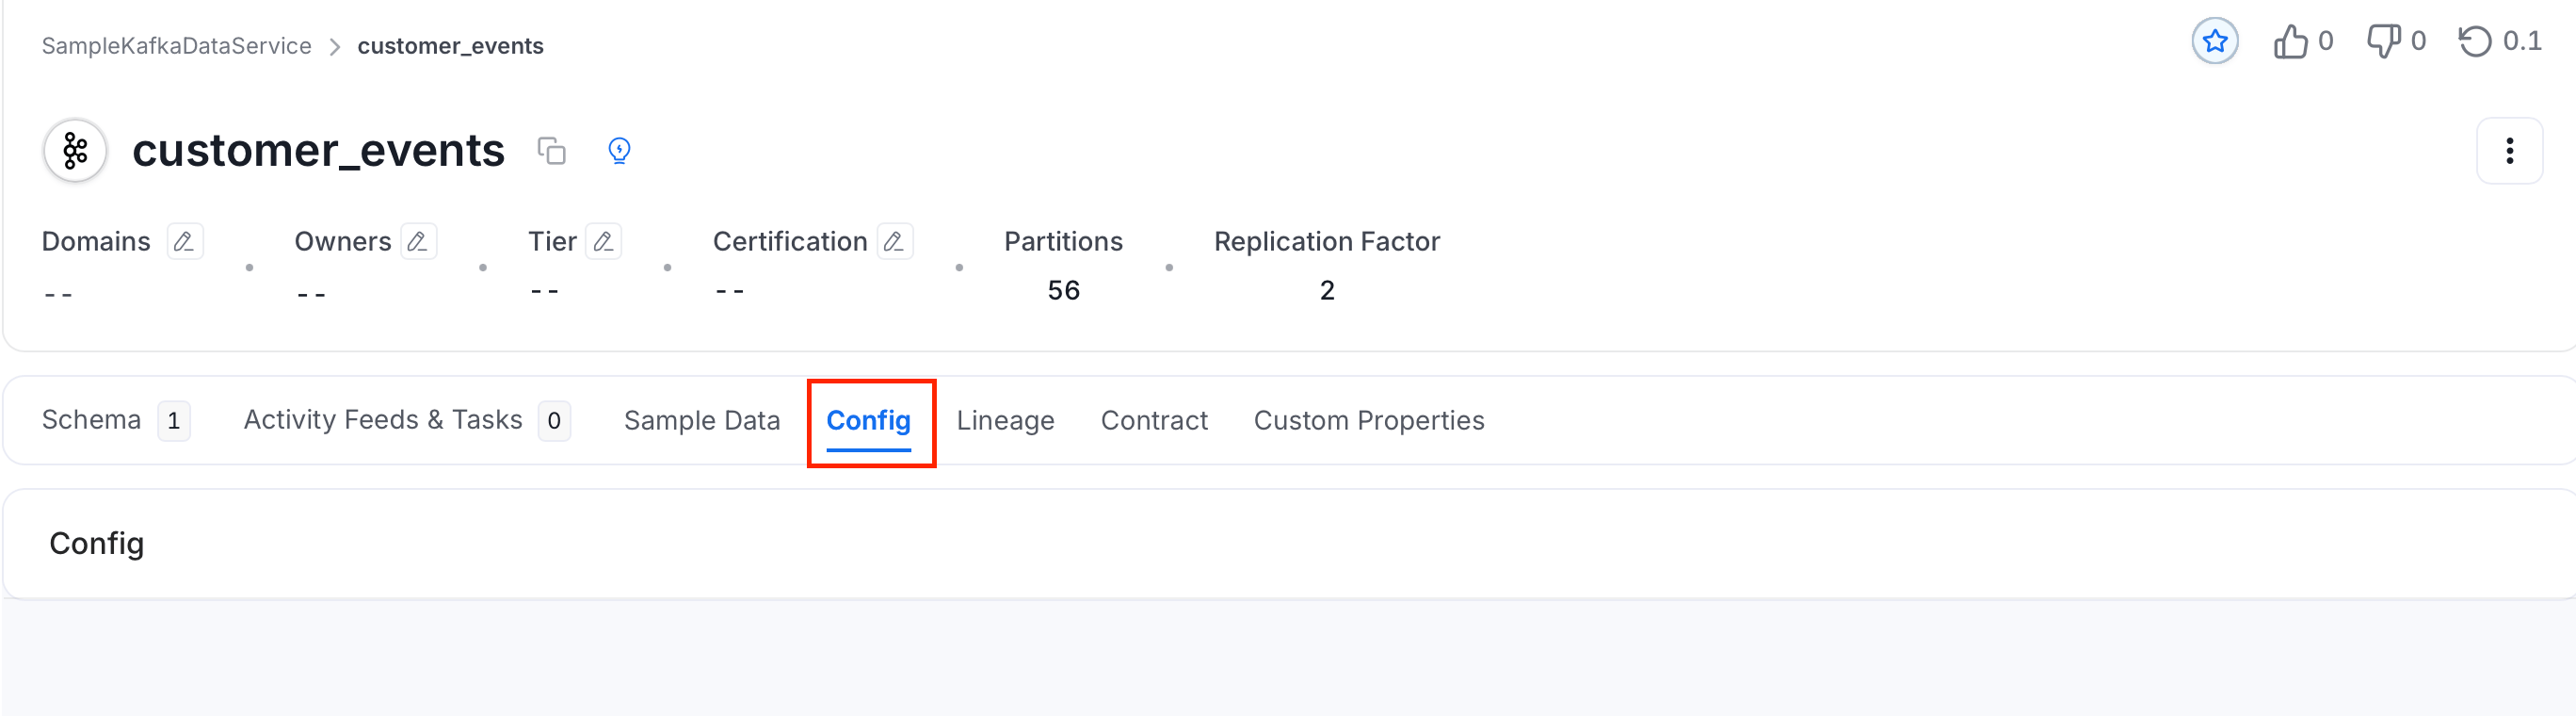
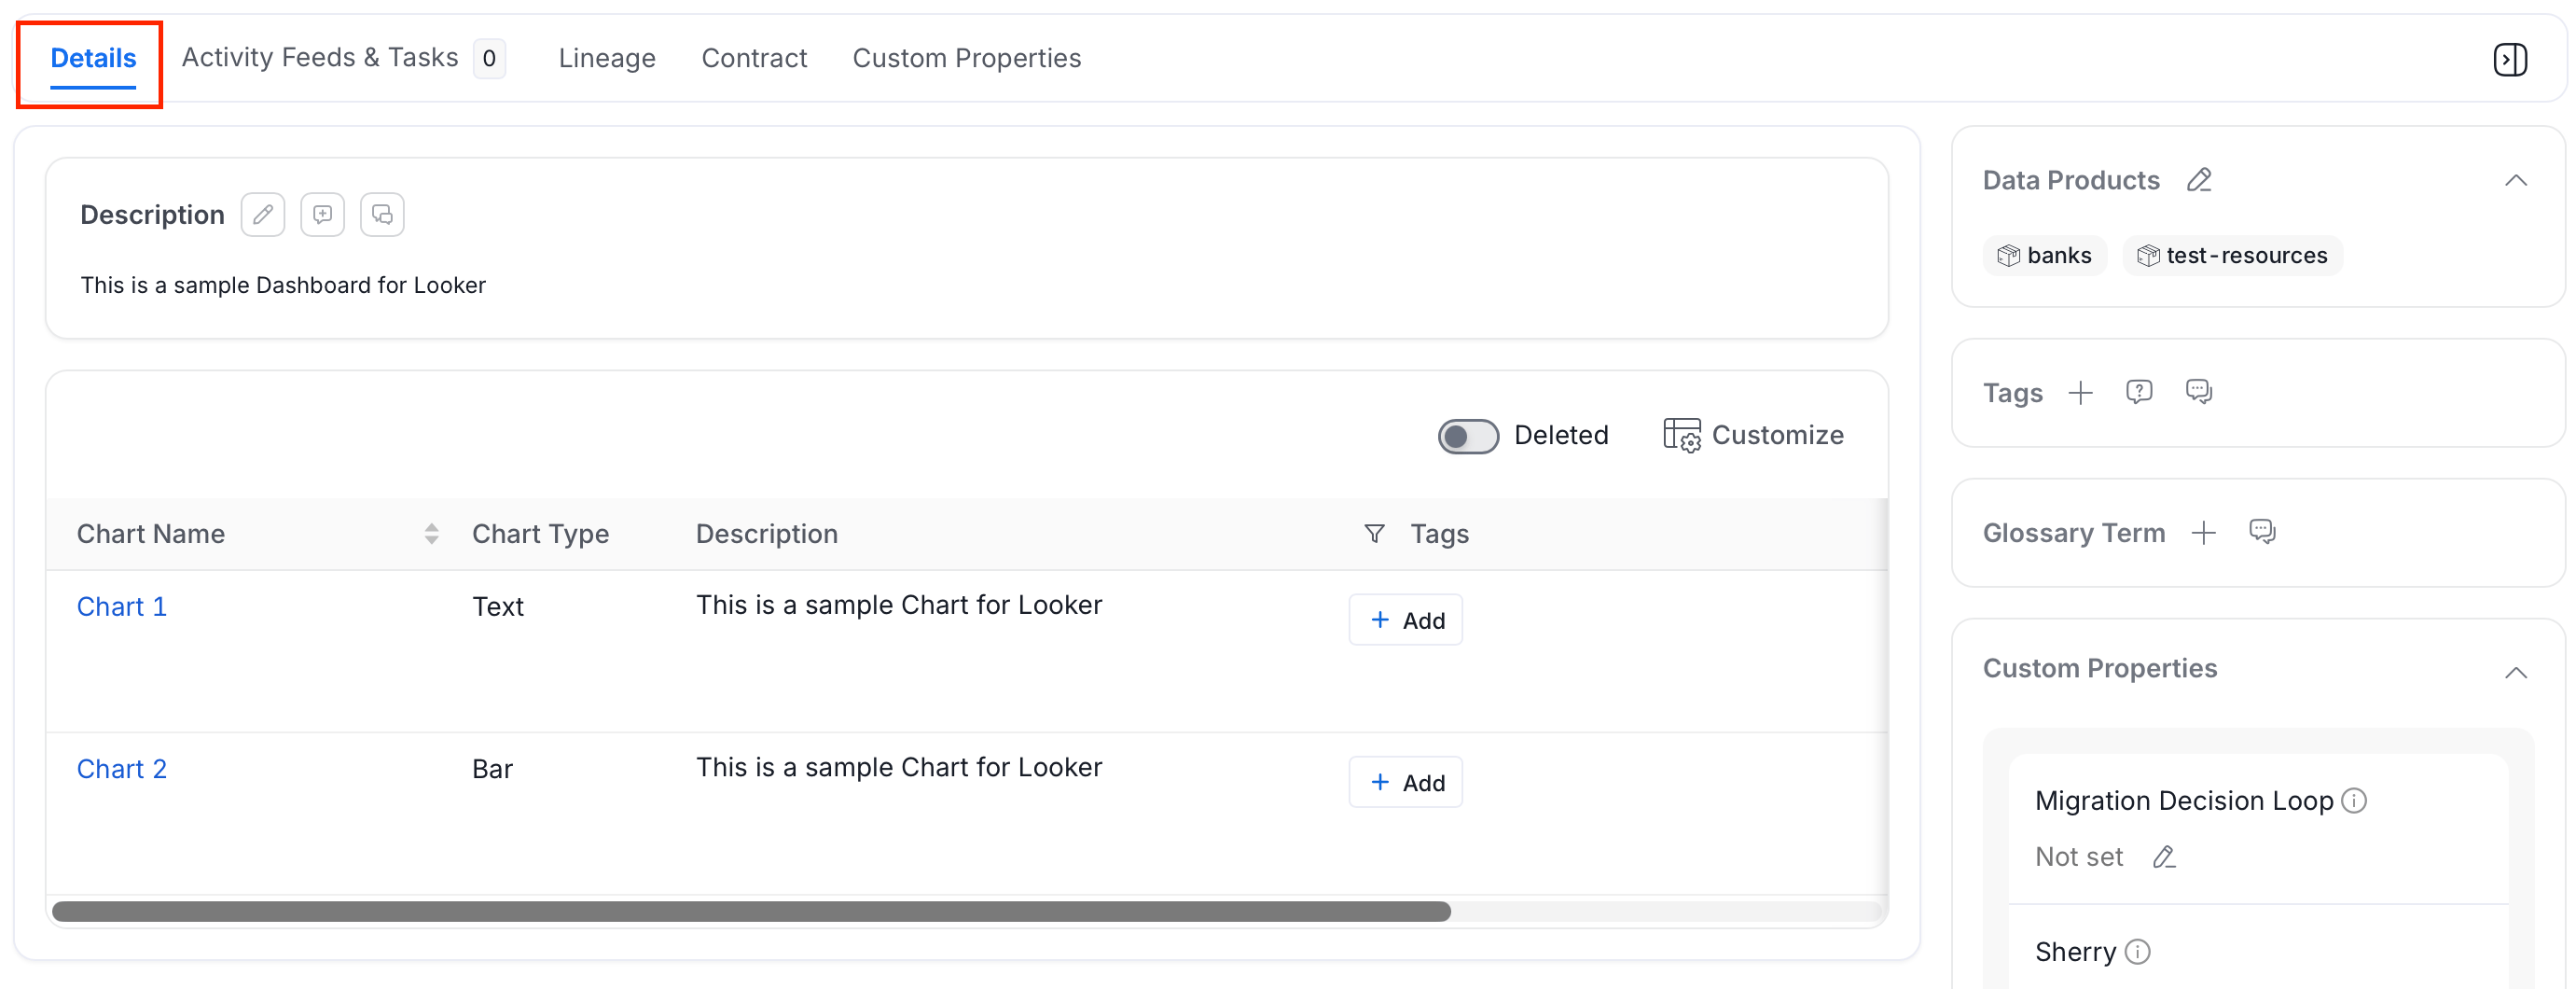
Details Tab
Available for Dashboards and ML Models. For Dashboards — displays the list of charts with:- Chart name and type
- Description and associated tags
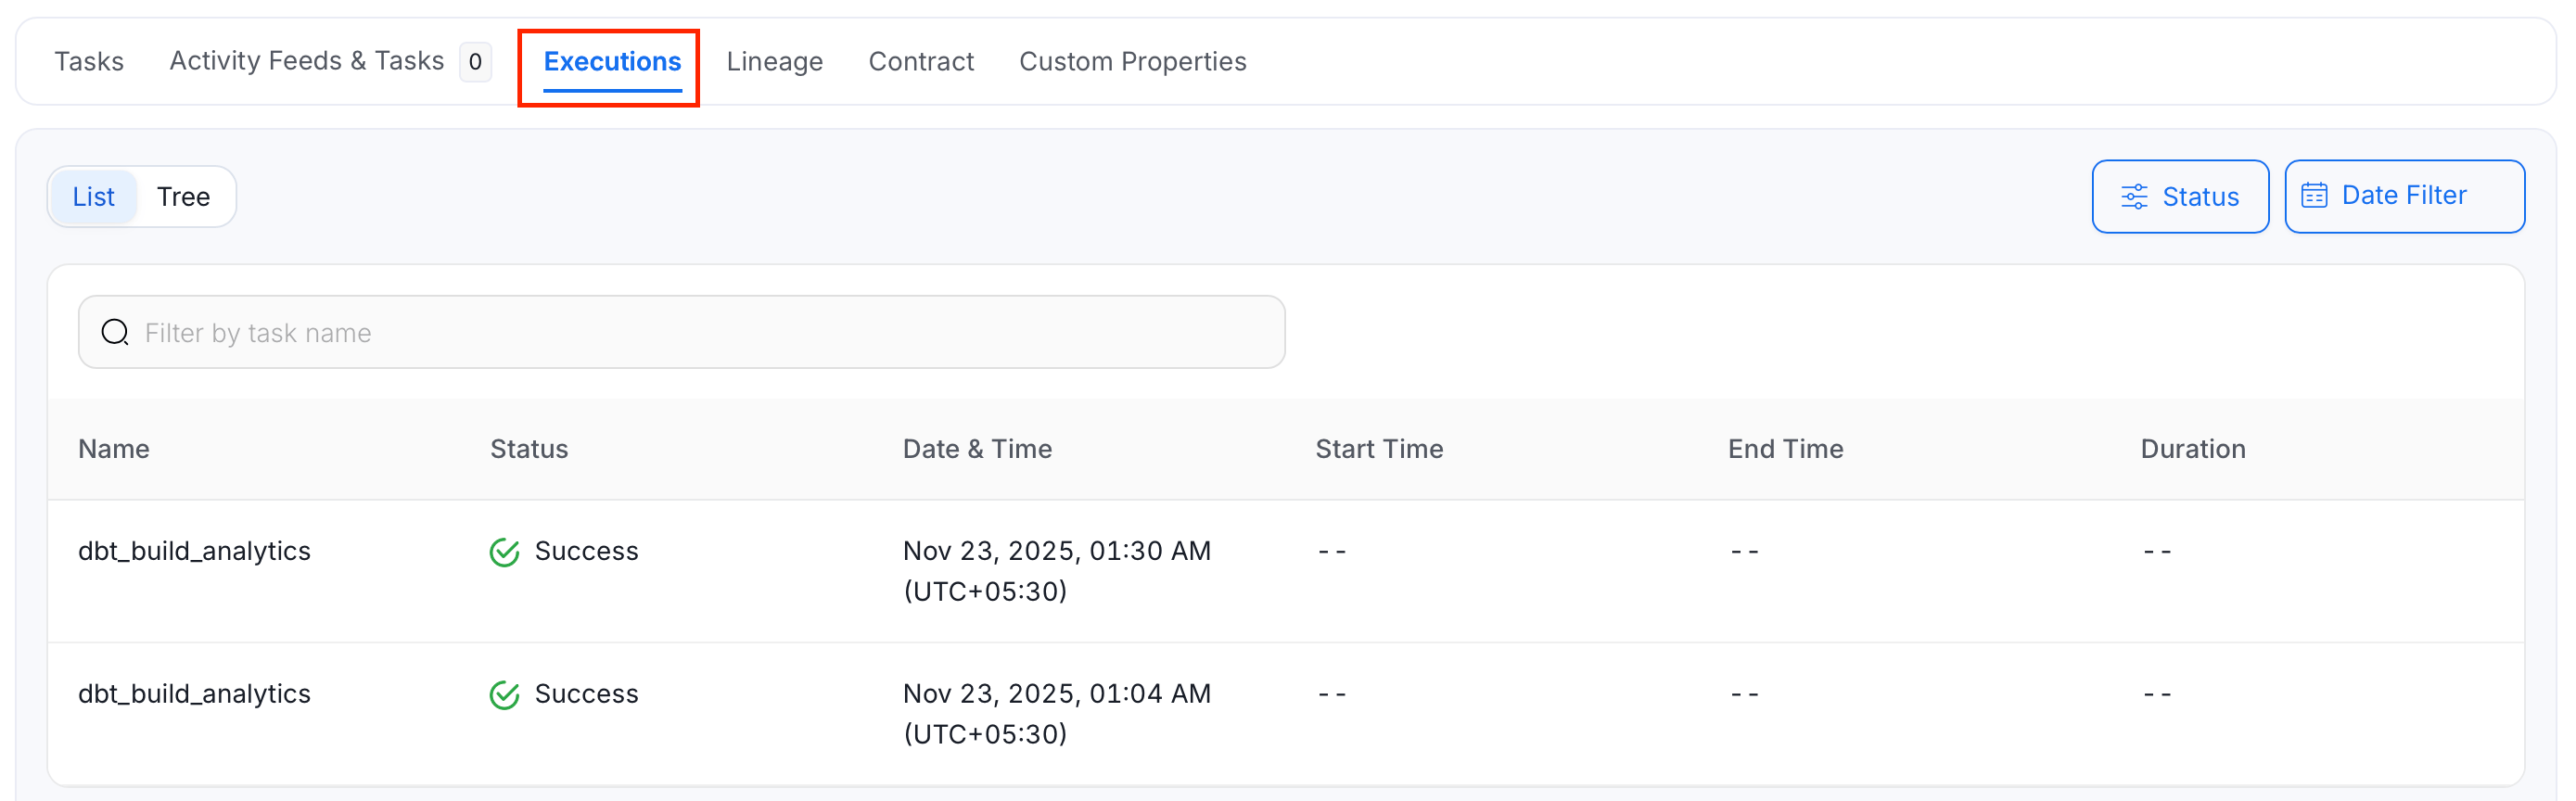
Executions Tab
Available for Pipelines only. The Executions tab shows a history of all pipeline runs:- Date, time, and duration of each run
- Status: Success, Failure, Pending, or Aborted
- View runs as a chronological list or as a tree
- Filter by status and date range
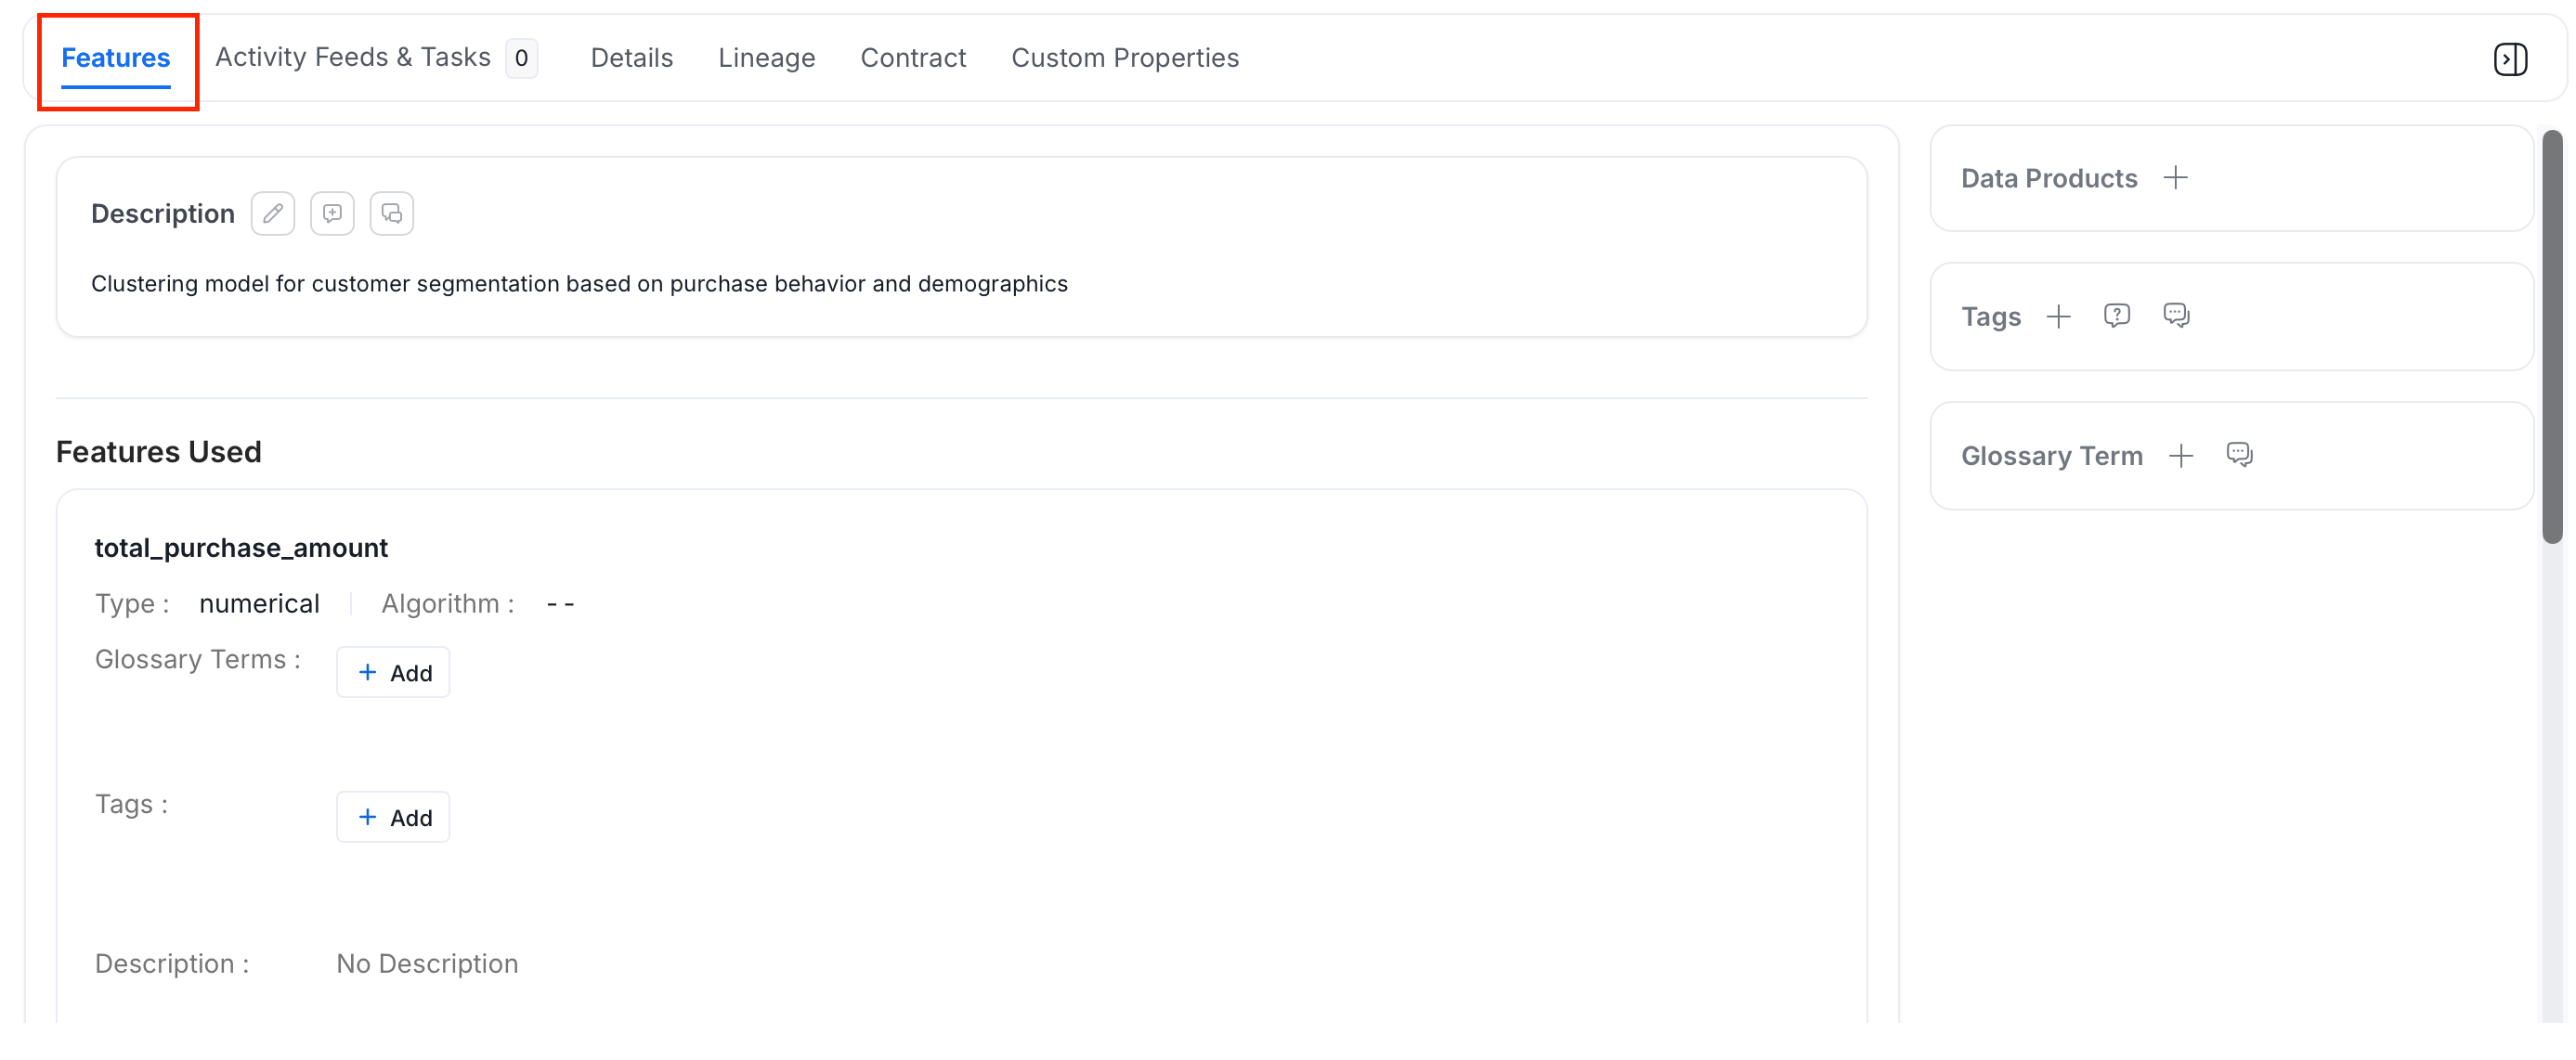
Features Tab
Available for ML Models only. This tab describes the inputs used to train the model:- Model description
- Each feature with its type, algorithm, and description
- Data sources for each feature
- Associated glossary terms and tags
Children Tab
Available for Containers only. Lists all nested assets within the container — for example, files or sub-folders inside a storage bucket.Version History and Other Details
The toolbar in the top-right of any data asset page provides quick access to:- Tasks — circular icon showing the count of open tasks
- Version History — clock icon showing a log of major and minor metadata changes
- Follow — star icon showing follower count; click to follow the asset and receive updates
- Share — copy and share a direct link to this asset
- Announcements — via the ⋮ menu; create or view time-bound announcements for the asset
- Rename — via the ⋮ menu; rename the asset
- Delete — via the ⋮ menu; permanently remove the asset
How to Add Description using Markdown
Describe your data assets using Markdown