
Overview of Data Quality
Collate makes it easy to build trust in your data. Create no-code tests to verify that data is complete, fresh, and accurate — directly from the UI, no engineering required. Tests run at the table and column level across all supported database connectors.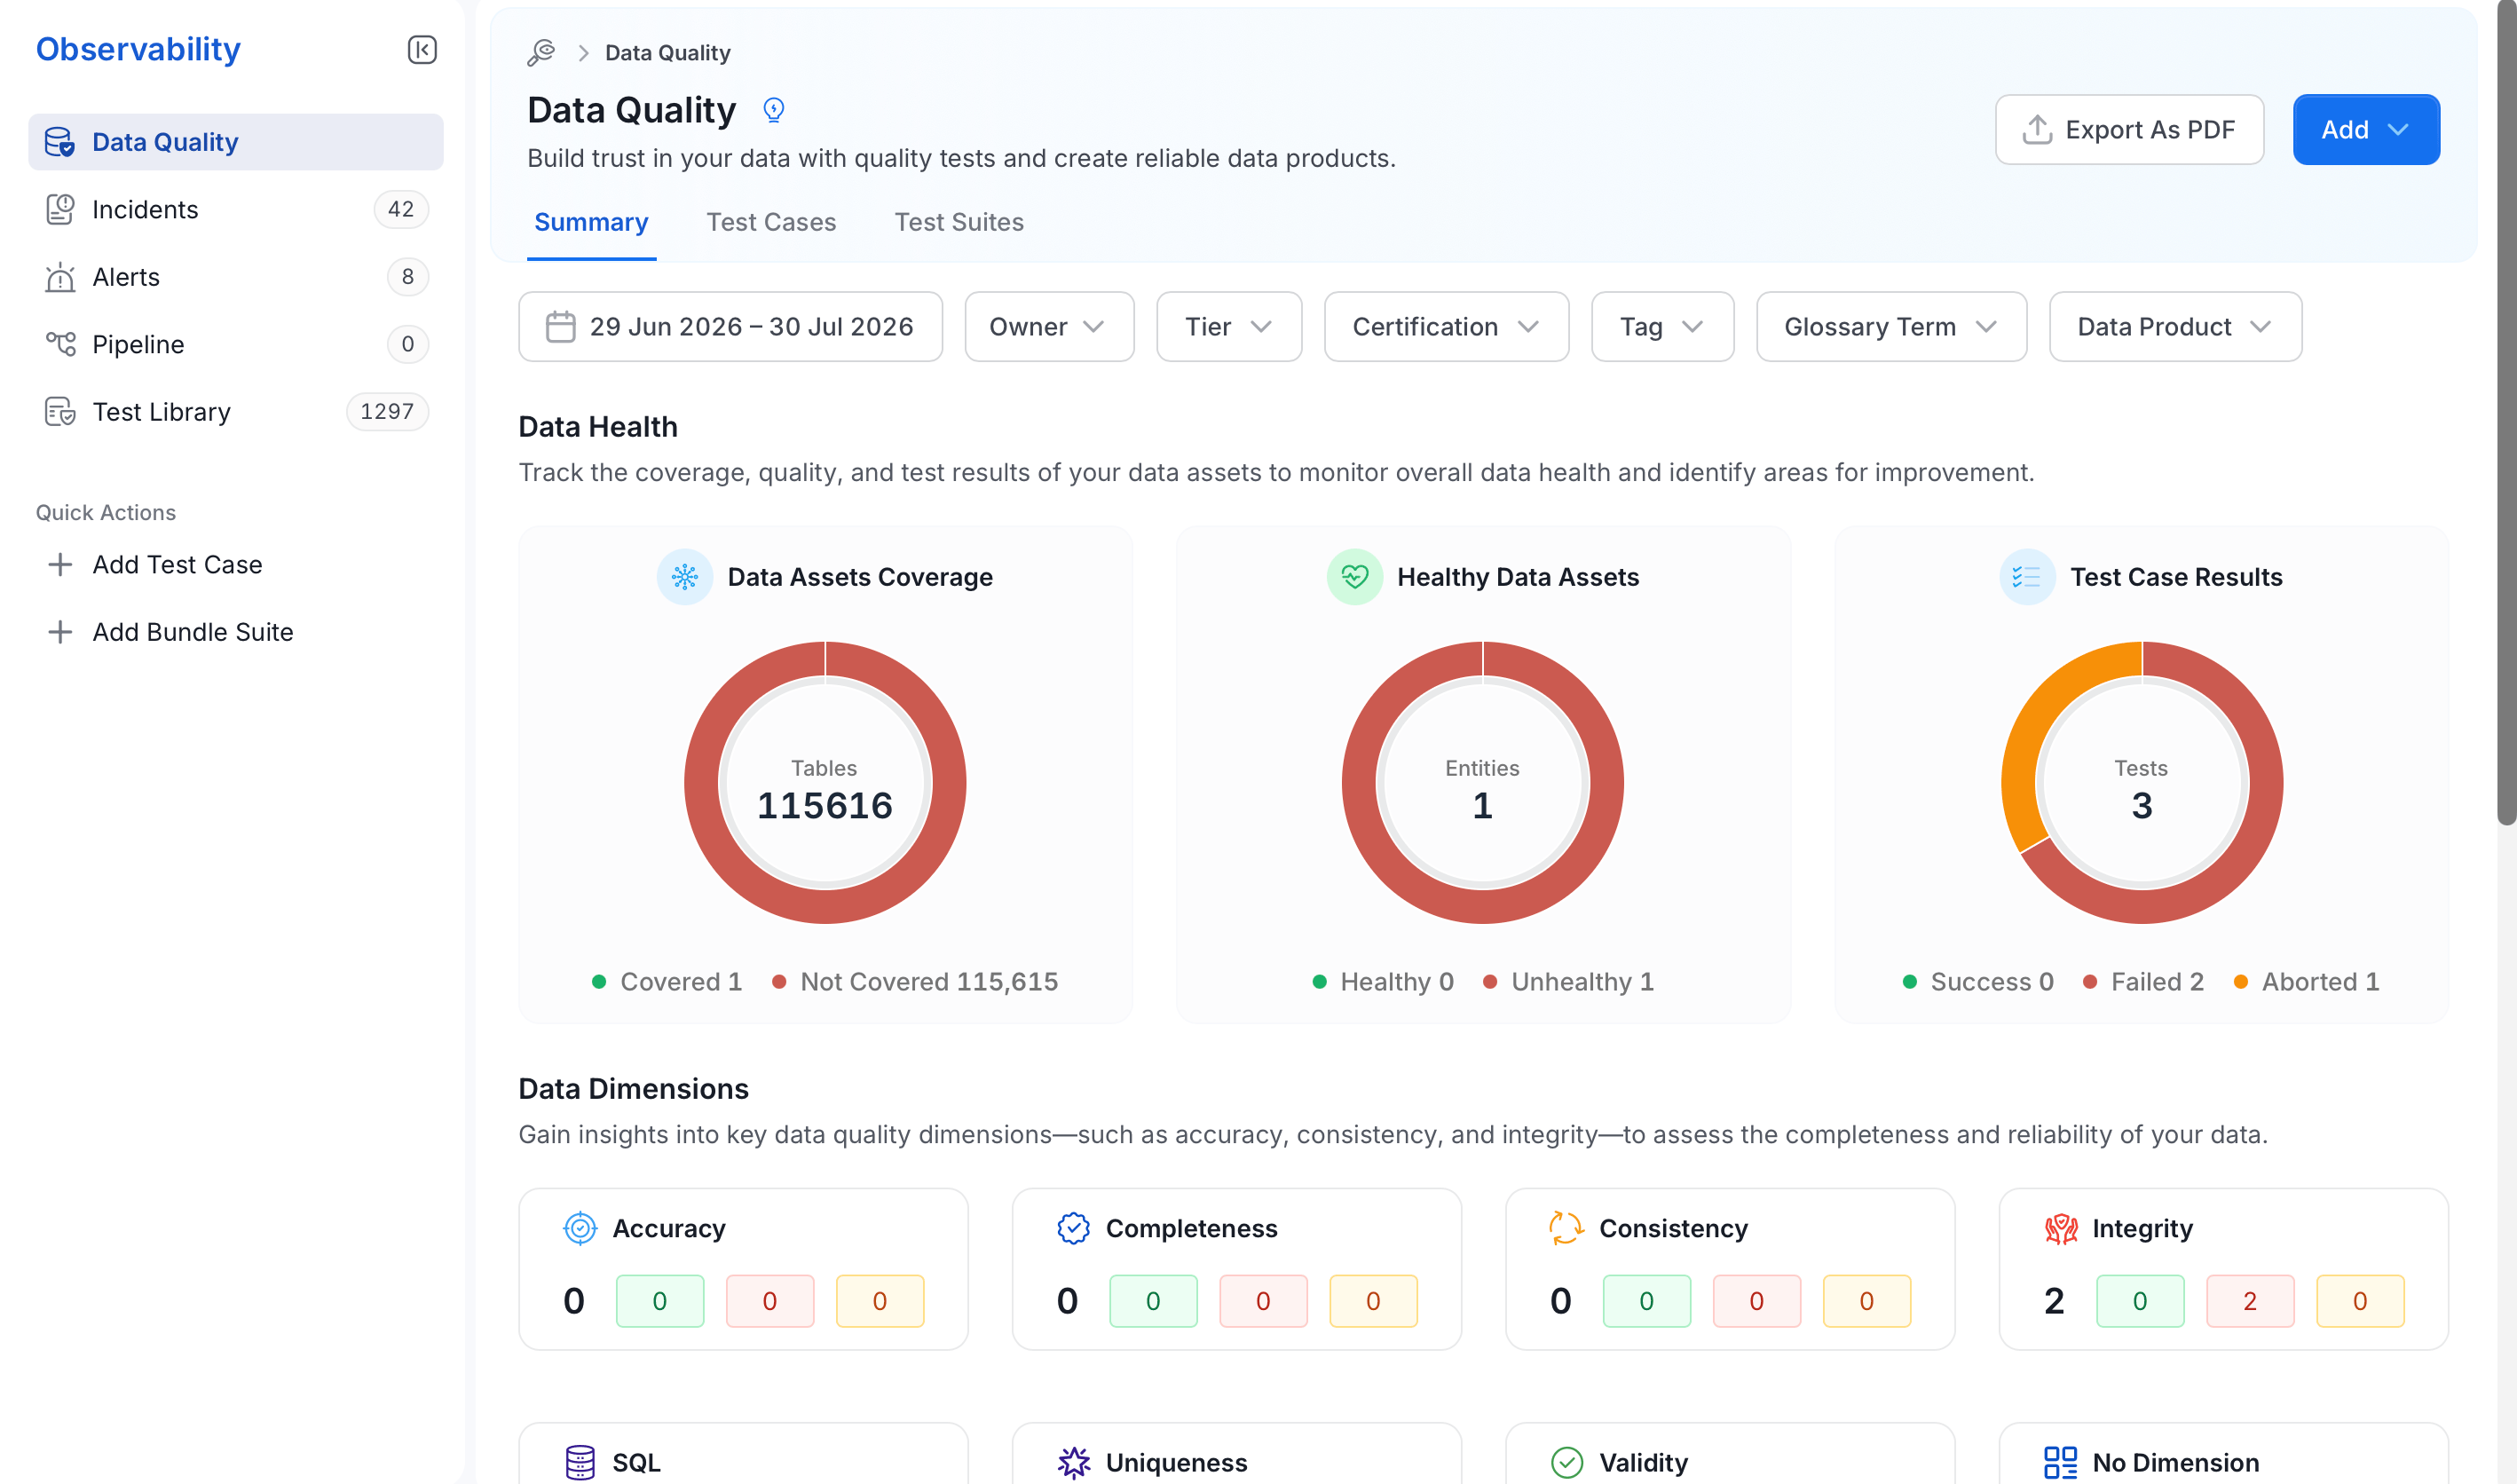
What’s on the Data Quality Page
The Data Quality page has three tabs:- Summary: Covers health, dimensions, test trends, and incident metrics
- Test Cases: Browse, filter, and manage test cases across your data assets
- Test Suites: Organize tests into suites for scheduling and ownership
Summary Dashboard
The Summary tab gives you a quick snapshot of your data quality, broken into four sections:Data Health
Three donut charts show the overall state of your data:- Data Assets Coverage: How many tables have at least one test
- Healthy Data Assets: Entities where all tests are passing
- Test Case Results: Total test count, broken down by Success, Failed, and Aborted
Data Dimensions
Cards group your test results by quality dimension, showing where failures are concentrated. All eight dimensions are:- Accuracy: Values match expected real-world values
- Completeness: No missing or null values
- Consistency: Data stays consistent through processing
- Integrity: Entity attributes meet structural expectations
- SQL: Custom SQL-based test definitions
- Uniqueness: No unexpected duplicates
- Validity: Values conform to domain rules and formats
- No Dimension: Tests not yet assigned to a dimension
Test Case Status
Trend charts show how Success, Failed, and Aborted test counts have changed over time, helping you spot patterns and catch regressions early.Incident Metrics
This section tracks the health of your incident workflow: open incidents, resolved incidents, time to response, and time to resolution.Filters
Use the date range and attribute filters (Owner, Tier, Certification, Tag, Glossary Term, Data Product) to focus the dashboard on a subset of your data assets.Data Observability Across Entities
Domain, Tag, and Glossary Term pages each include a Data Observability tab. This tab reuses the same dashboard with filters automatically applied to the selected entity, letting you analyze data quality in context without manually setting filters.Table-Level Observability
For deeper analysis at the dataset level, each table page includes:- A Data Observability section scoped to the table
- An Overview tab showing:
- Open incidents
- Upstream failures
- Quick access to lineage
- Links to incident investigation
Data Quality Tab
See test results, status, and coverage for any table at a glance.
Quality by Dimension
Track data quality across six dimensions: Completeness, Accuracy, Consistency, Validity, Uniqueness, and Integrity.
Write No-Code Tests from the UI
Add table and column-level tests without writing any code.
Visualize Test Results
Filter test cases by status, review result history, and open run details.
Configure Data Quality
Set up and schedule data quality pipelines with Collate’s built-in tests.
Dimensional Validation
Break down test results by business segments to pinpoint exactly where quality issues occur.
Data Quality as Code
Define and run data quality tests programmatically using the Collate SDK.
Test Library
Build a shared library of reusable SQL-based test definitions across your organization.
Custom Tests
Write your own test cases and test suites for custom validation logic.
Here’s the latest on Collate’s data quality.