
Inbox and Activity Feeds
The Inbox surfaces all activity and tasks related to data assets you own or follow, in one dedicated place.Accessing the Inbox
Select the Inbox icon at the bottom of the left sidebar. The badge on the icon shows a combined count of open tasks and unread activity — so you can see at a glance when something needs attention.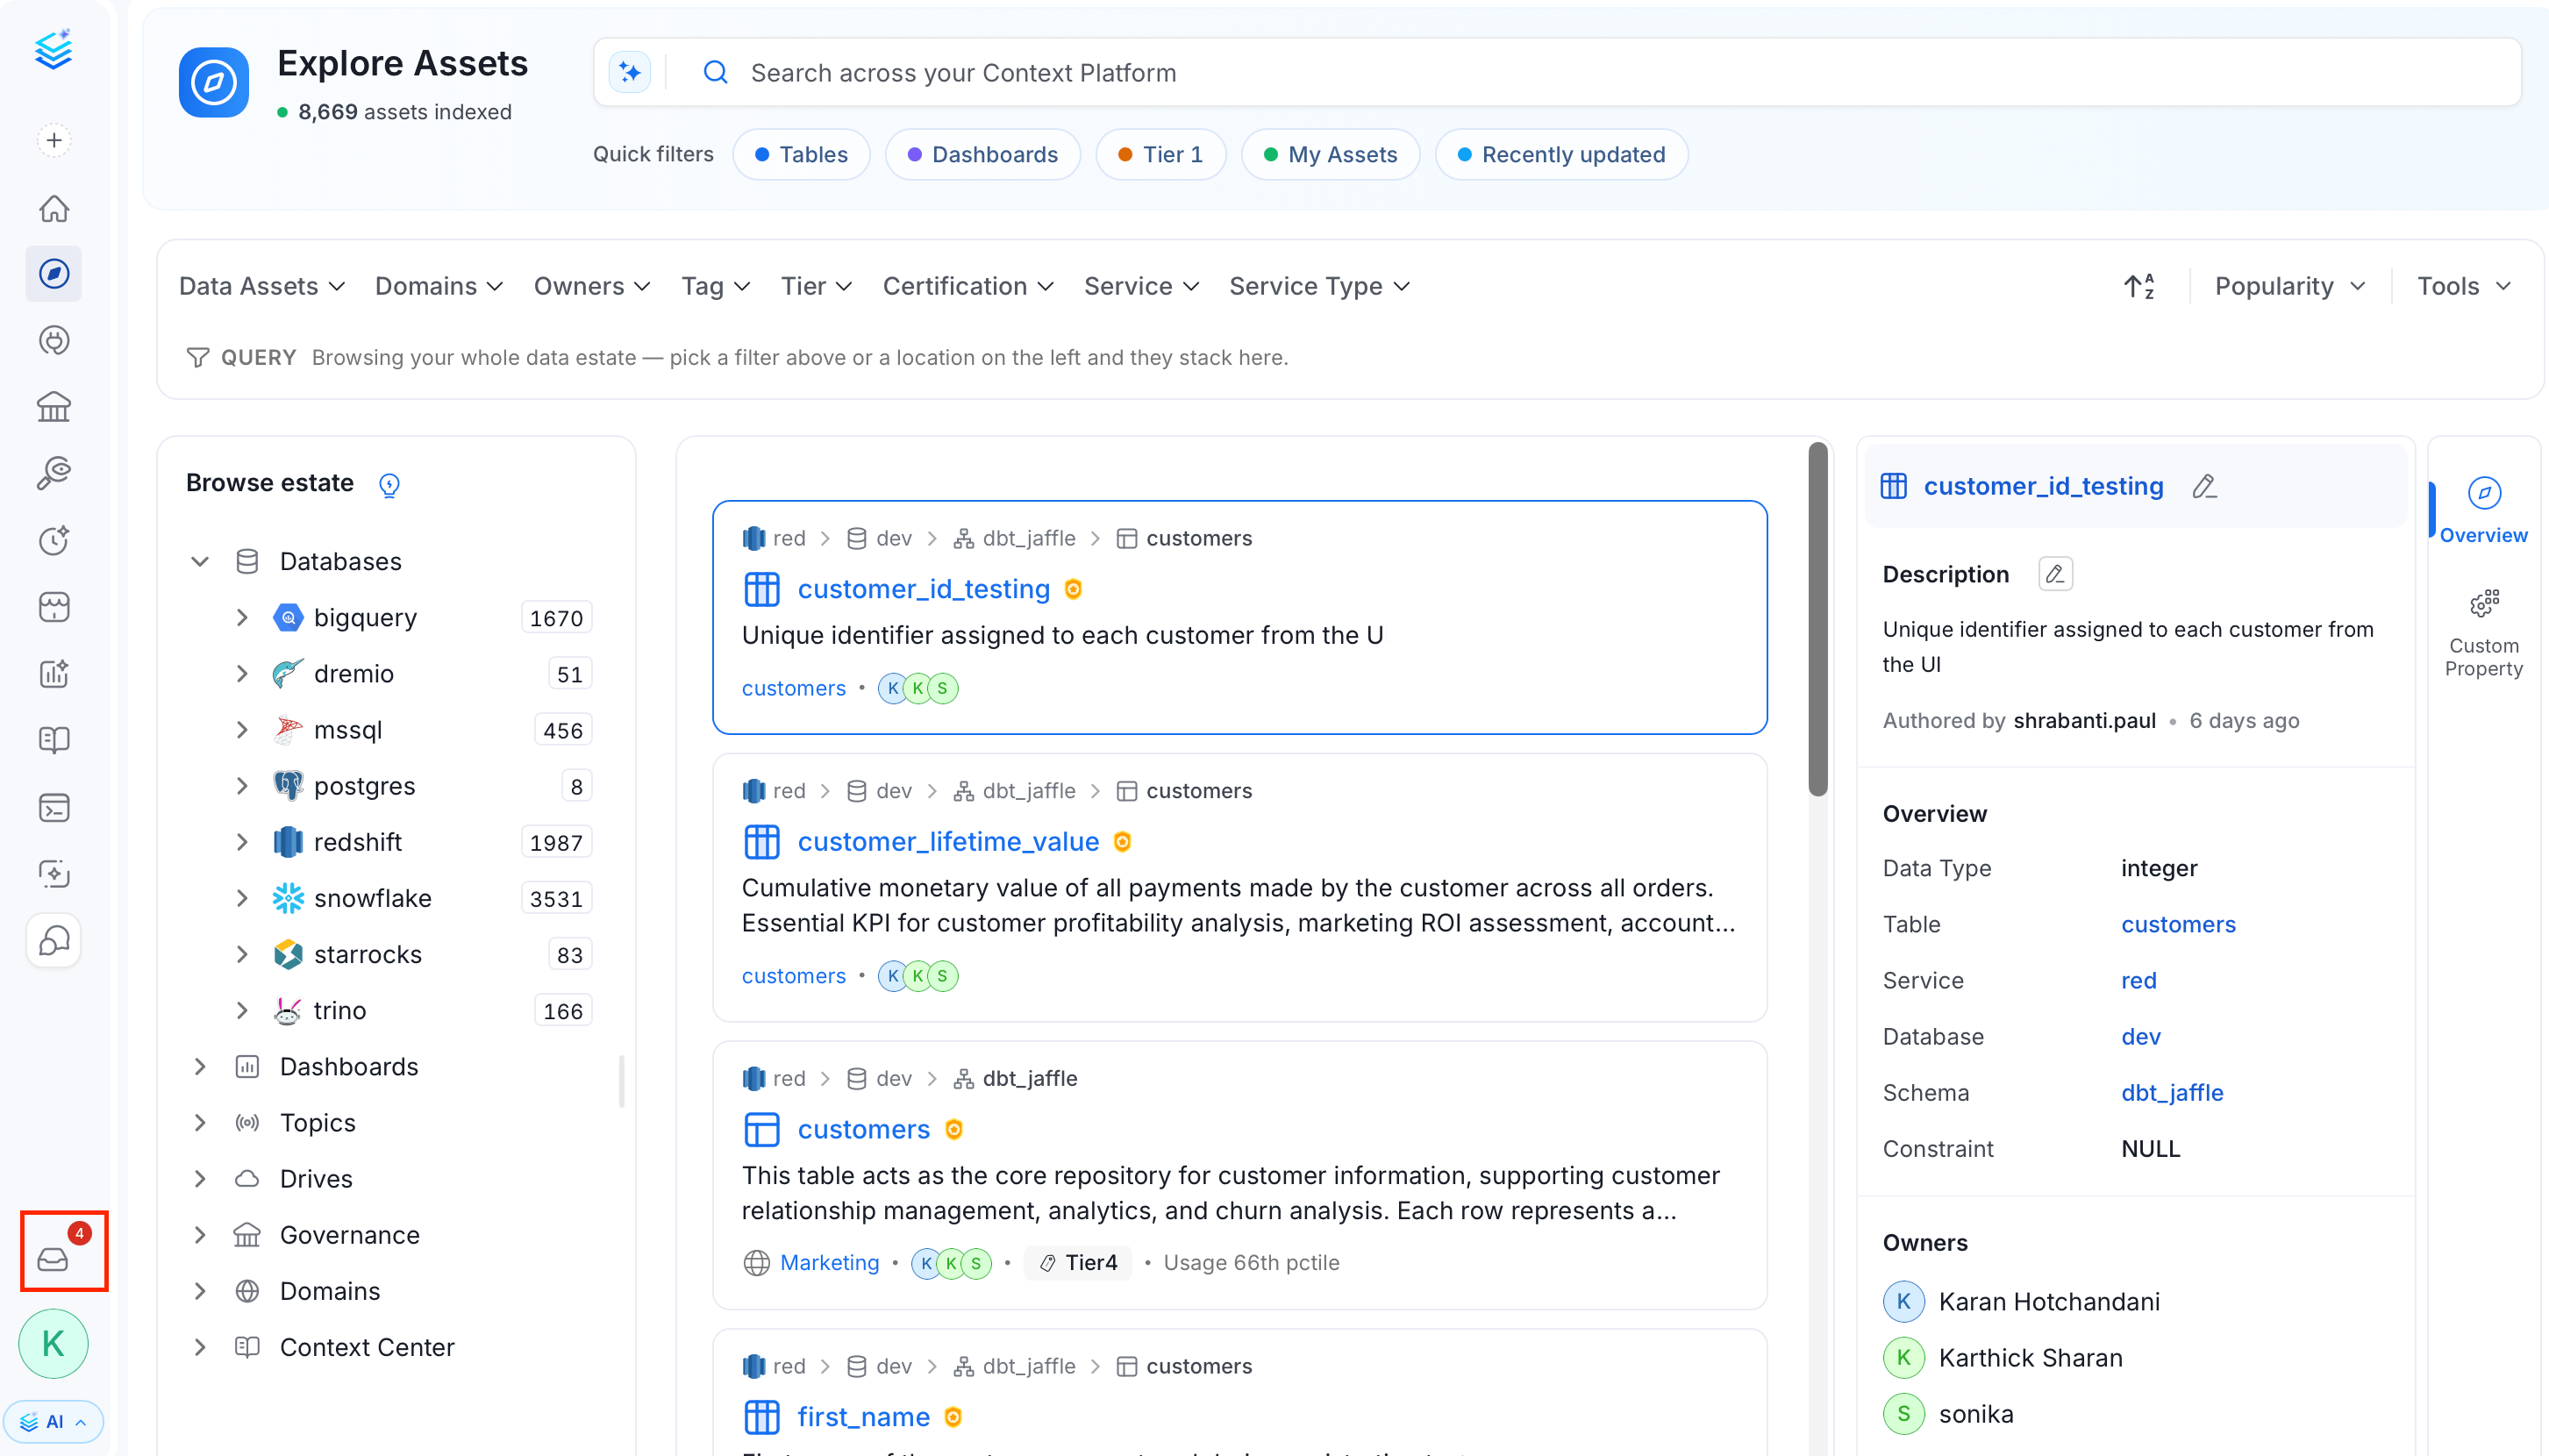
Triage Tab
The Triage tab is the main workspace for activity and tasks. Use the sub-tabs to switch between them.Activity
The Activity tab shows all activity related to data assets you own, follow, or where you’re mentioned, including @mentions, in a single unified feed.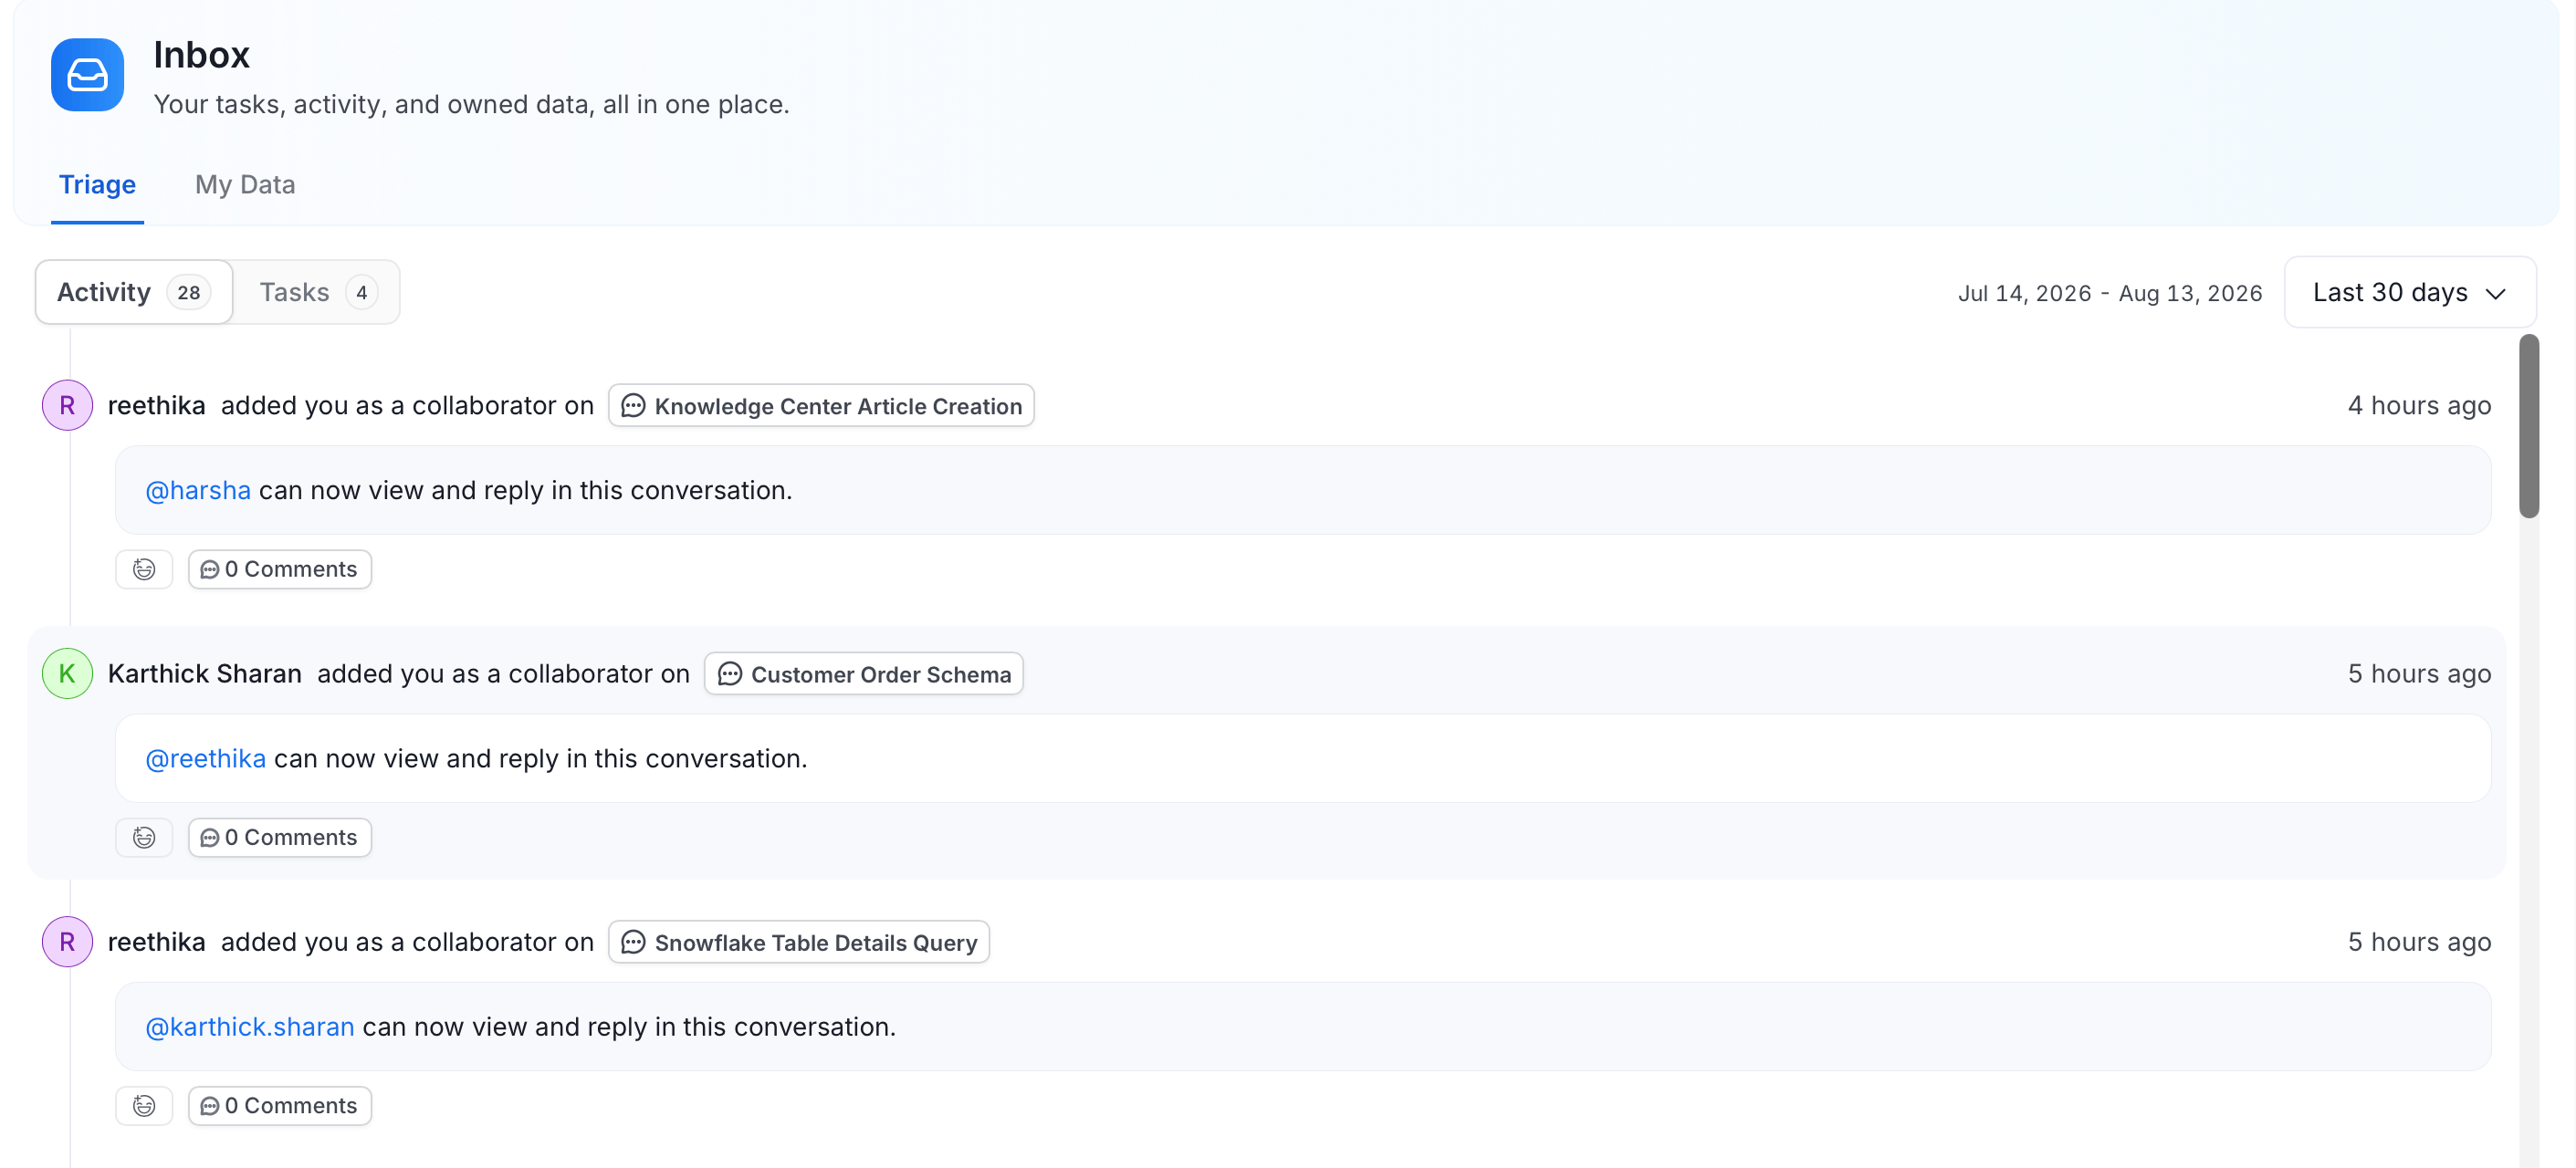
- Reply to continue a discussion
- React with an emoji
- Edit or Delete your own messages
@mention suggestions are scoped to the domain selected in the Domains filter on the Explore Assets page. With a domain selected, only users in that domain appear as suggestions, even if the asset has no domain set. Clear the filter to see every user again.Tasks
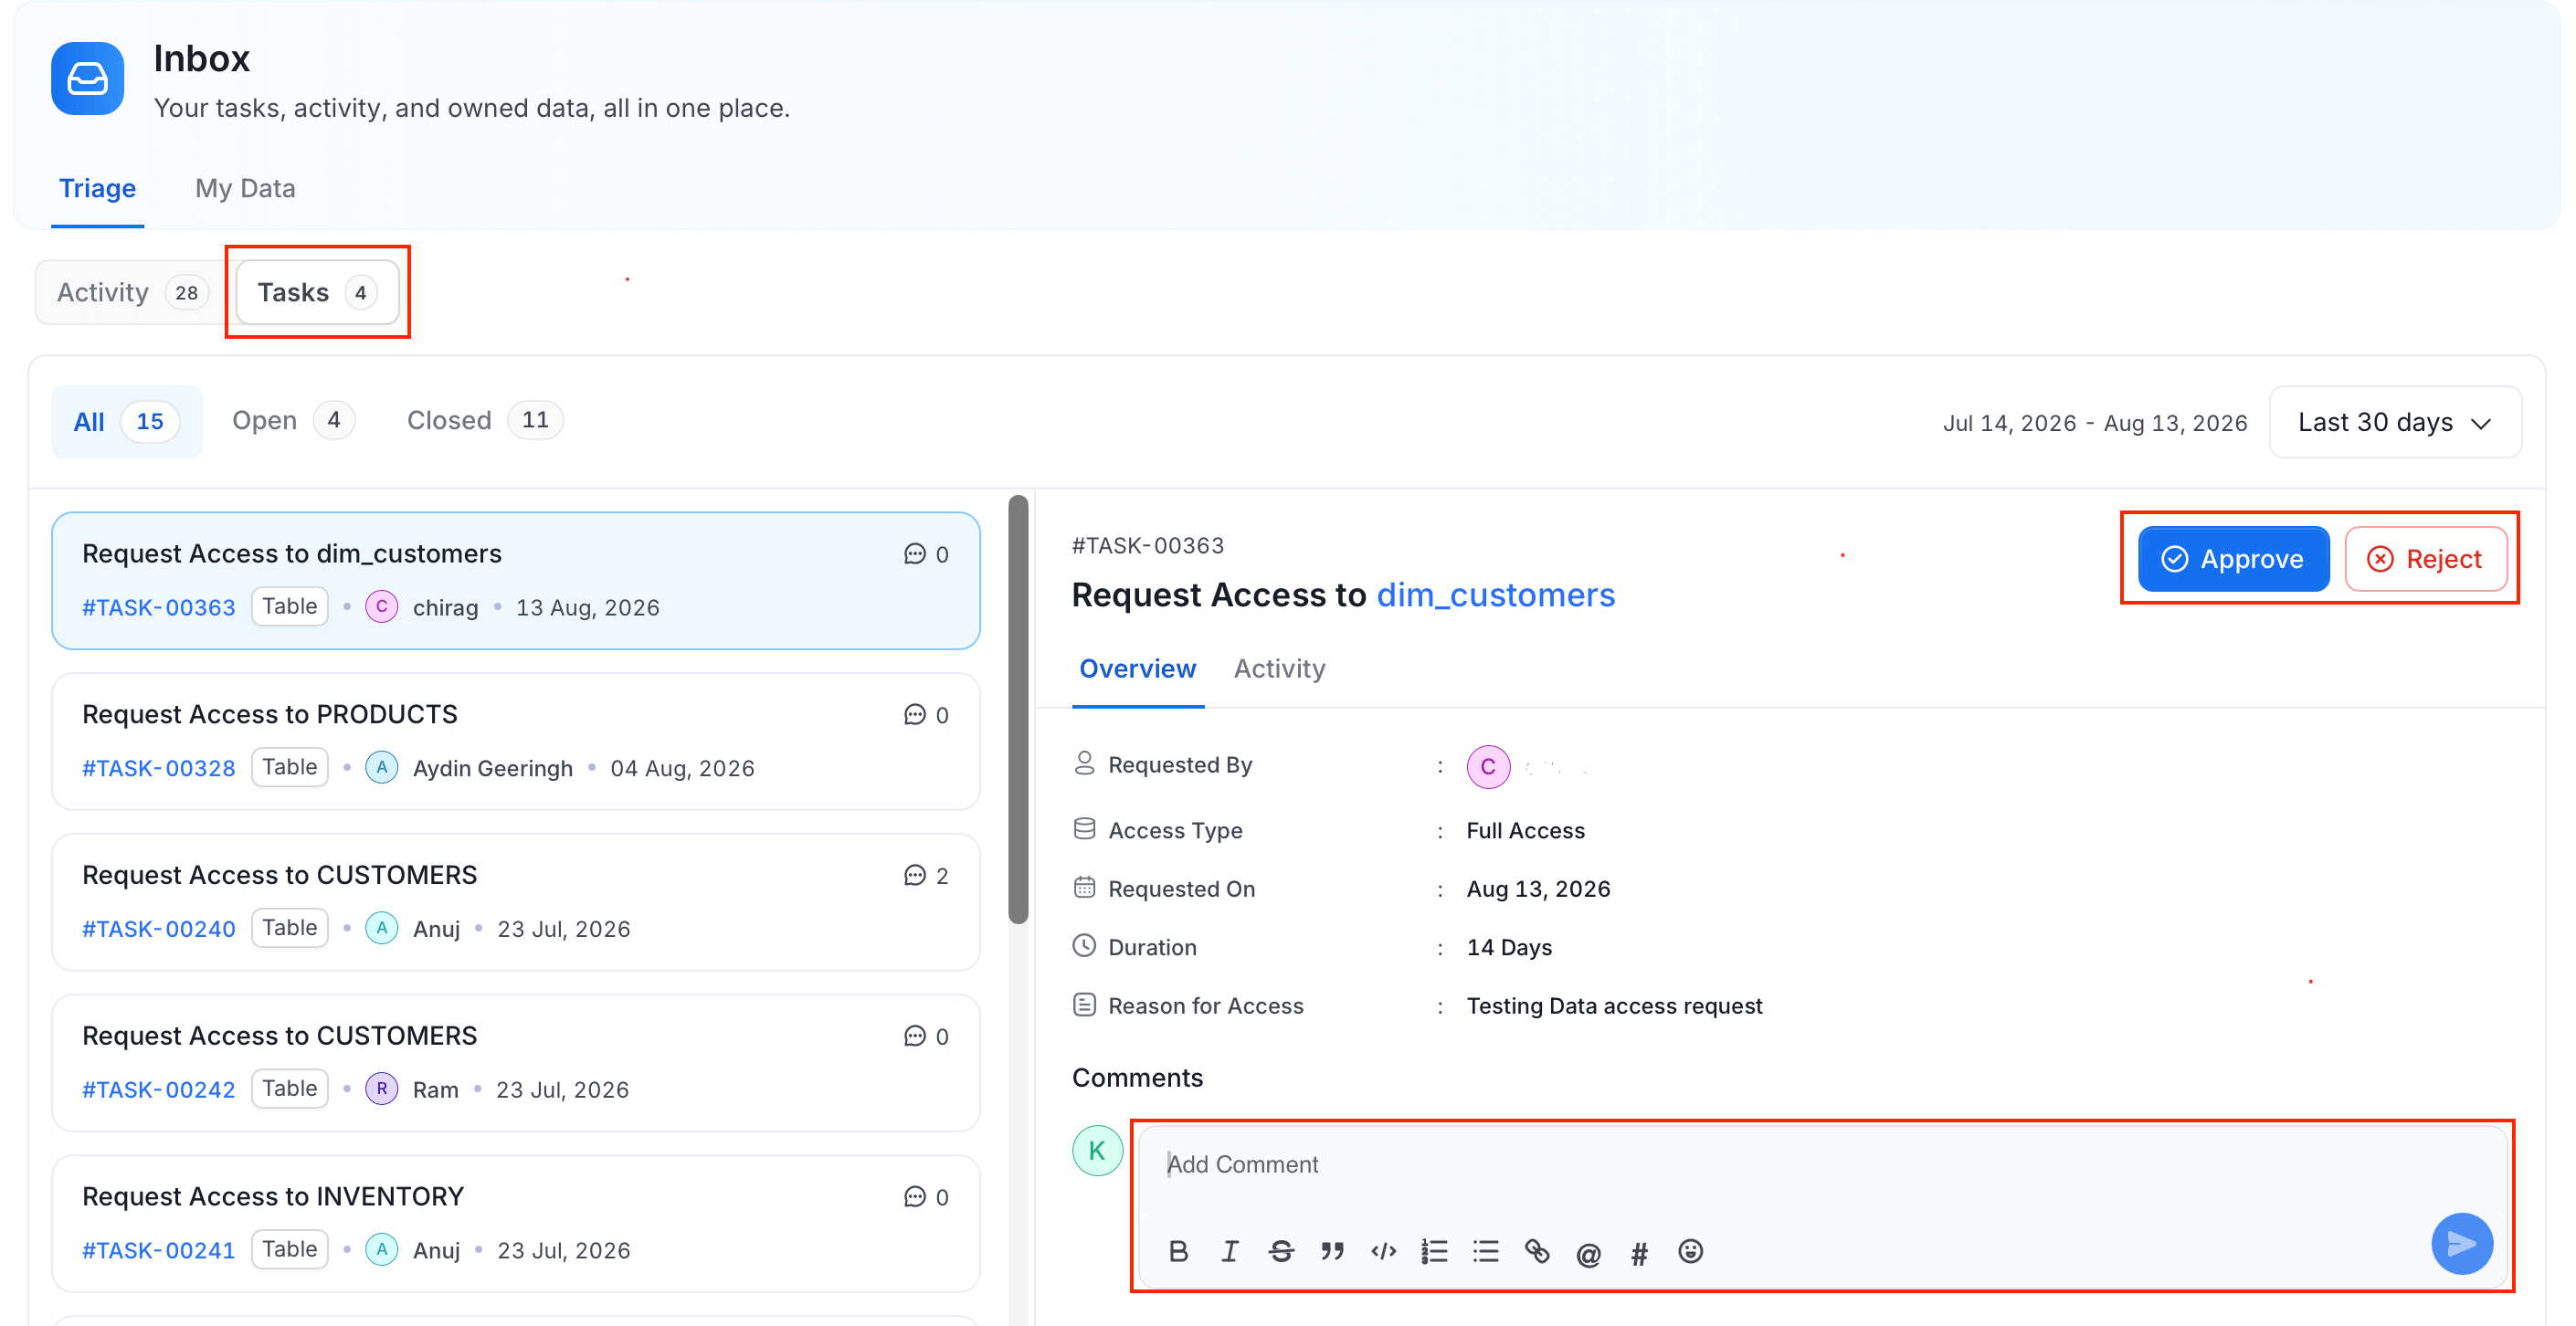
The Tasks sub-tab shows tasks created by you or assigned to you, with three filter tabs:- All — every task regardless of status
- Open (default) — tasks that still need action
- Closed — resolved or rejected tasks
Date Filter
Both sub-tabs include a date filter that defaults to the last 30 days. Select the date range text to open the picker and adjust the window.My Data Tab
The My Data tab gives you a quick overview of all data assets you own, along with their health status.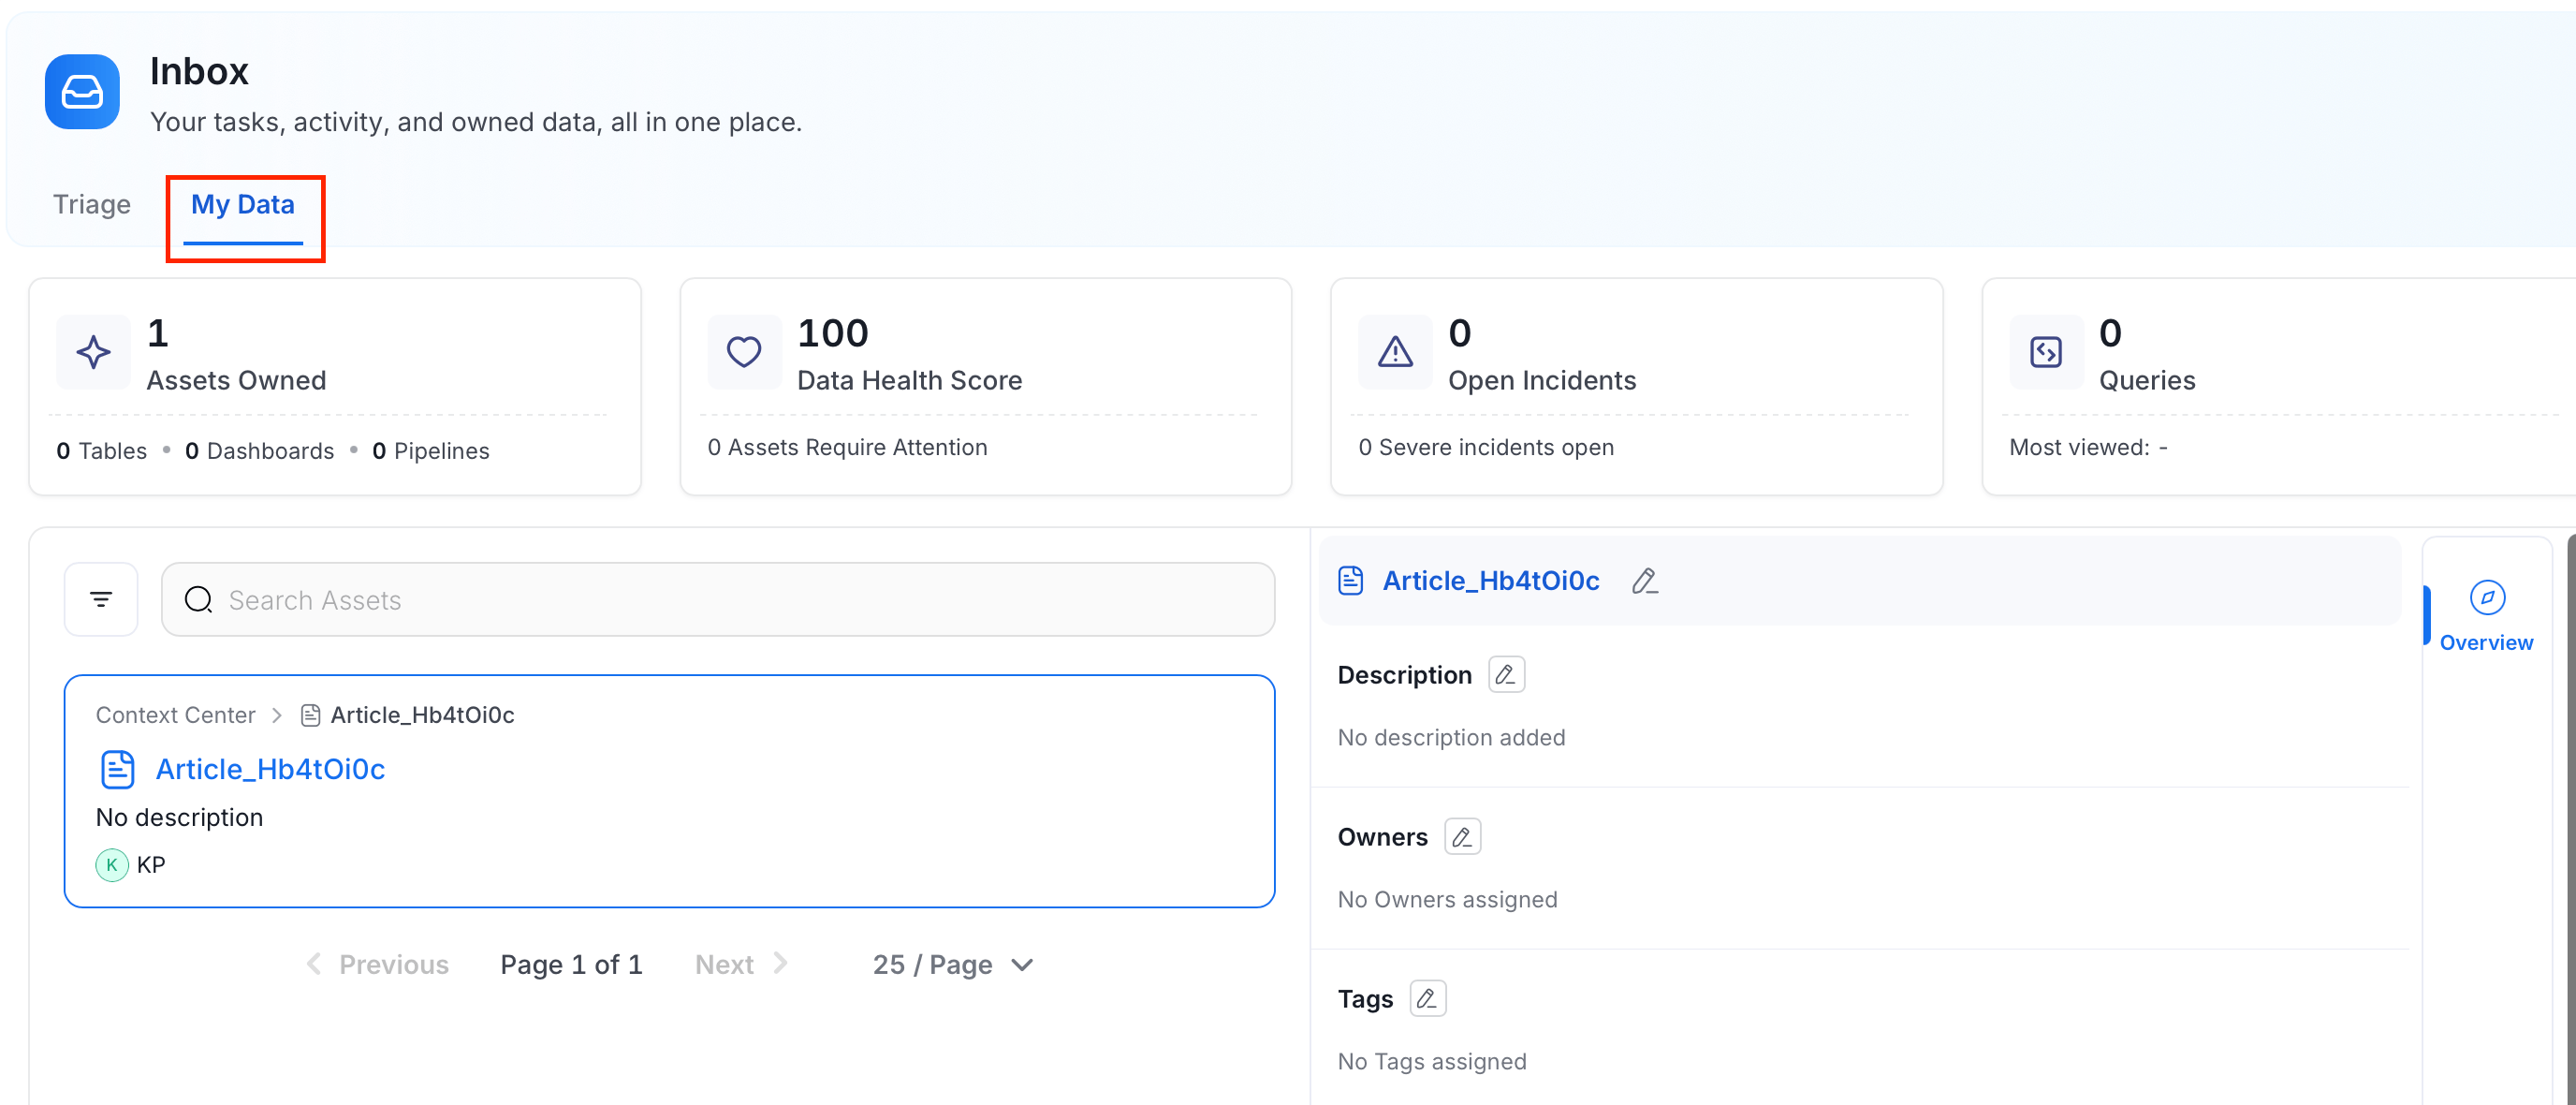
- Assets Owned — total count, broken down by Tables, Dashboards, and Pipelines
- Data Health Score — number of assets that require attention
- Open Incidents — number of active incidents, with a severity breakdown
- Queries — query count for your owned tables, with a link to the most-viewed table