
Explore the Lineage View
Collate displays end-to-end lineage for the table and column levels, for Database, Dashboard, and Pipeline assets. Search for a data asset and expand the graph to see its lineage:- Each node expands to show its upstream and downstream edges.
- Each edge carries details such as the SQL query, pipeline information, and column-level lineage.
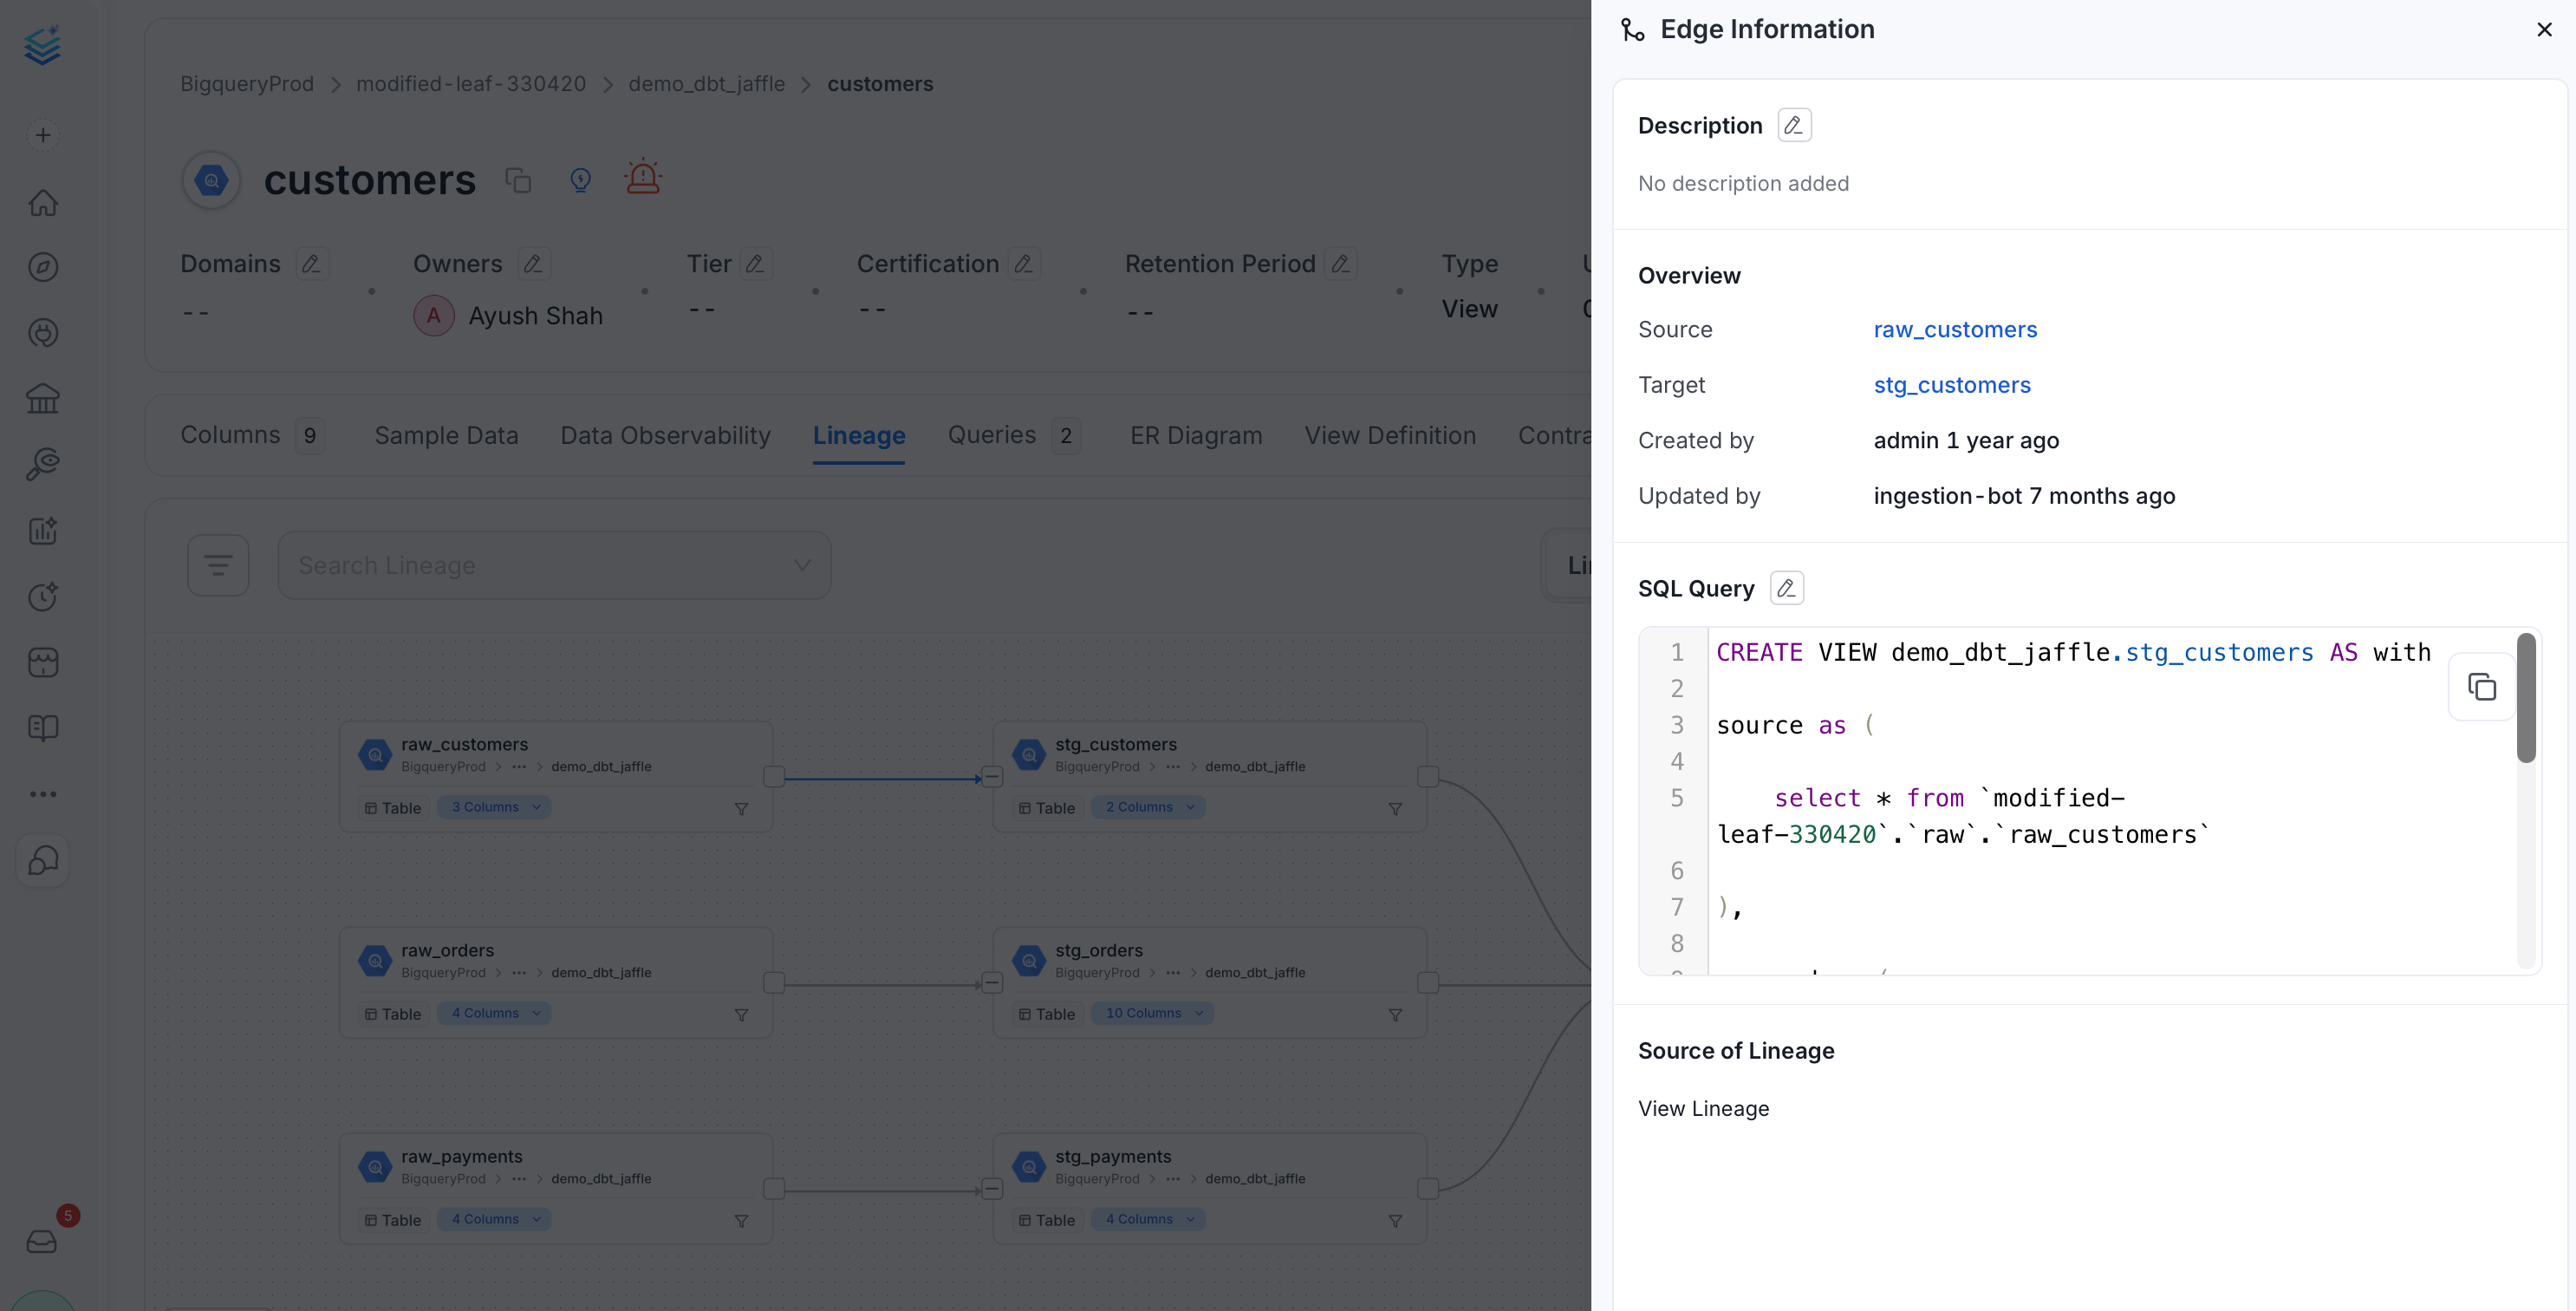
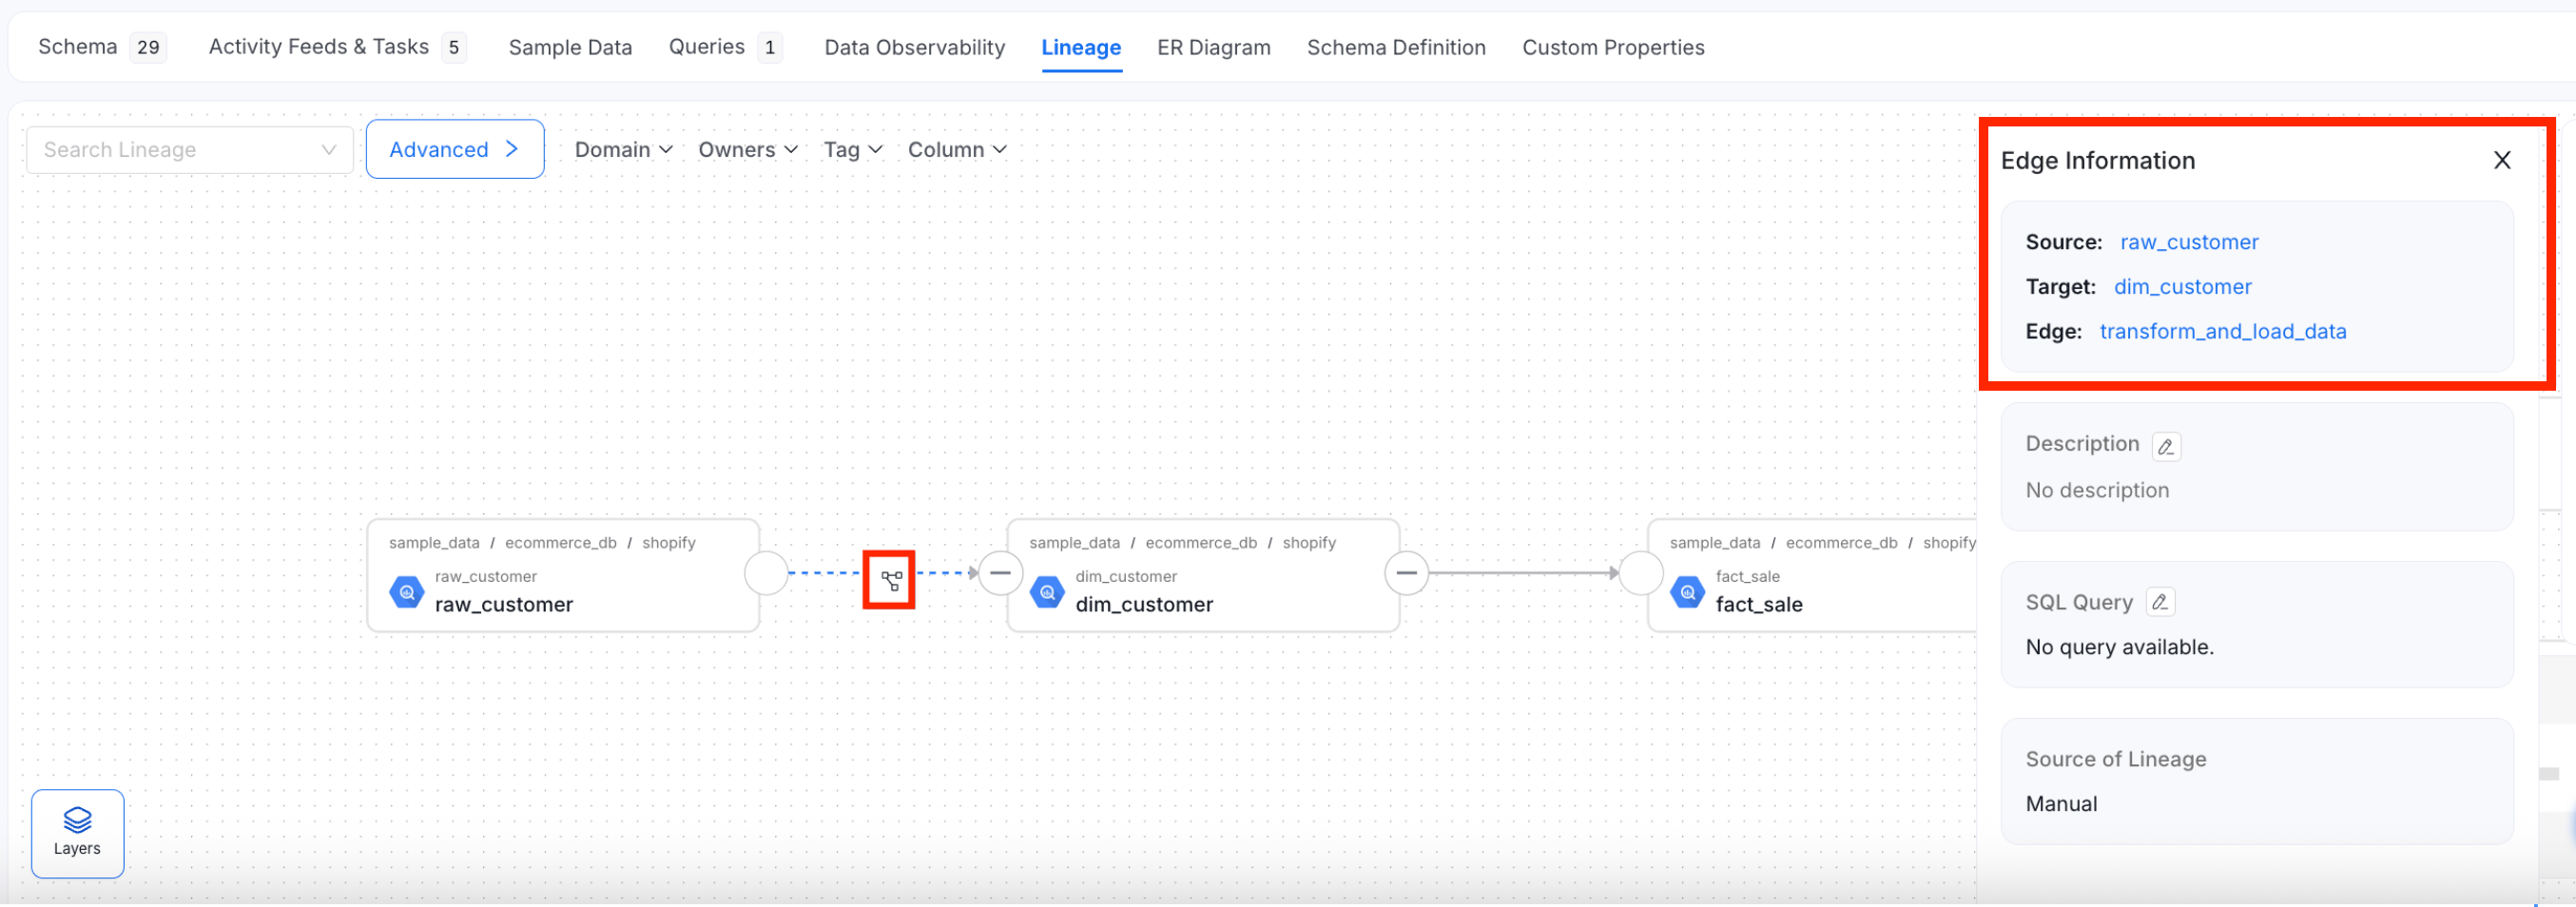
Source, Target, and Edges
In the example below:- The table on the left is the parent, or Source node.
- The table on the right is the Target node, identifiable by the arrow pointing into it.
- The arrow connecting them is the Edge.
Lineage Config
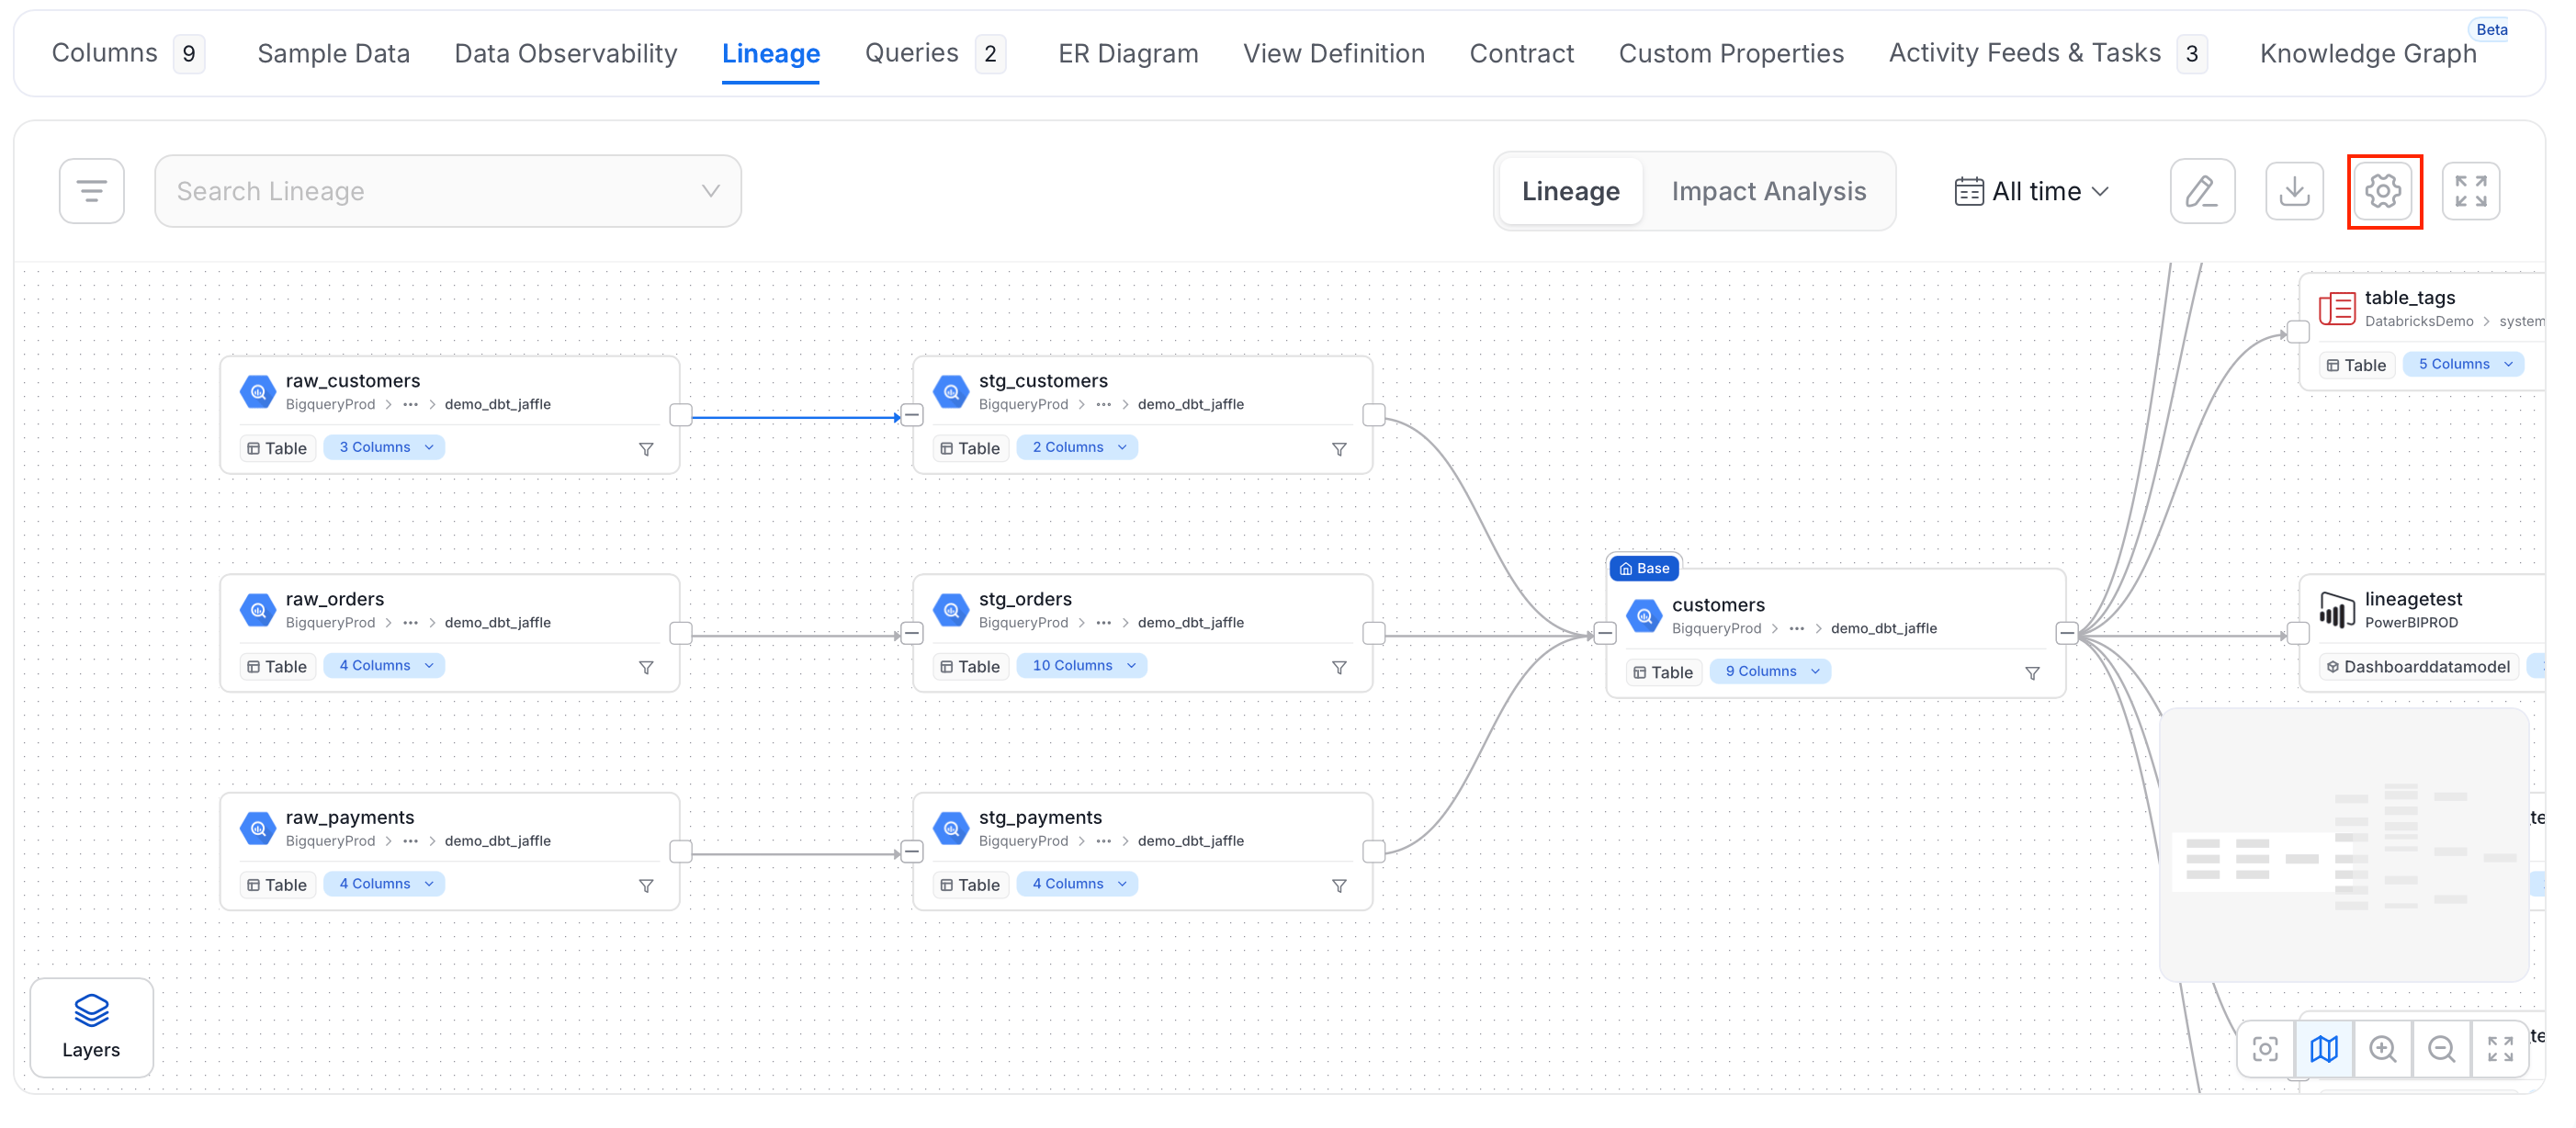
Control how many upstream and downstream nodes appear in the graph. This only affects your current view: it resets to the platform default the next time you open a lineage graph. To configure the lineage nodes, follow the steps below:-
Click the Setting icon.
-
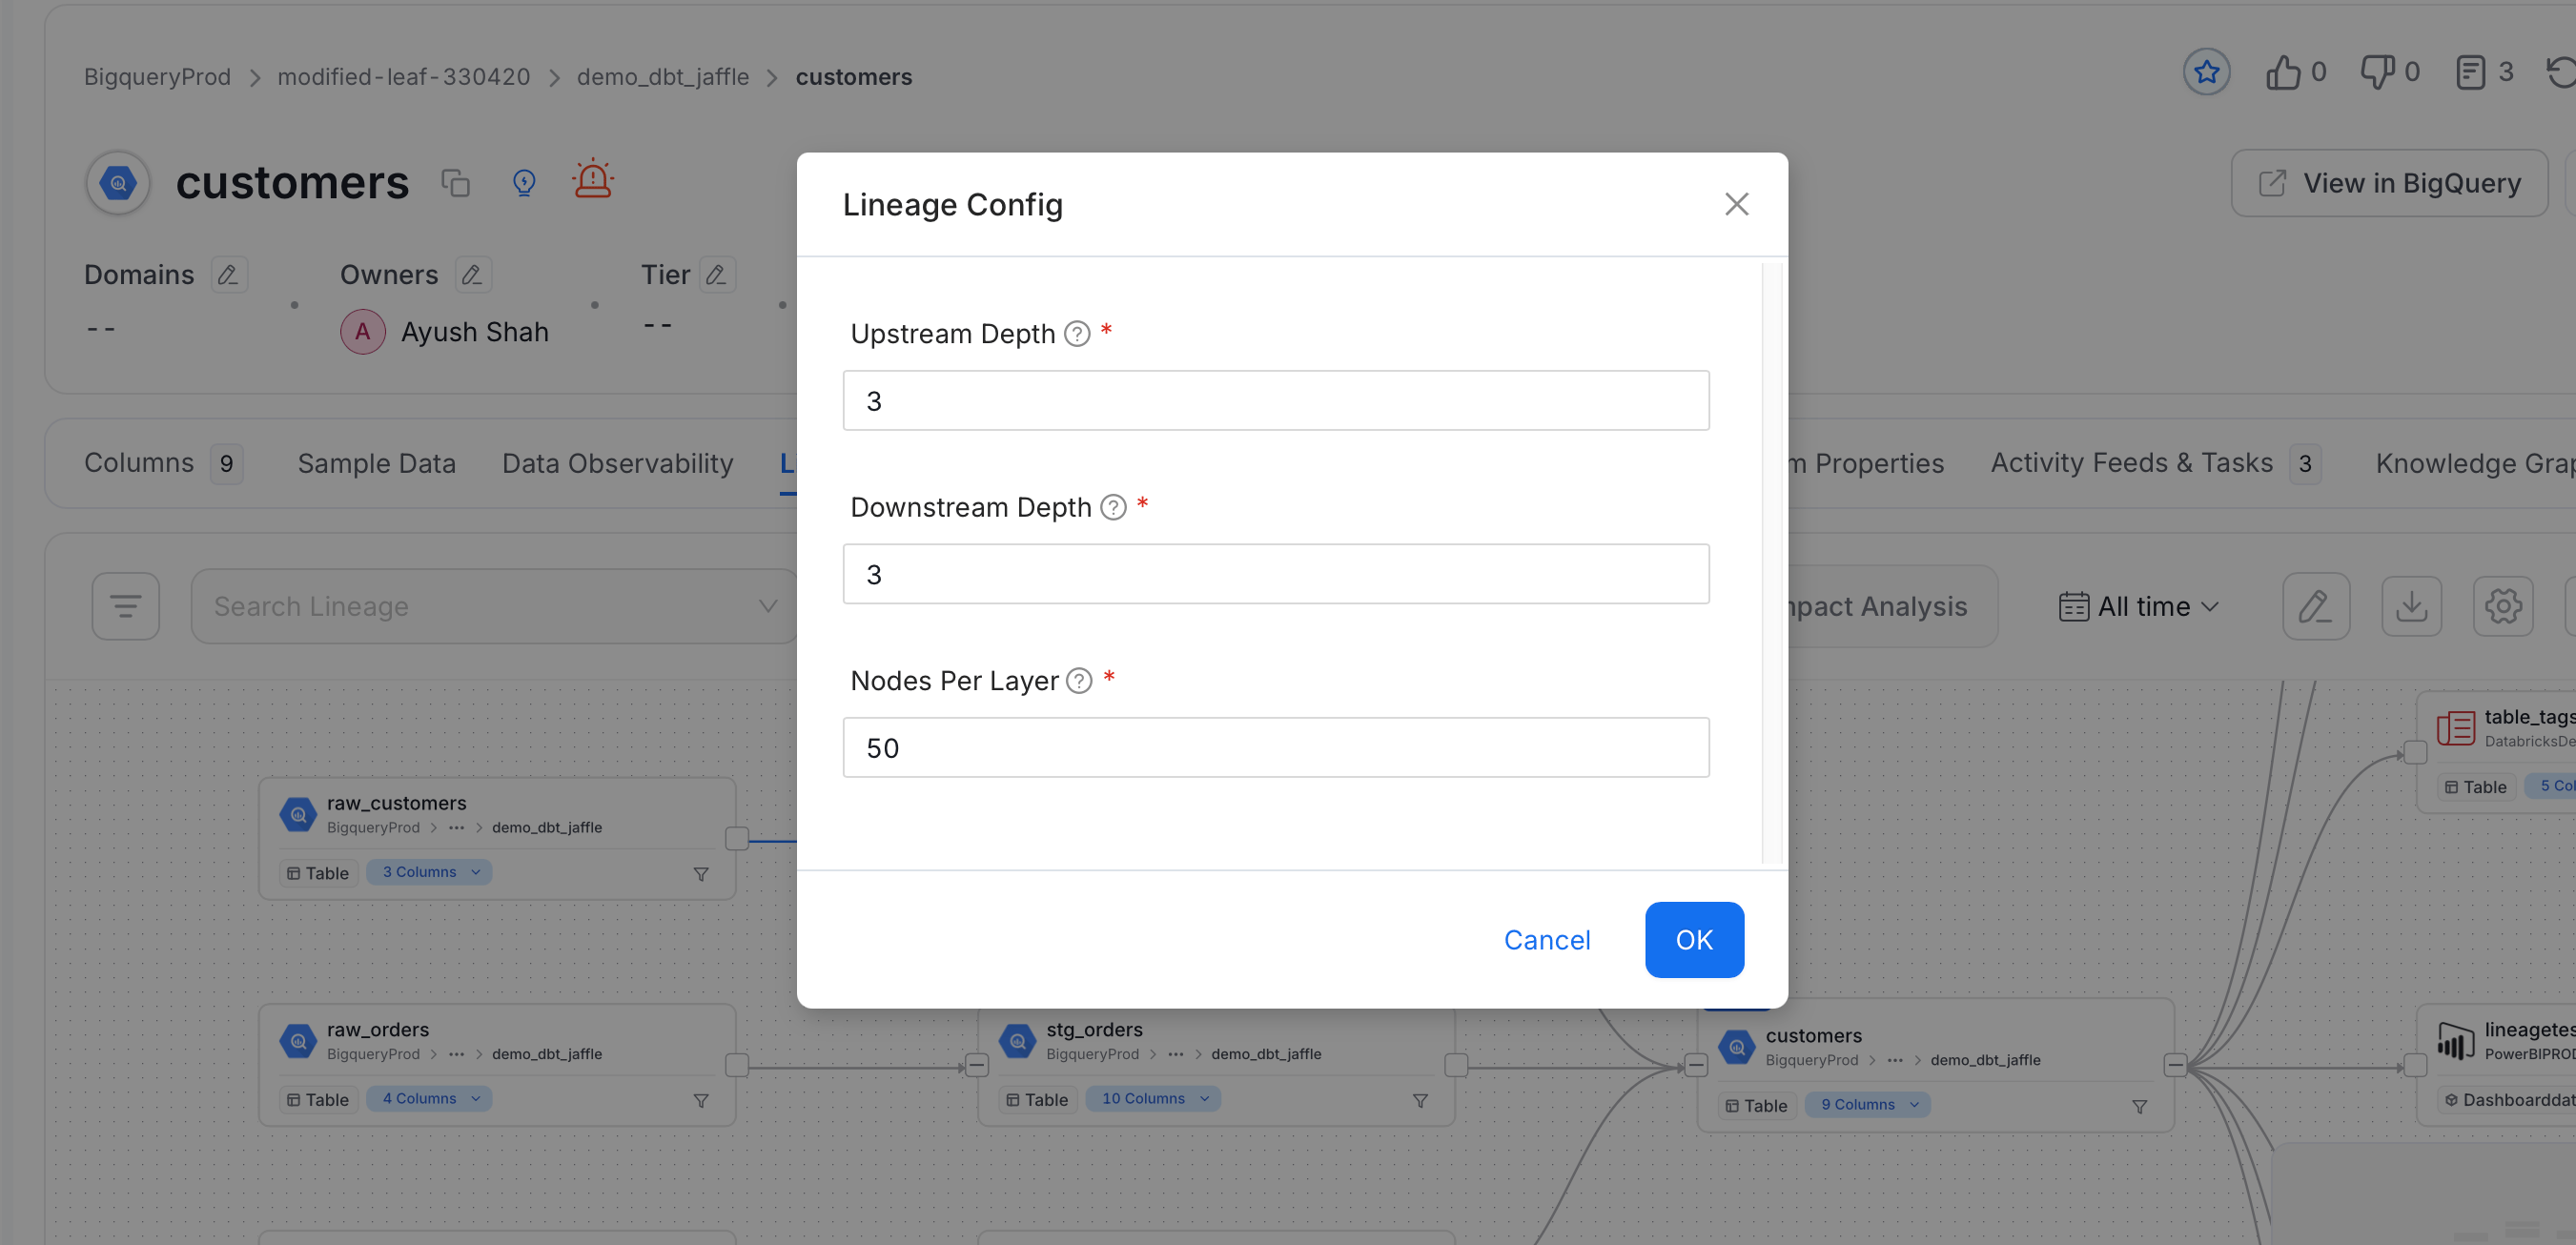
Set the following fields:
- Upstream Depth: Number of upstream hops shown by default when opening a lineage graph, to identify parent-level sources.
- Downstream Depth: Number of downstream hops shown by default when opening a lineage graph, to identify child-level targets.
- Nodes Per Layer: Maximum number of nodes shown per layer. There’s no fixed maximum here. If a layer has more nodes than this, the rest are paginated instead of all being rendered at once.
Filtering Lineage by Time
On an asset’s Lineage tab, use the calendar control in the toolbar to limit the graph to edges observed within a specific time range. It’s labeled All time by default. This is useful for seeing what an asset’s dependencies looked like as of a past date, or for narrowing a large graph down to recent activity.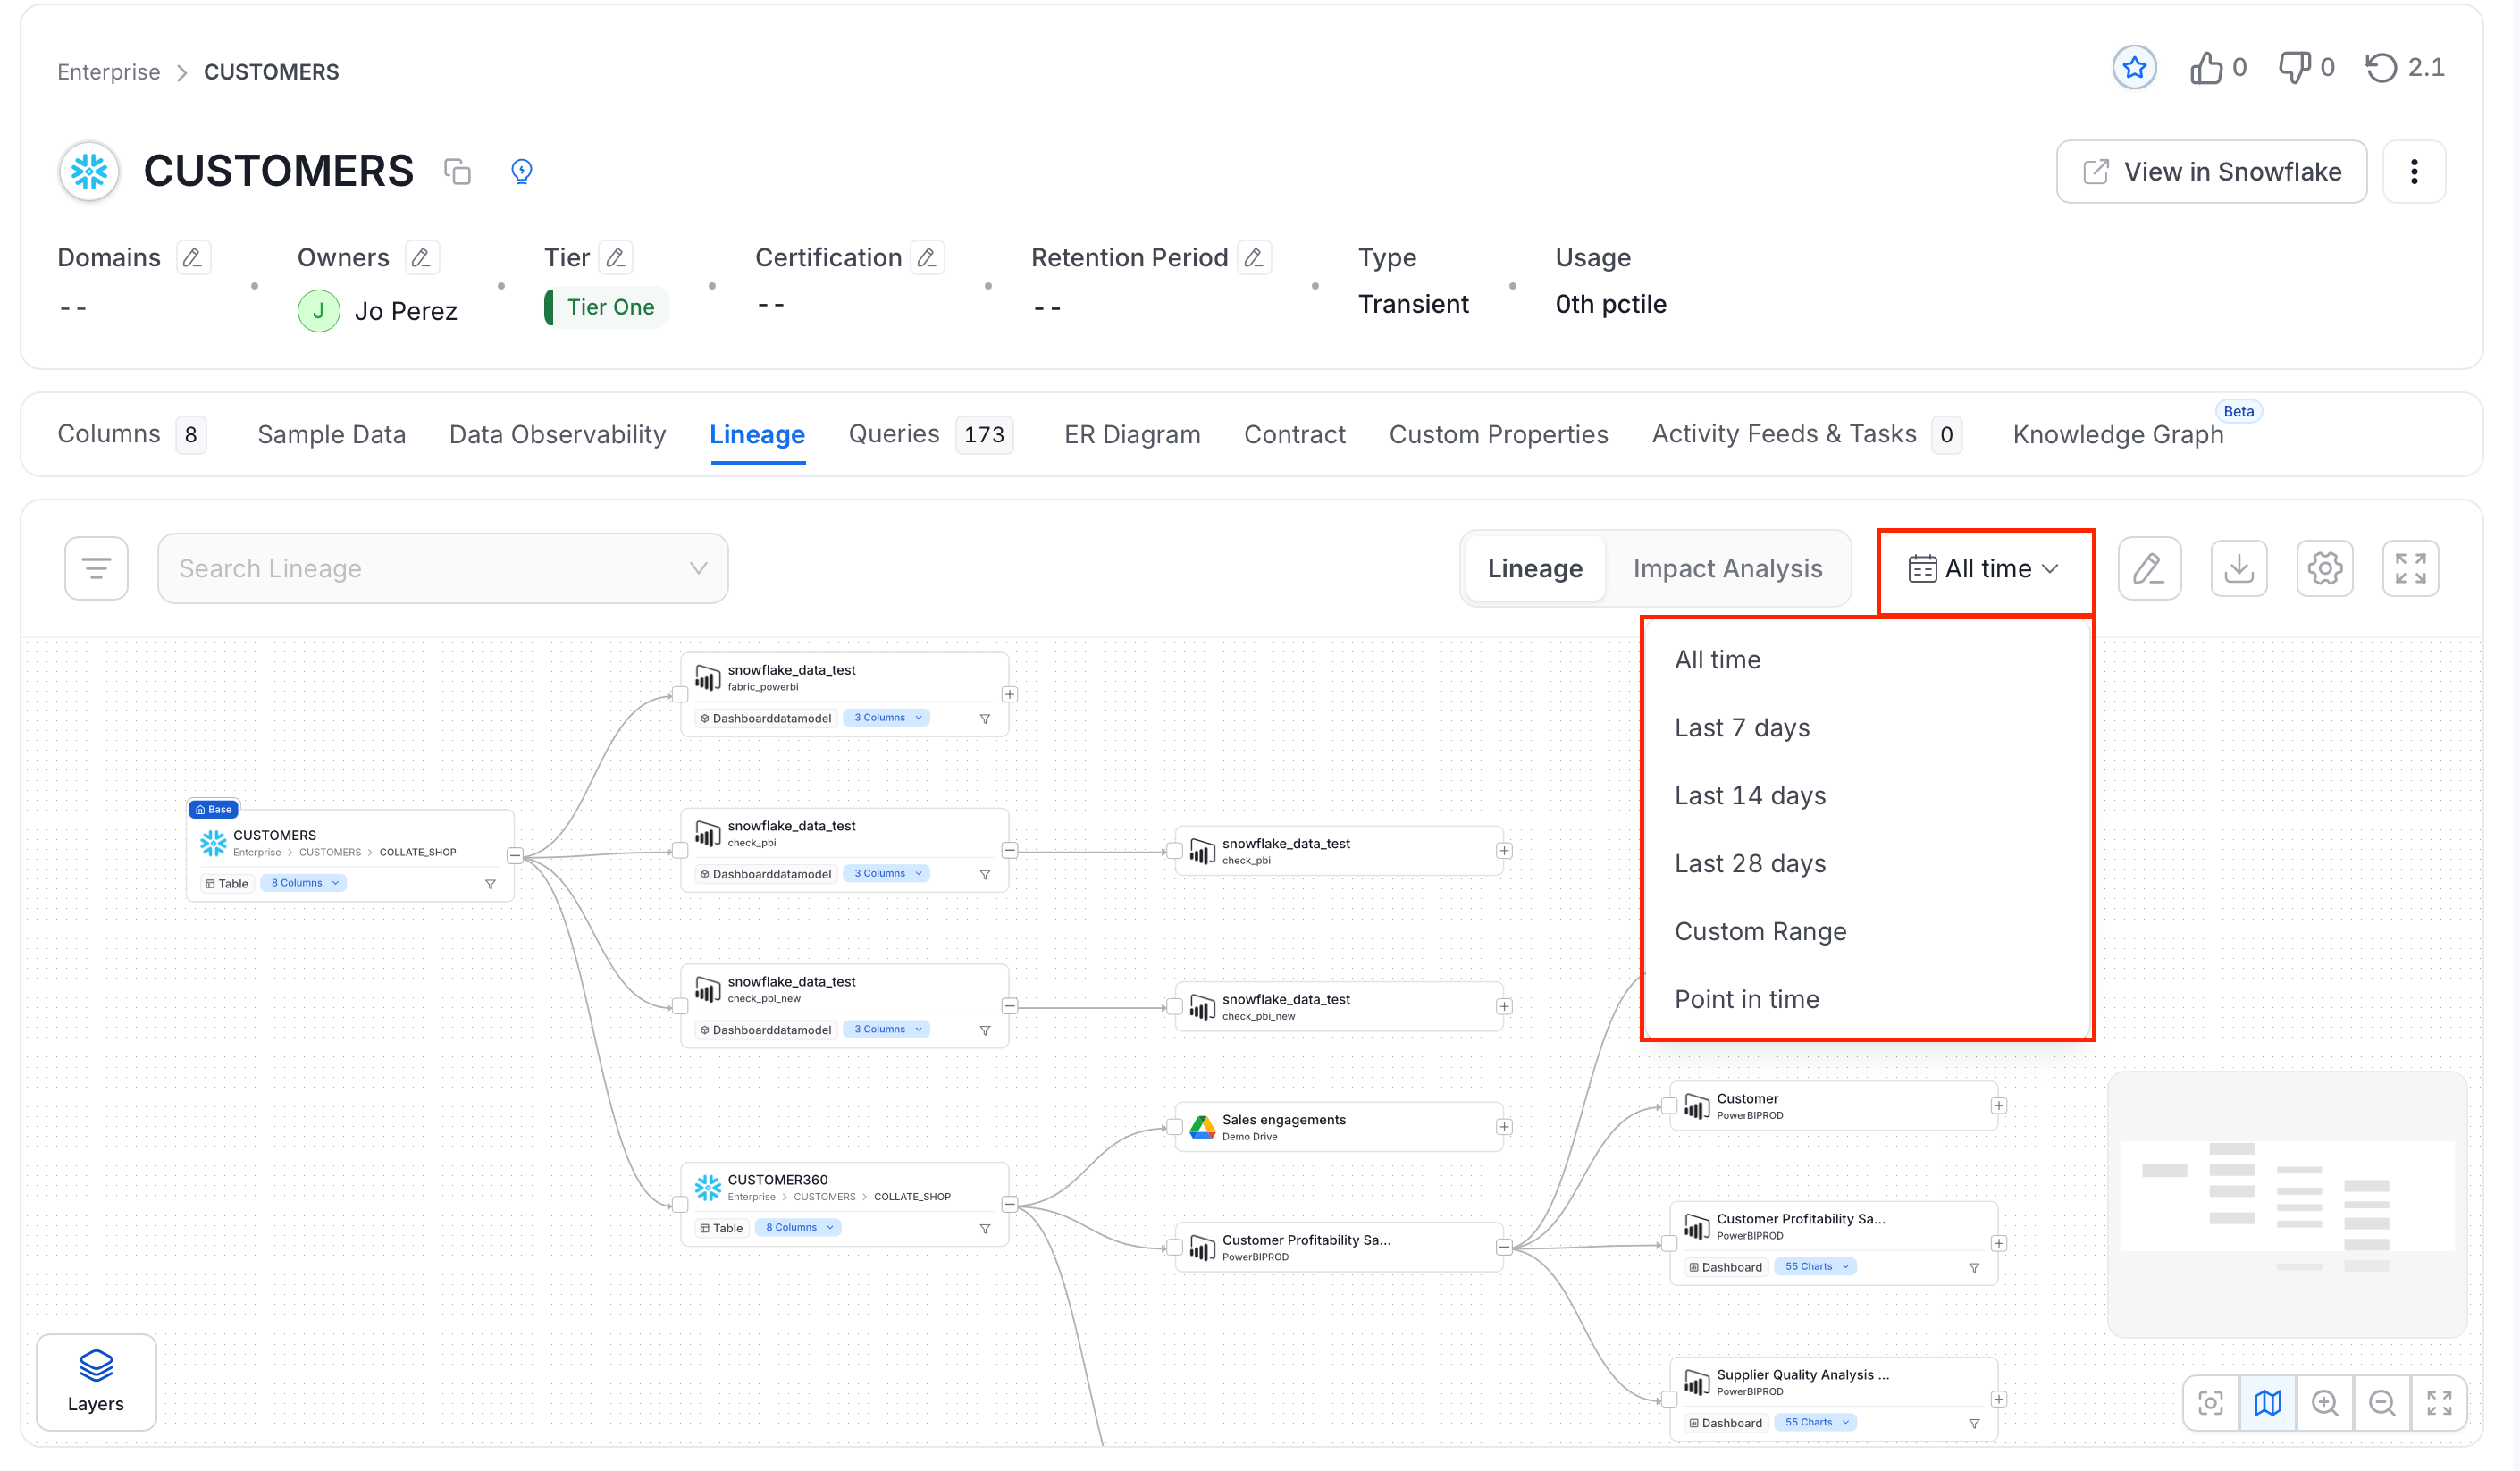
- All time: Show edges from any time (the default).
- Last 7 days / Last 14 days / Last 28 days: Show only edges observed in that rolling window.
- Custom Range: Pick a specific start and end date.
- Point in time: Show the graph as it looked on a specific date, with no start date.
Impact Analysis View
The Lineage page has two tabs at the top: Lineage (the graph you’ve seen so far) and Impact Analysis, a table that lists the same upstream and downstream assets as rows instead of nodes on a graph. This is easier to scan, search, and sort when an asset has a large number of dependencies.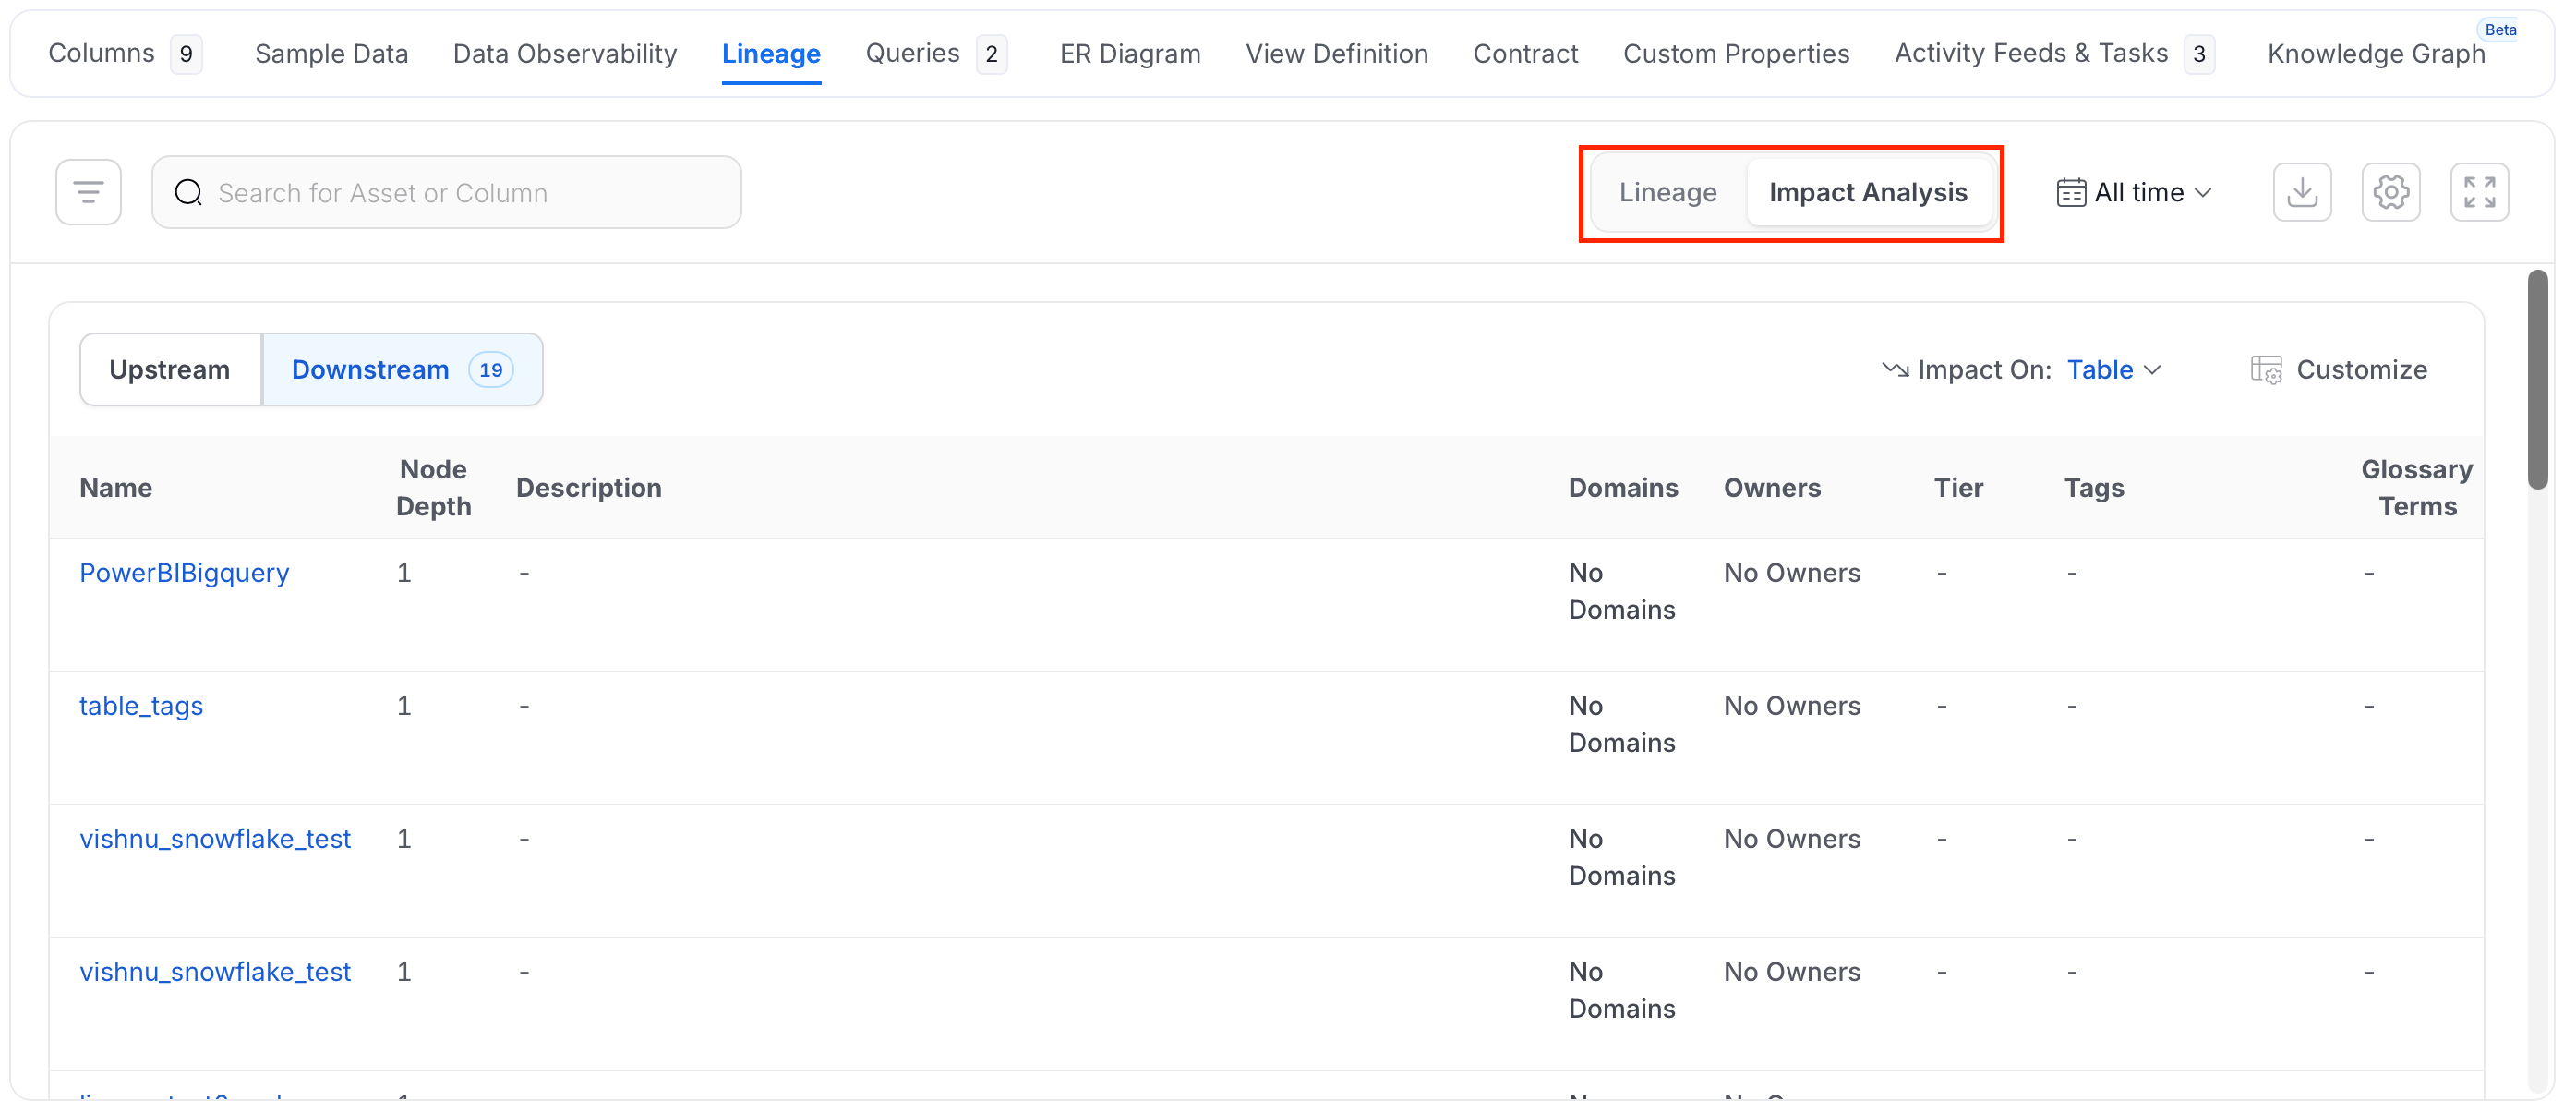
- Upstream / Downstream: Switch direction. Each option shows a count of how many assets lie in that direction.
- Impact On: Choose whether the table lists Asset Level impact (one row per table, pipeline, dashboard, and so on) or Column Level impact (one row per source-to-target column mapping).
- Customize: Choose which columns to show. Name (or Source/Impacted Column, in Column Level mode) always stays visible. Every other column can be toggled off.
Data Asset Details
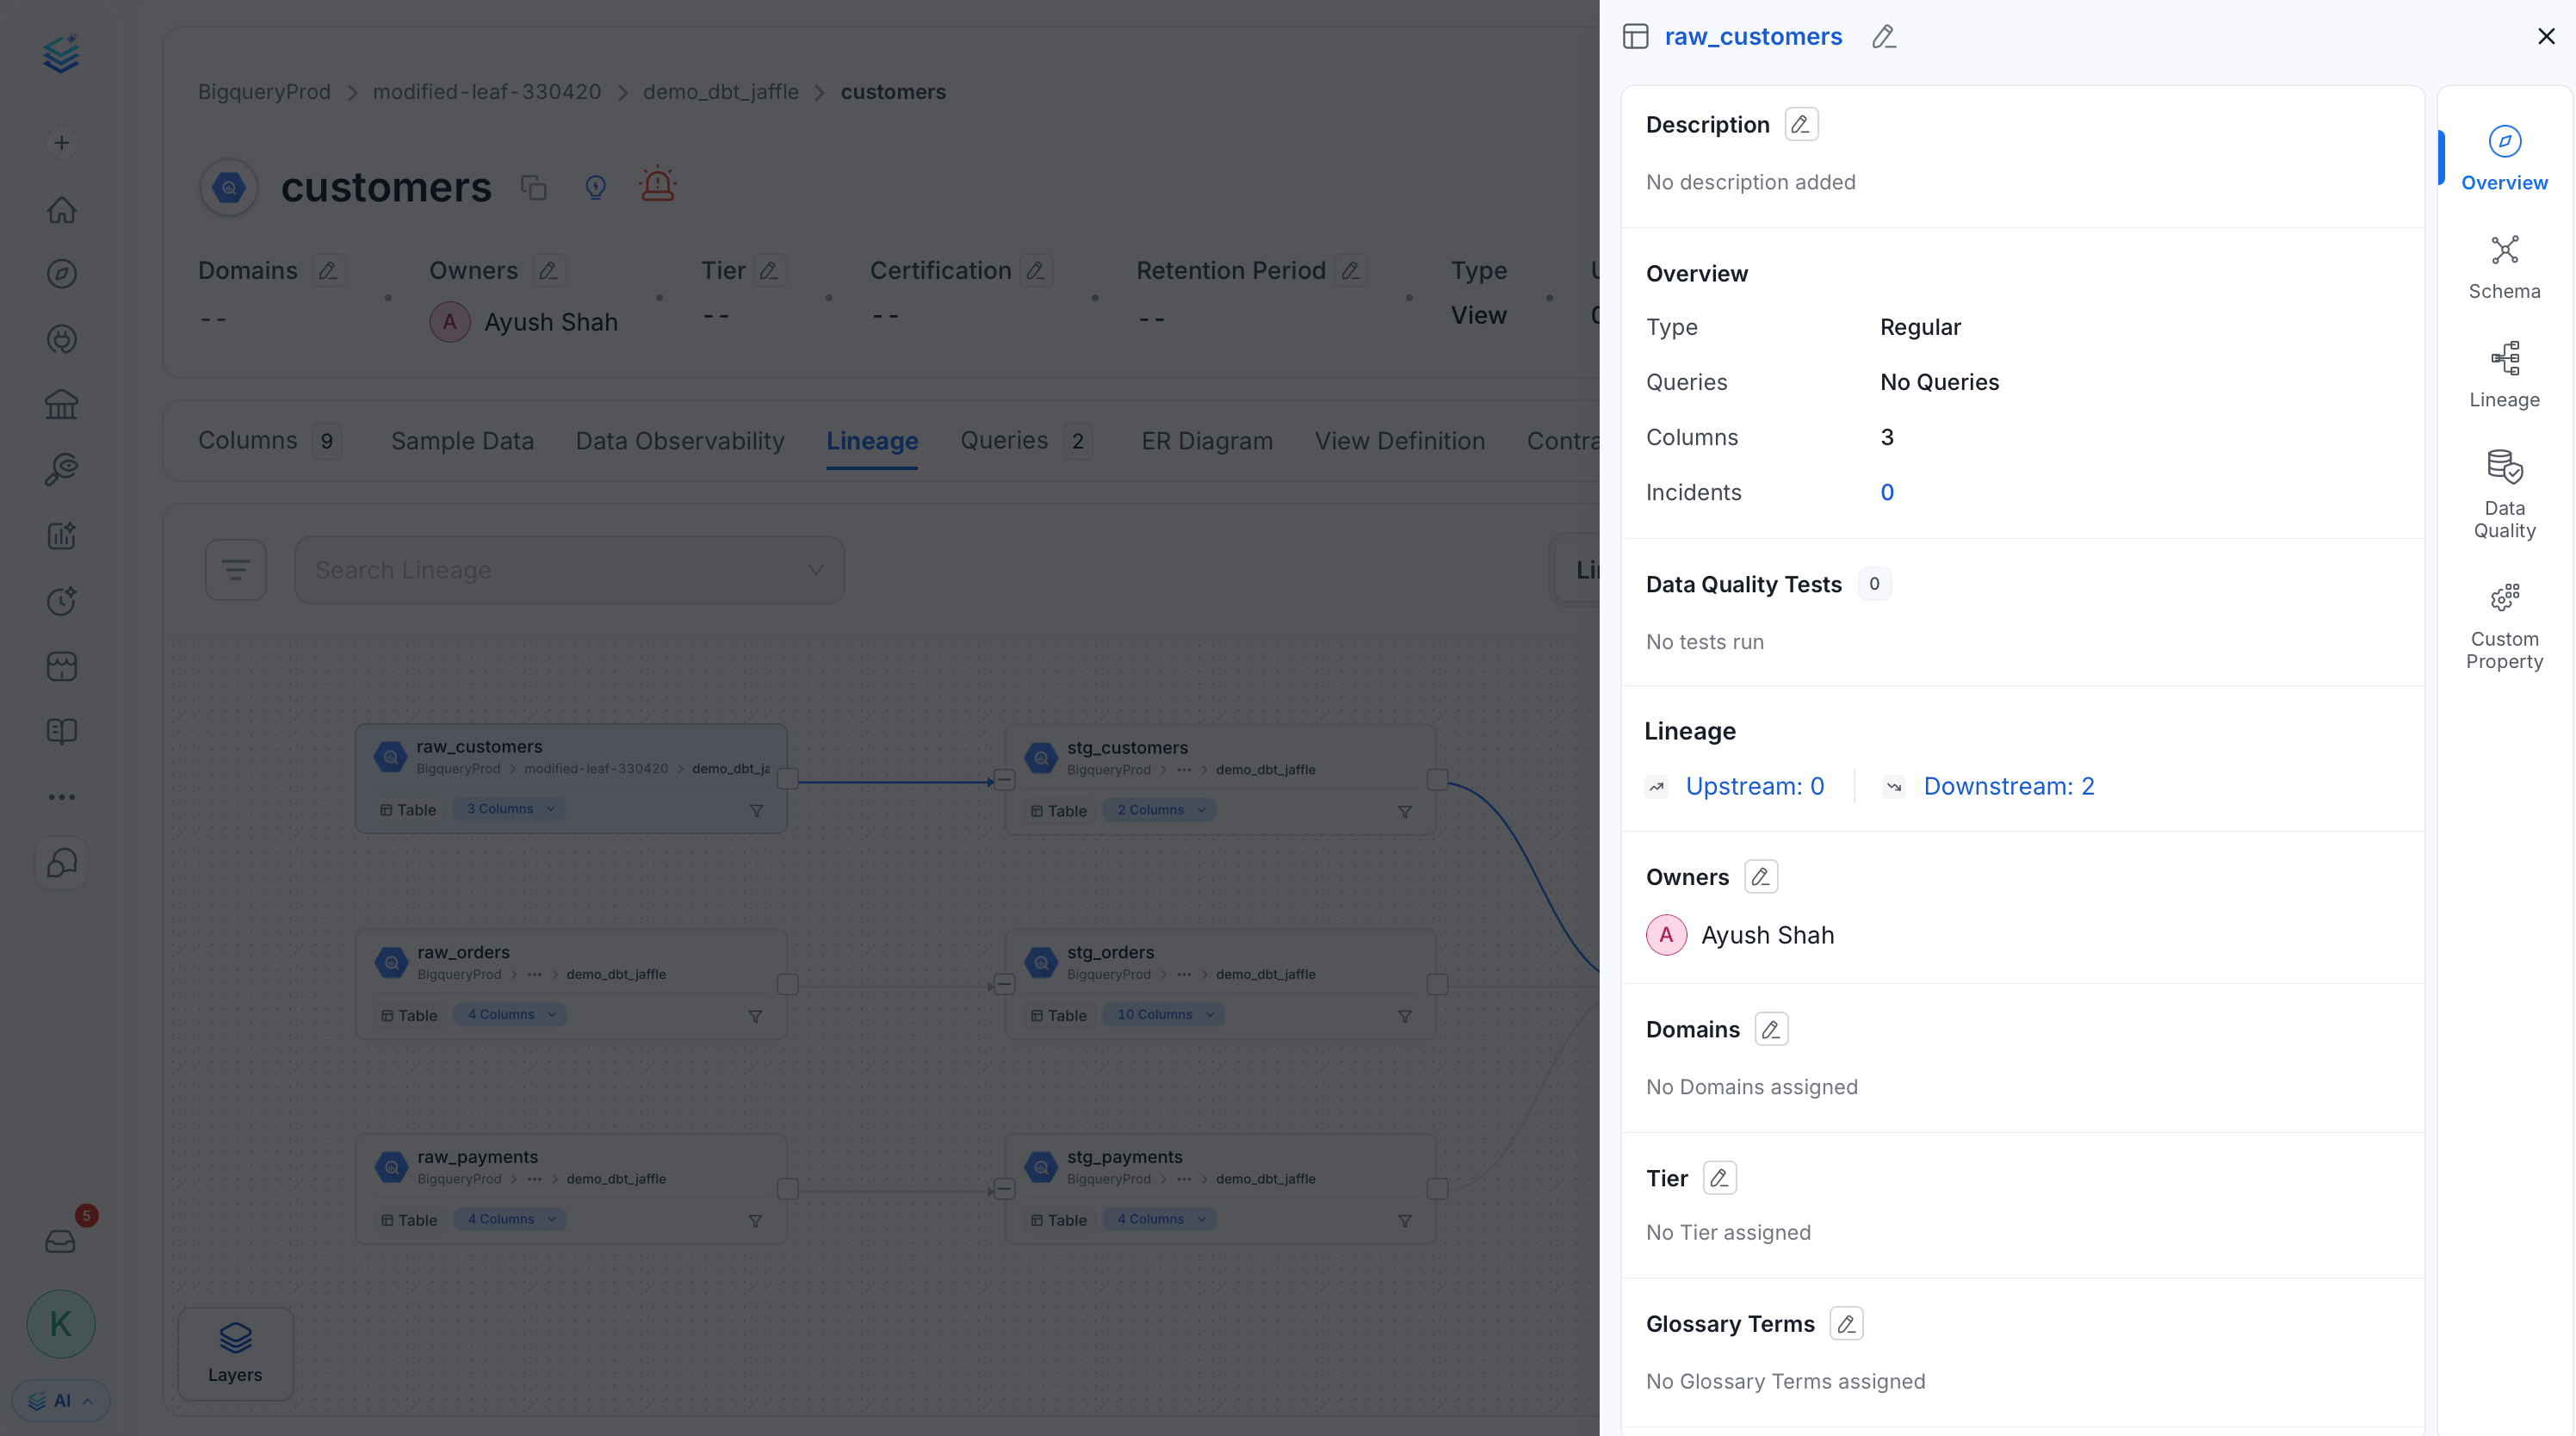
Click a data asset to view its details:- Source, Name, Description, Owner (team/user), Tier, and Usage information.
- Additional details based on the type of data asset (Table, Topic, Dashboard, Pipeline, ML Model, Container). For example, a table’s type, number of queries, and columns.
- Data quality and profiler metrics, including tests passed, aborted, and failed.
- Tags associated with the data asset.
- Schema details: column names, column types, and column descriptions.
Column-Level Lineage
Click a table to expand its list of columns and see column-level lineage.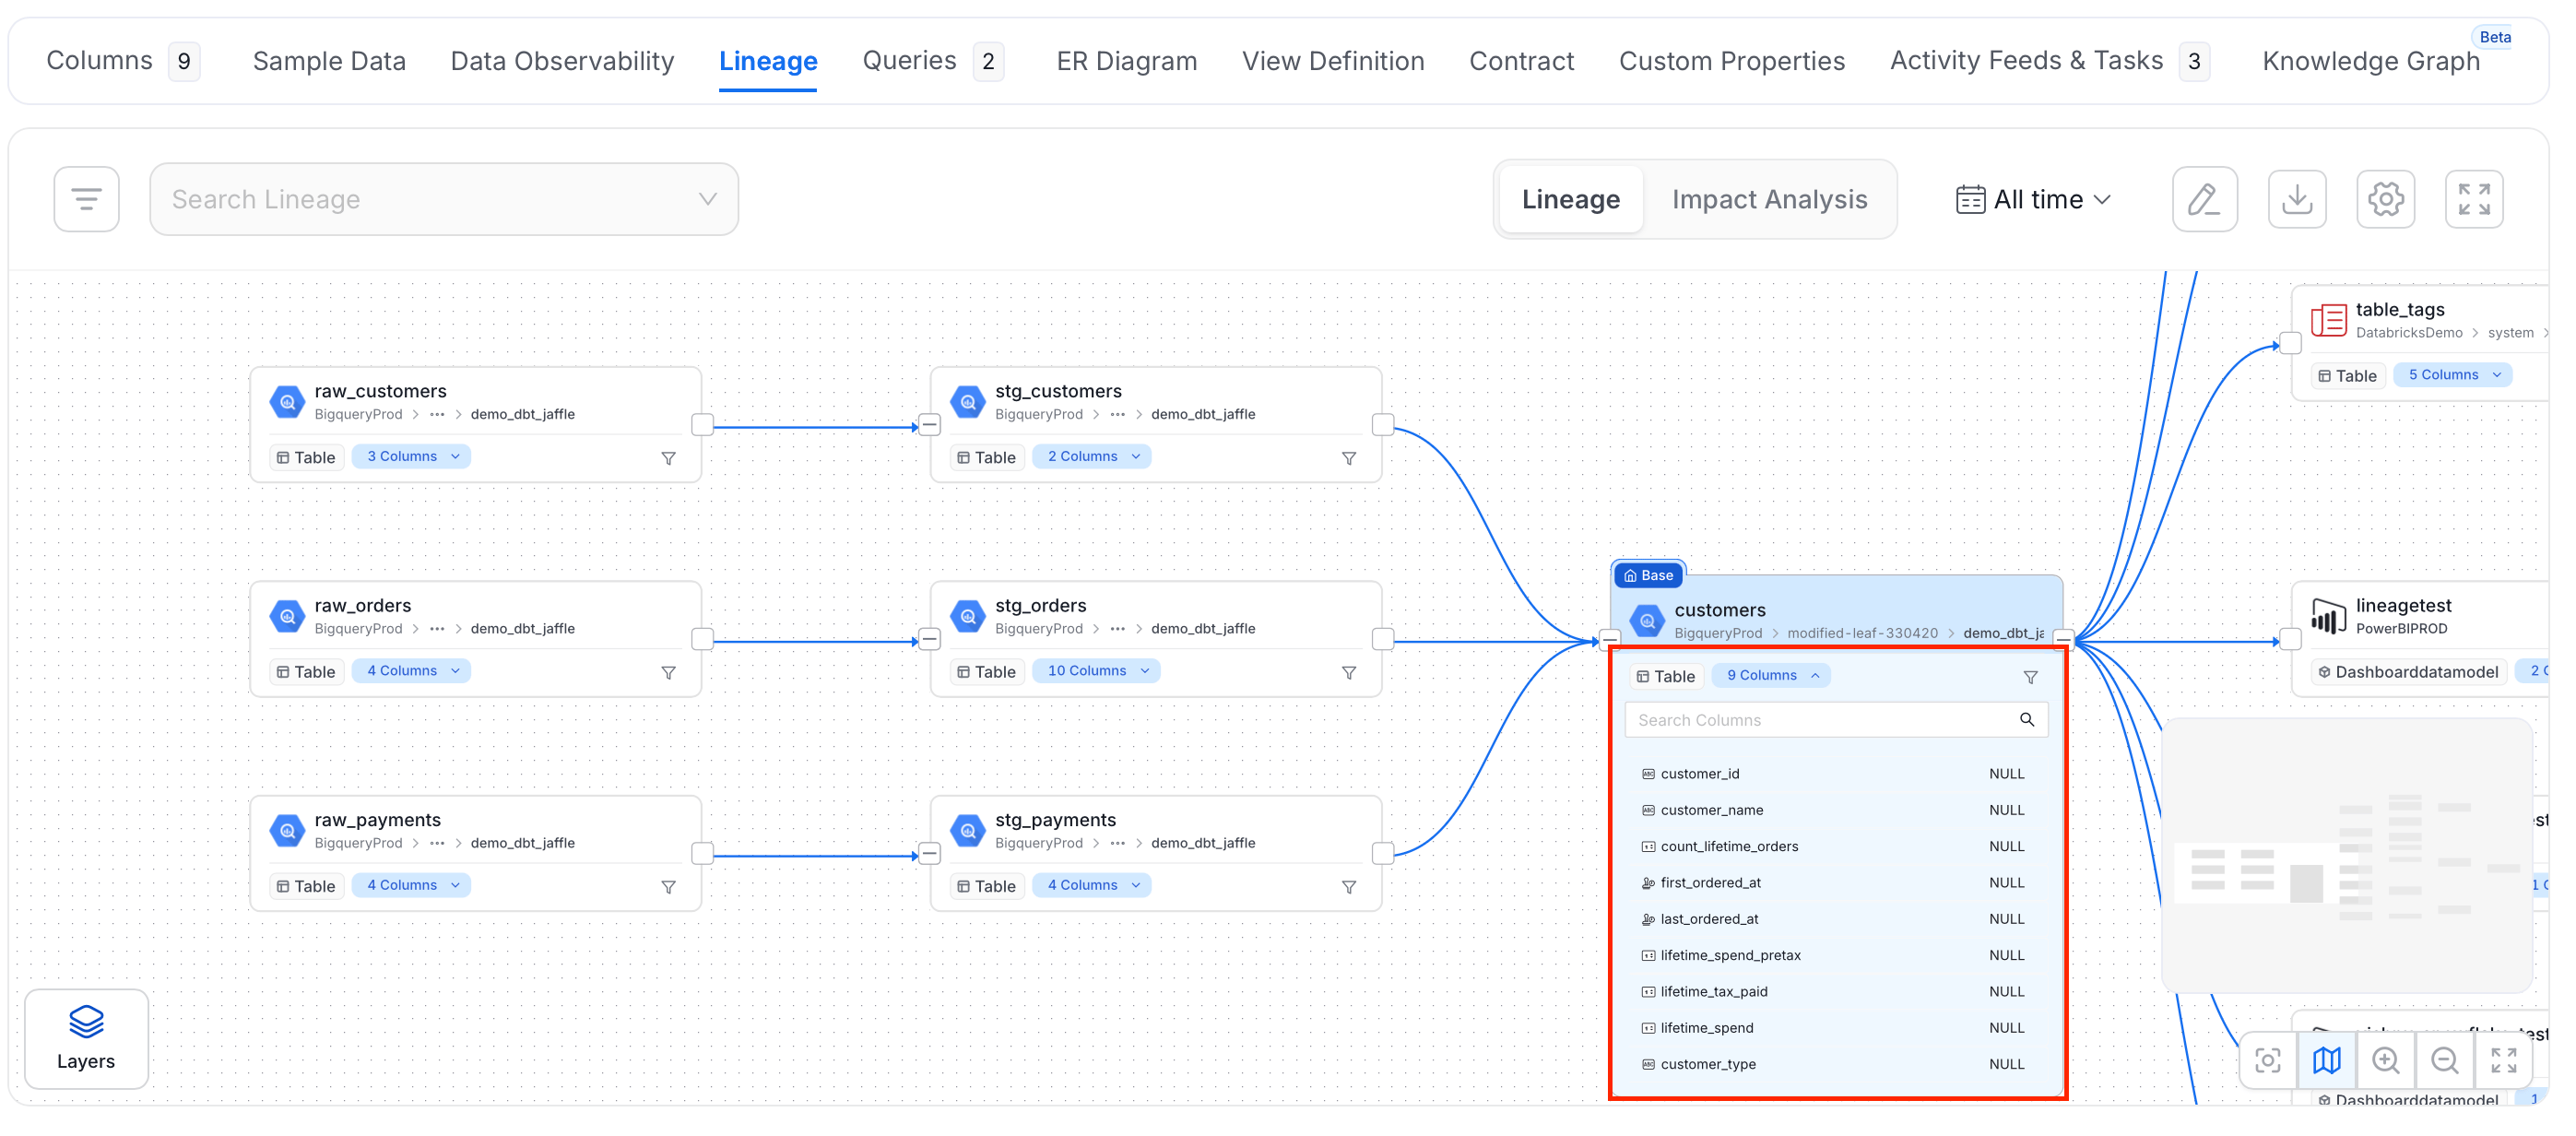
Pipeline and Dashboard Lineage
For Pipelines:- Lineage first comes from the metadata ingested from the databases.
- Setting up pipeline ingestion with a database service name links the pipeline to the database tables it reads from and writes to.
- If a pipeline creates the lineage, that shows up in the edge information too.
- Lineage first comes from the metadata ingested from the databases.
- Dashboard ingestion then adds the data models and charts, linking them back to the database tables they’re built on.
Lineage Layers
Use the Layers panel to choose how the lineage map groups your assets and how much detail it shows. The panel has two selectors:- Lineage Layer: Groups assets by service, domain, or data product.
- Level: Sets the amount of detail, from grouped nodes to individual columns.
Service Level View
Group assets by service to see how data moves across platforms such as Hive, Redshift, Power BI, and Tableau. This view connects ingestion, transformation, and consumption points, and gives you a system-level view of the end-to-end data journey.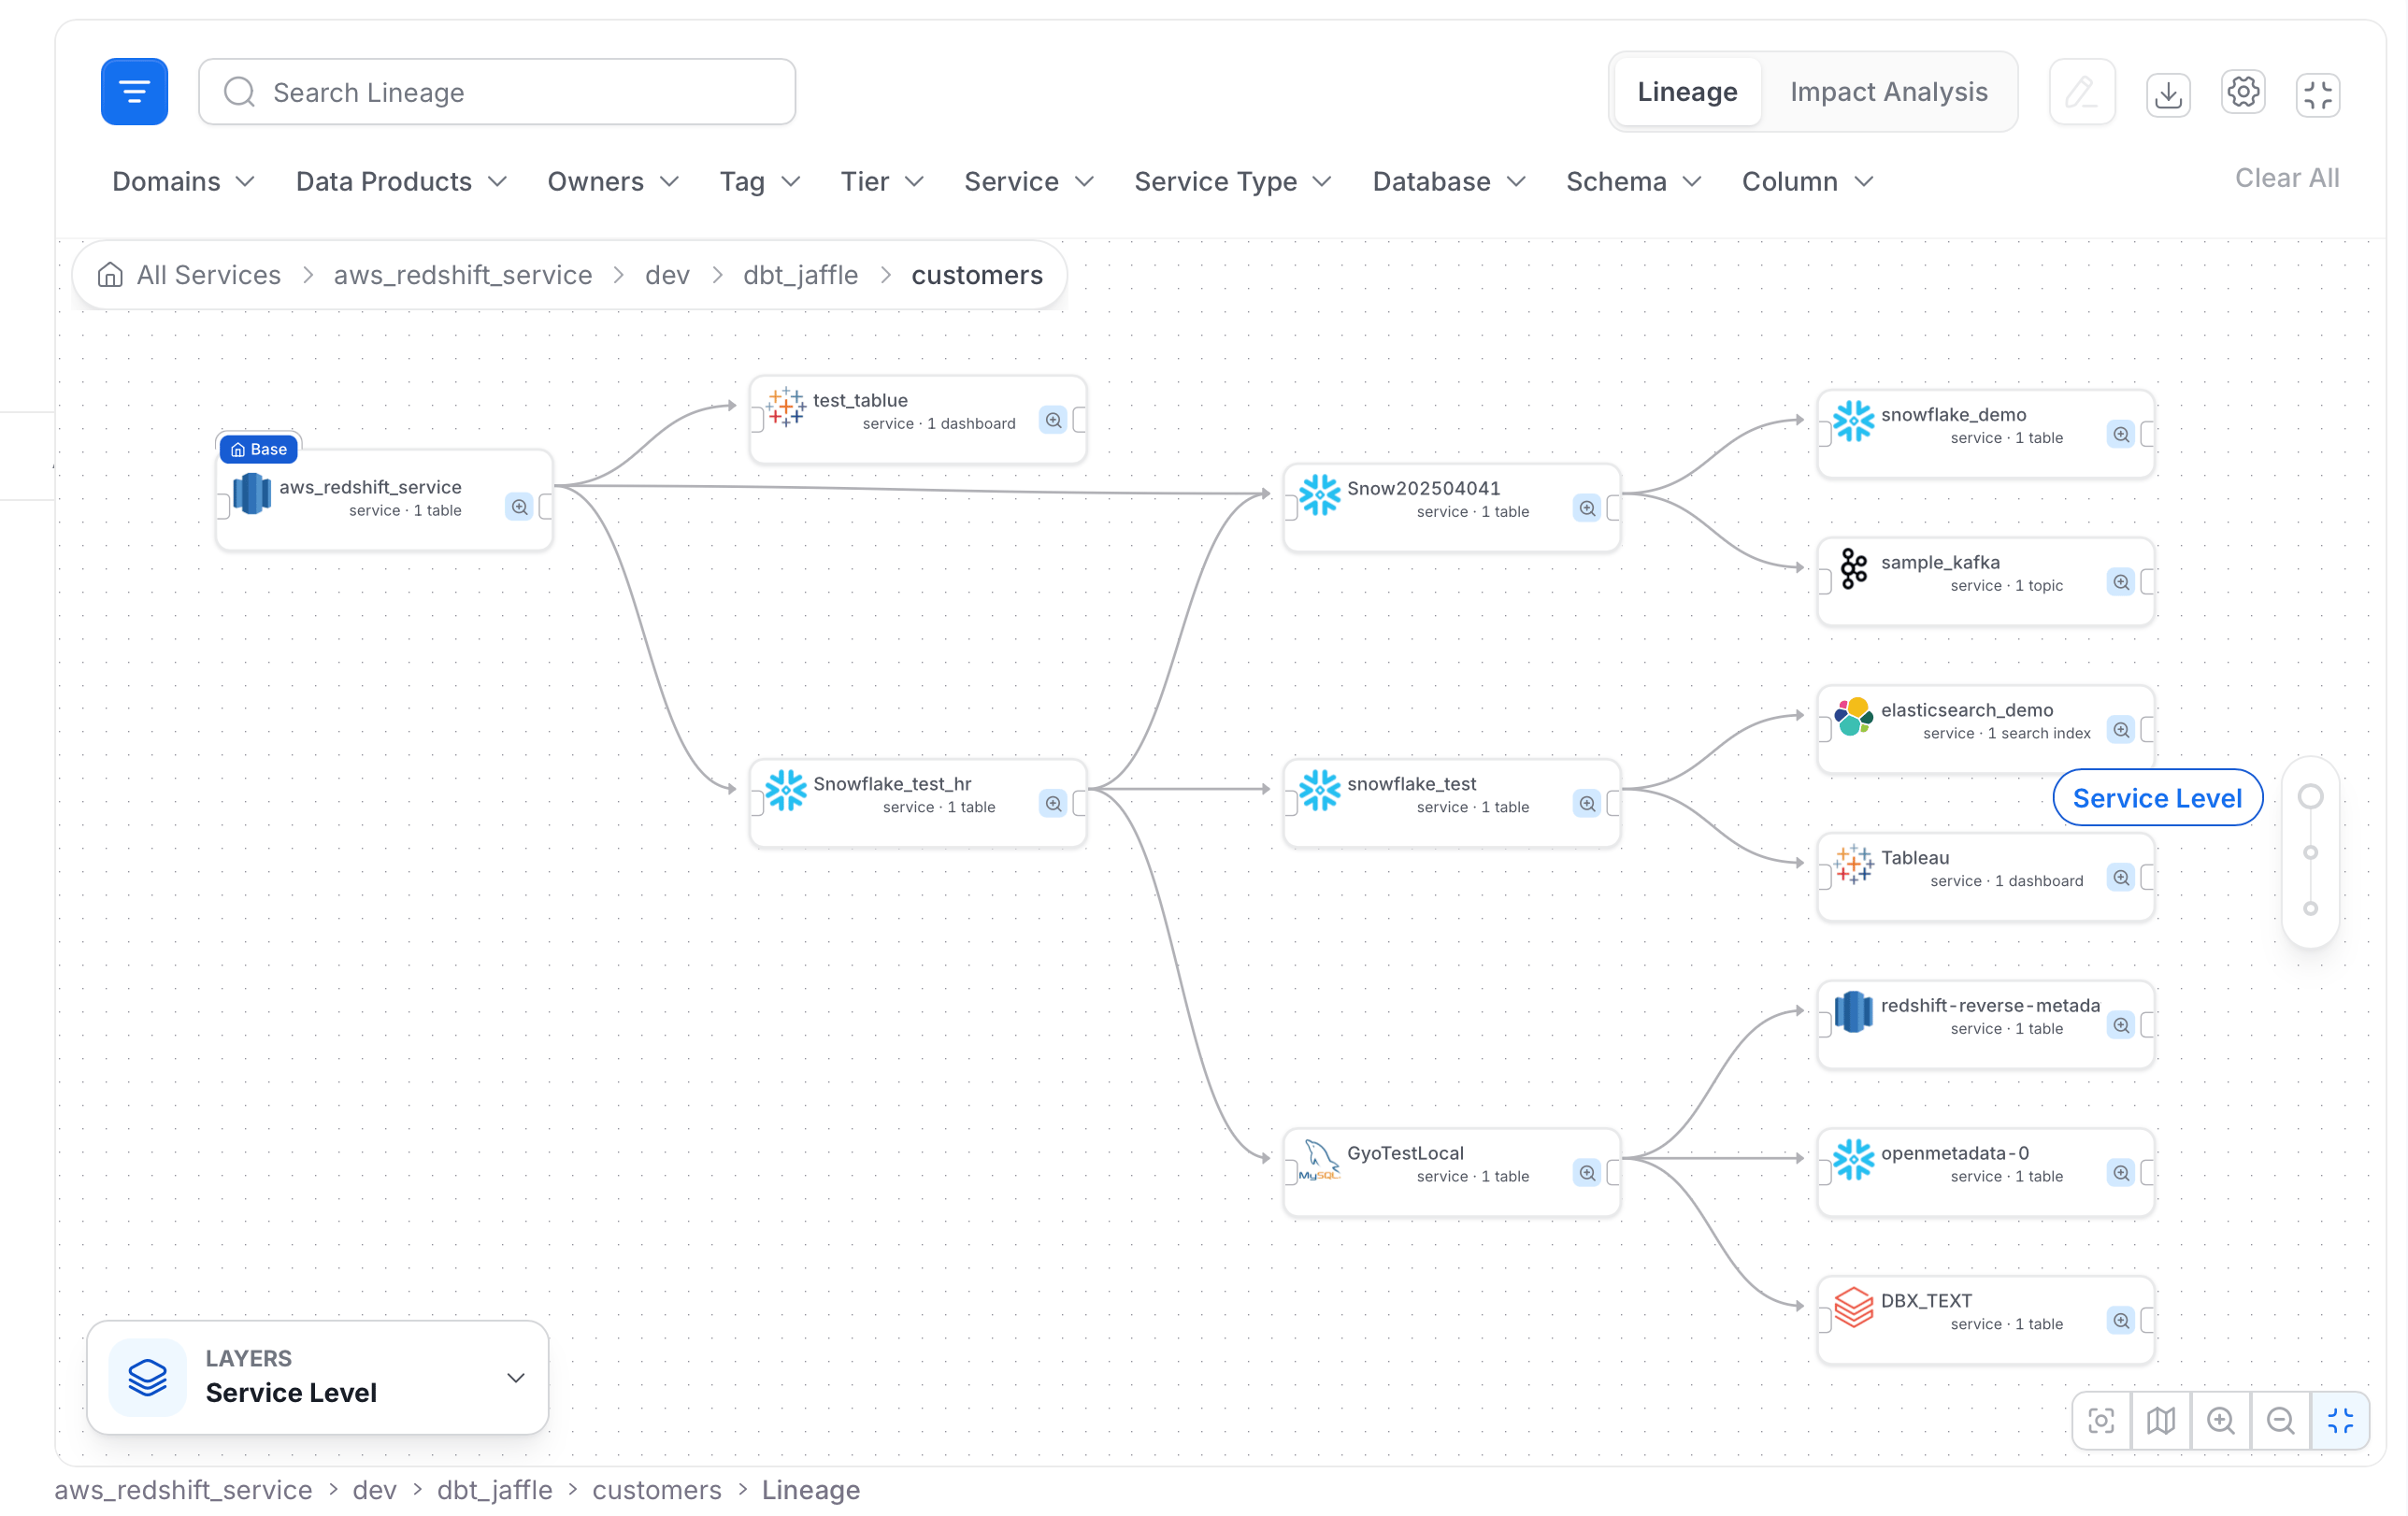
Domain View
Group assets by business domain, such as “Ecommerce” or “Customer Data.” This view connects technical assets to the business functions they support, and helps align lineage with governance.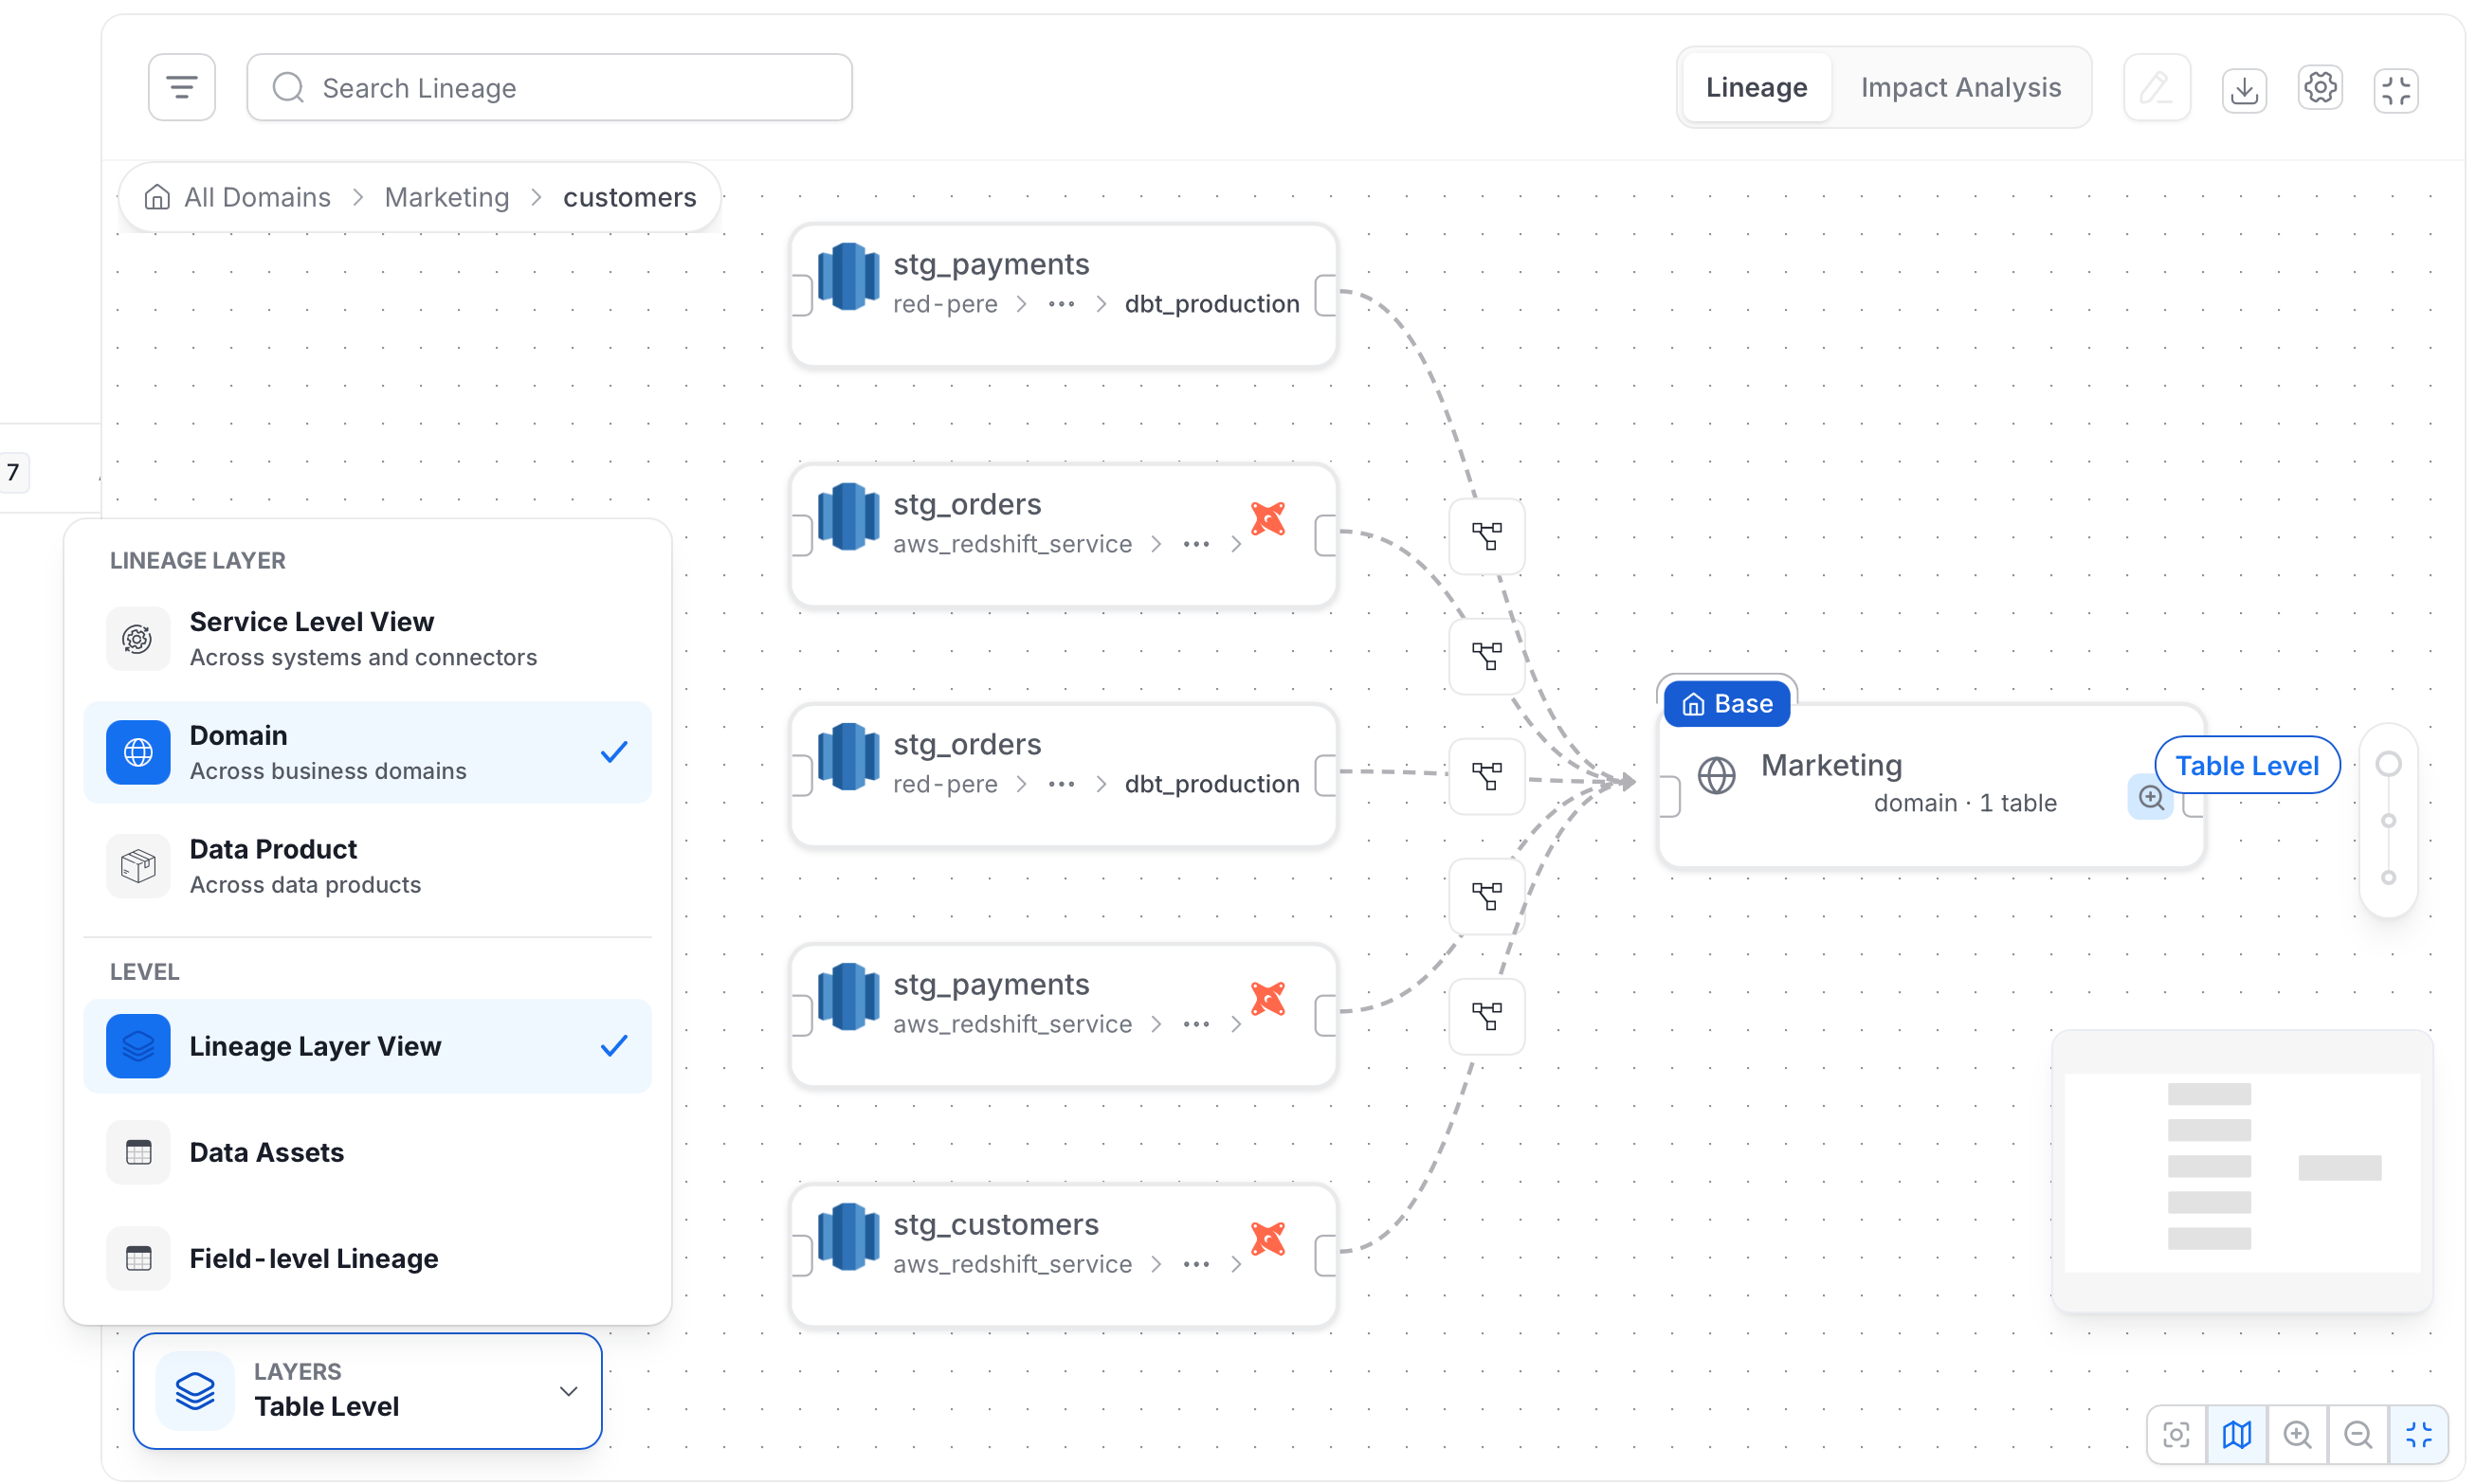
Data Product View
Group assets by data product, such as Customer Registry or Superstore. This view shows how curated, consumption-ready outputs relate to each other and where they come from.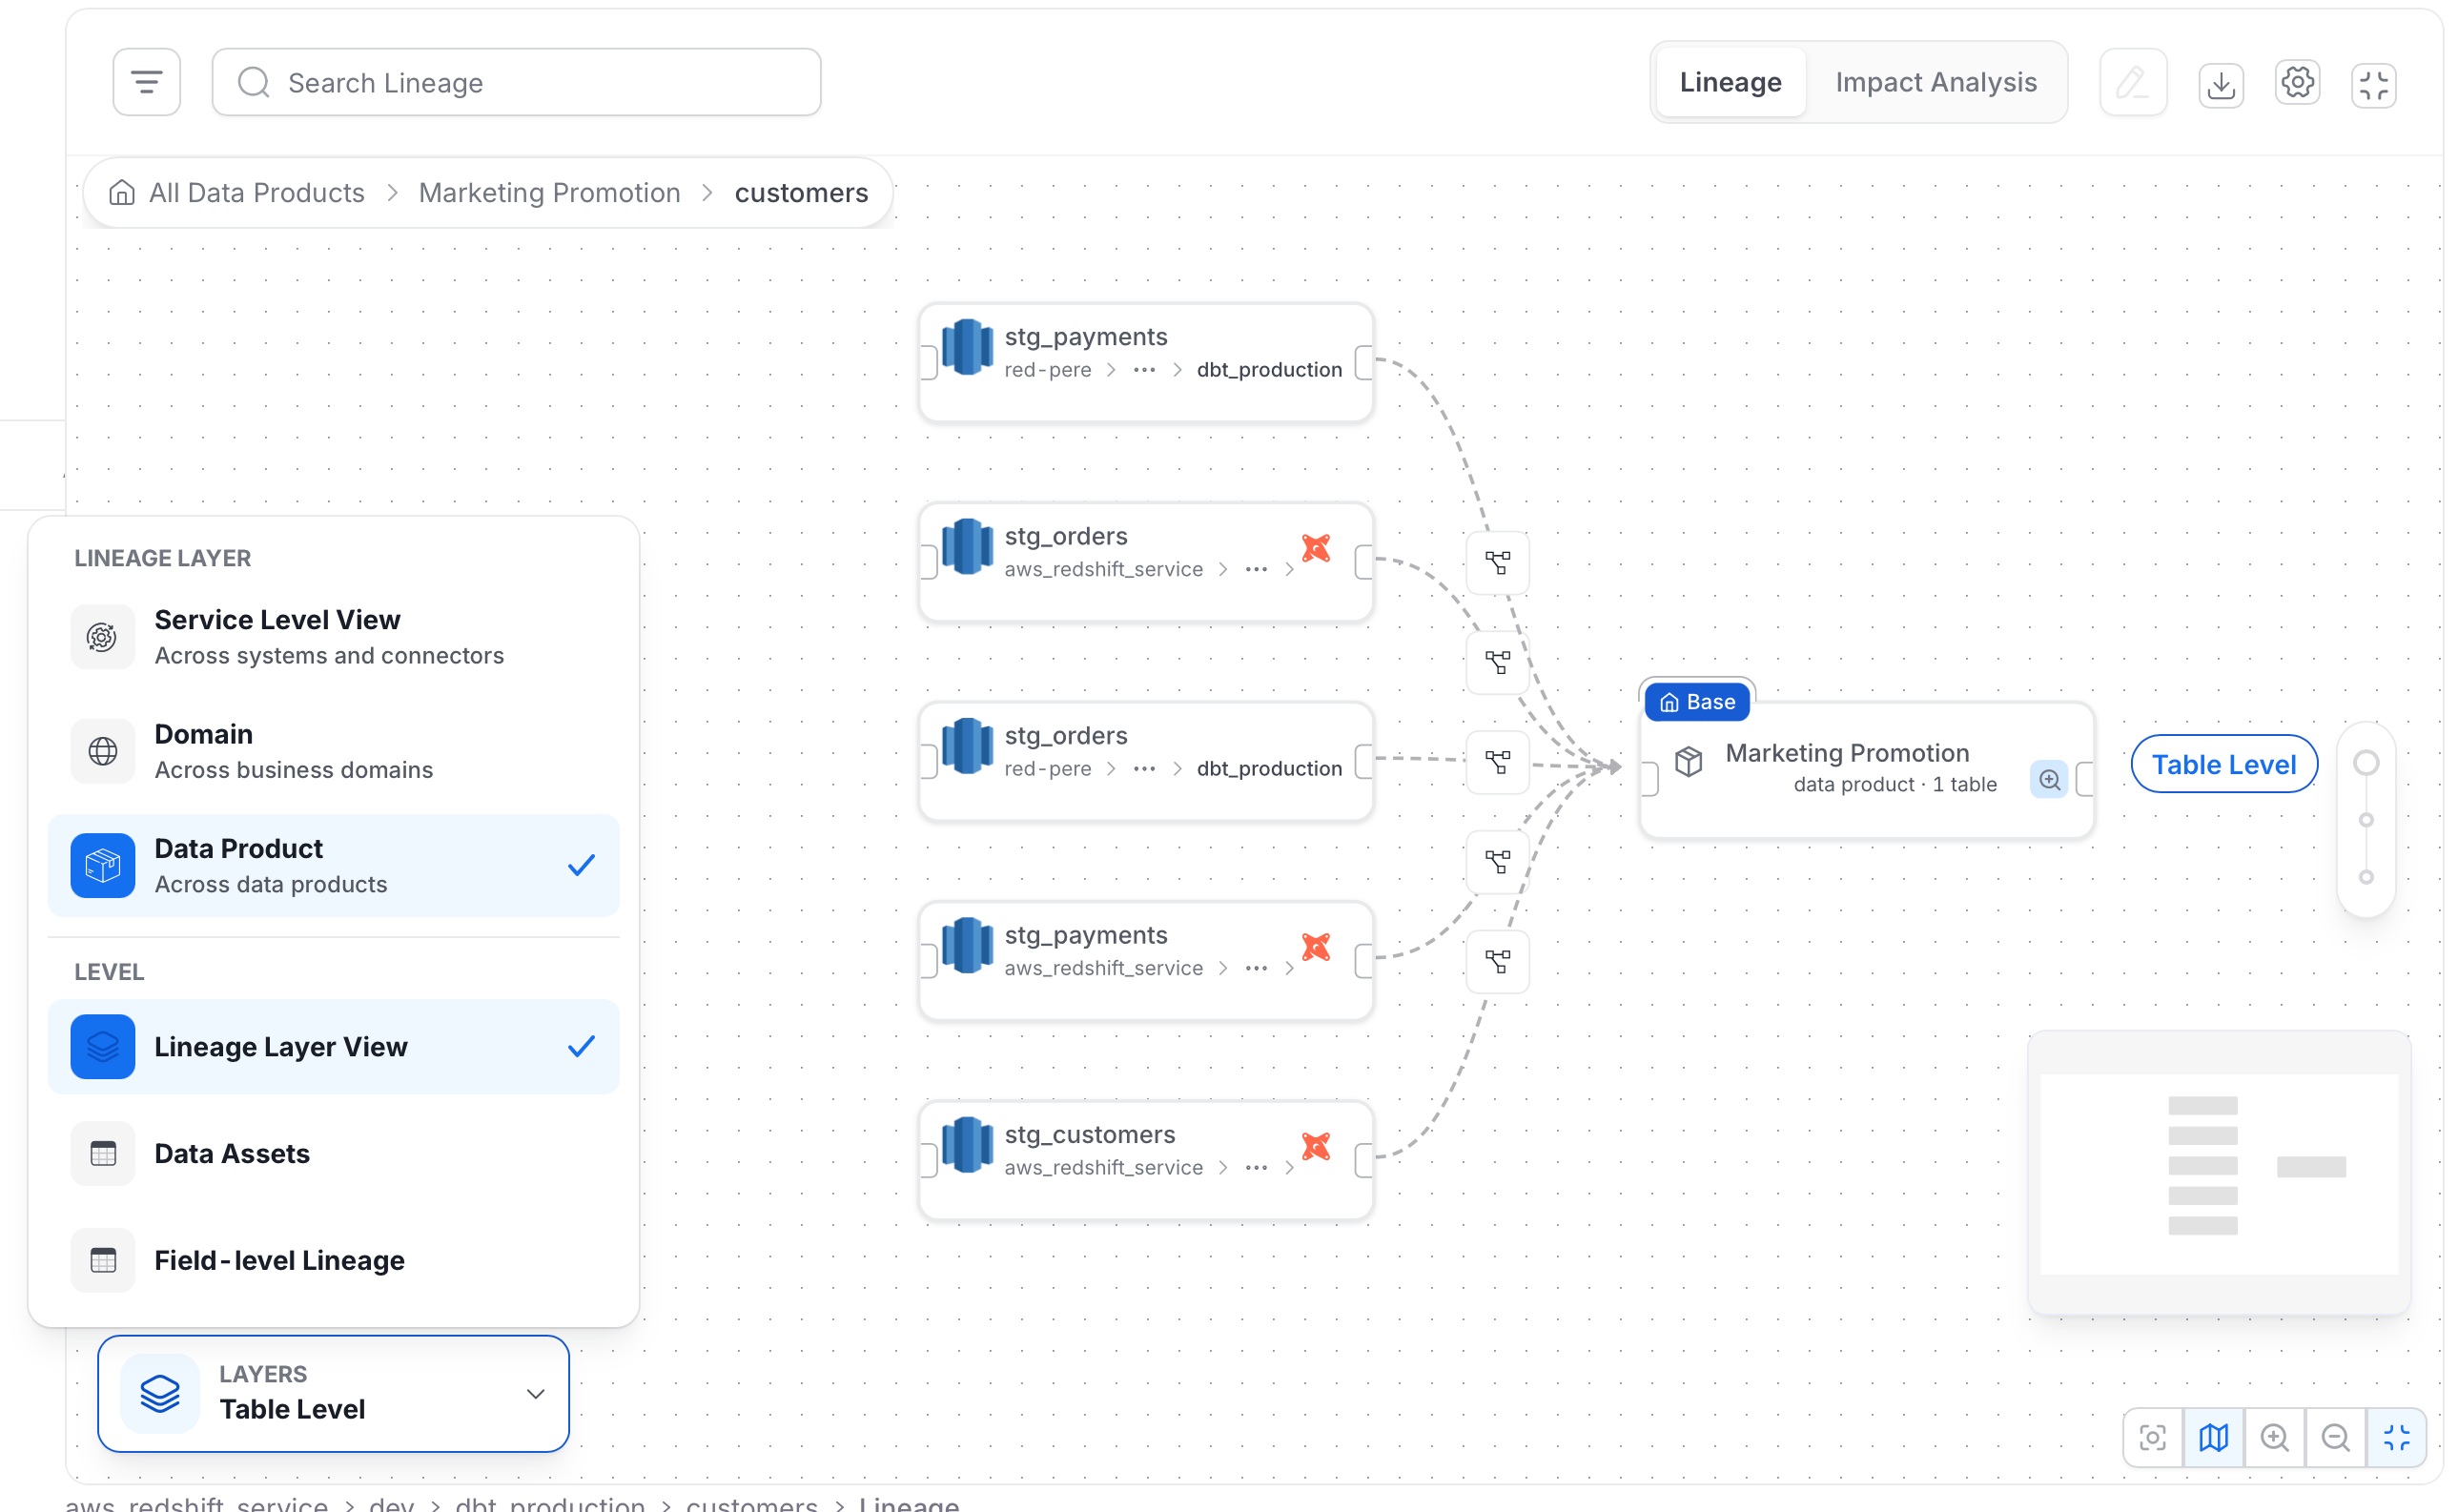
Field-level Lineage
Under Level, select Field-level Lineage to trace individual columns, such ascustomer_id or first_name, across tables and pipelines. For more information, see Column-Level Lineage.
Hierarchical Lineage Map
The lineage tab shows your lineage as a map you can zoom into. Instead of one large graph of every table, you start with an overview and drill down one level at a time.- Lineage Layer (what you group by): Choose how assets are grouped. Pick Service Level View, Domain, or Data Product.
- Level (how much detail you see): Choose how deep the map goes. Pick Lineage Layer View, Data Assets, or Field-level Lineage.
Choose a Layer and Level
- Open the Lineage tab of any asset.
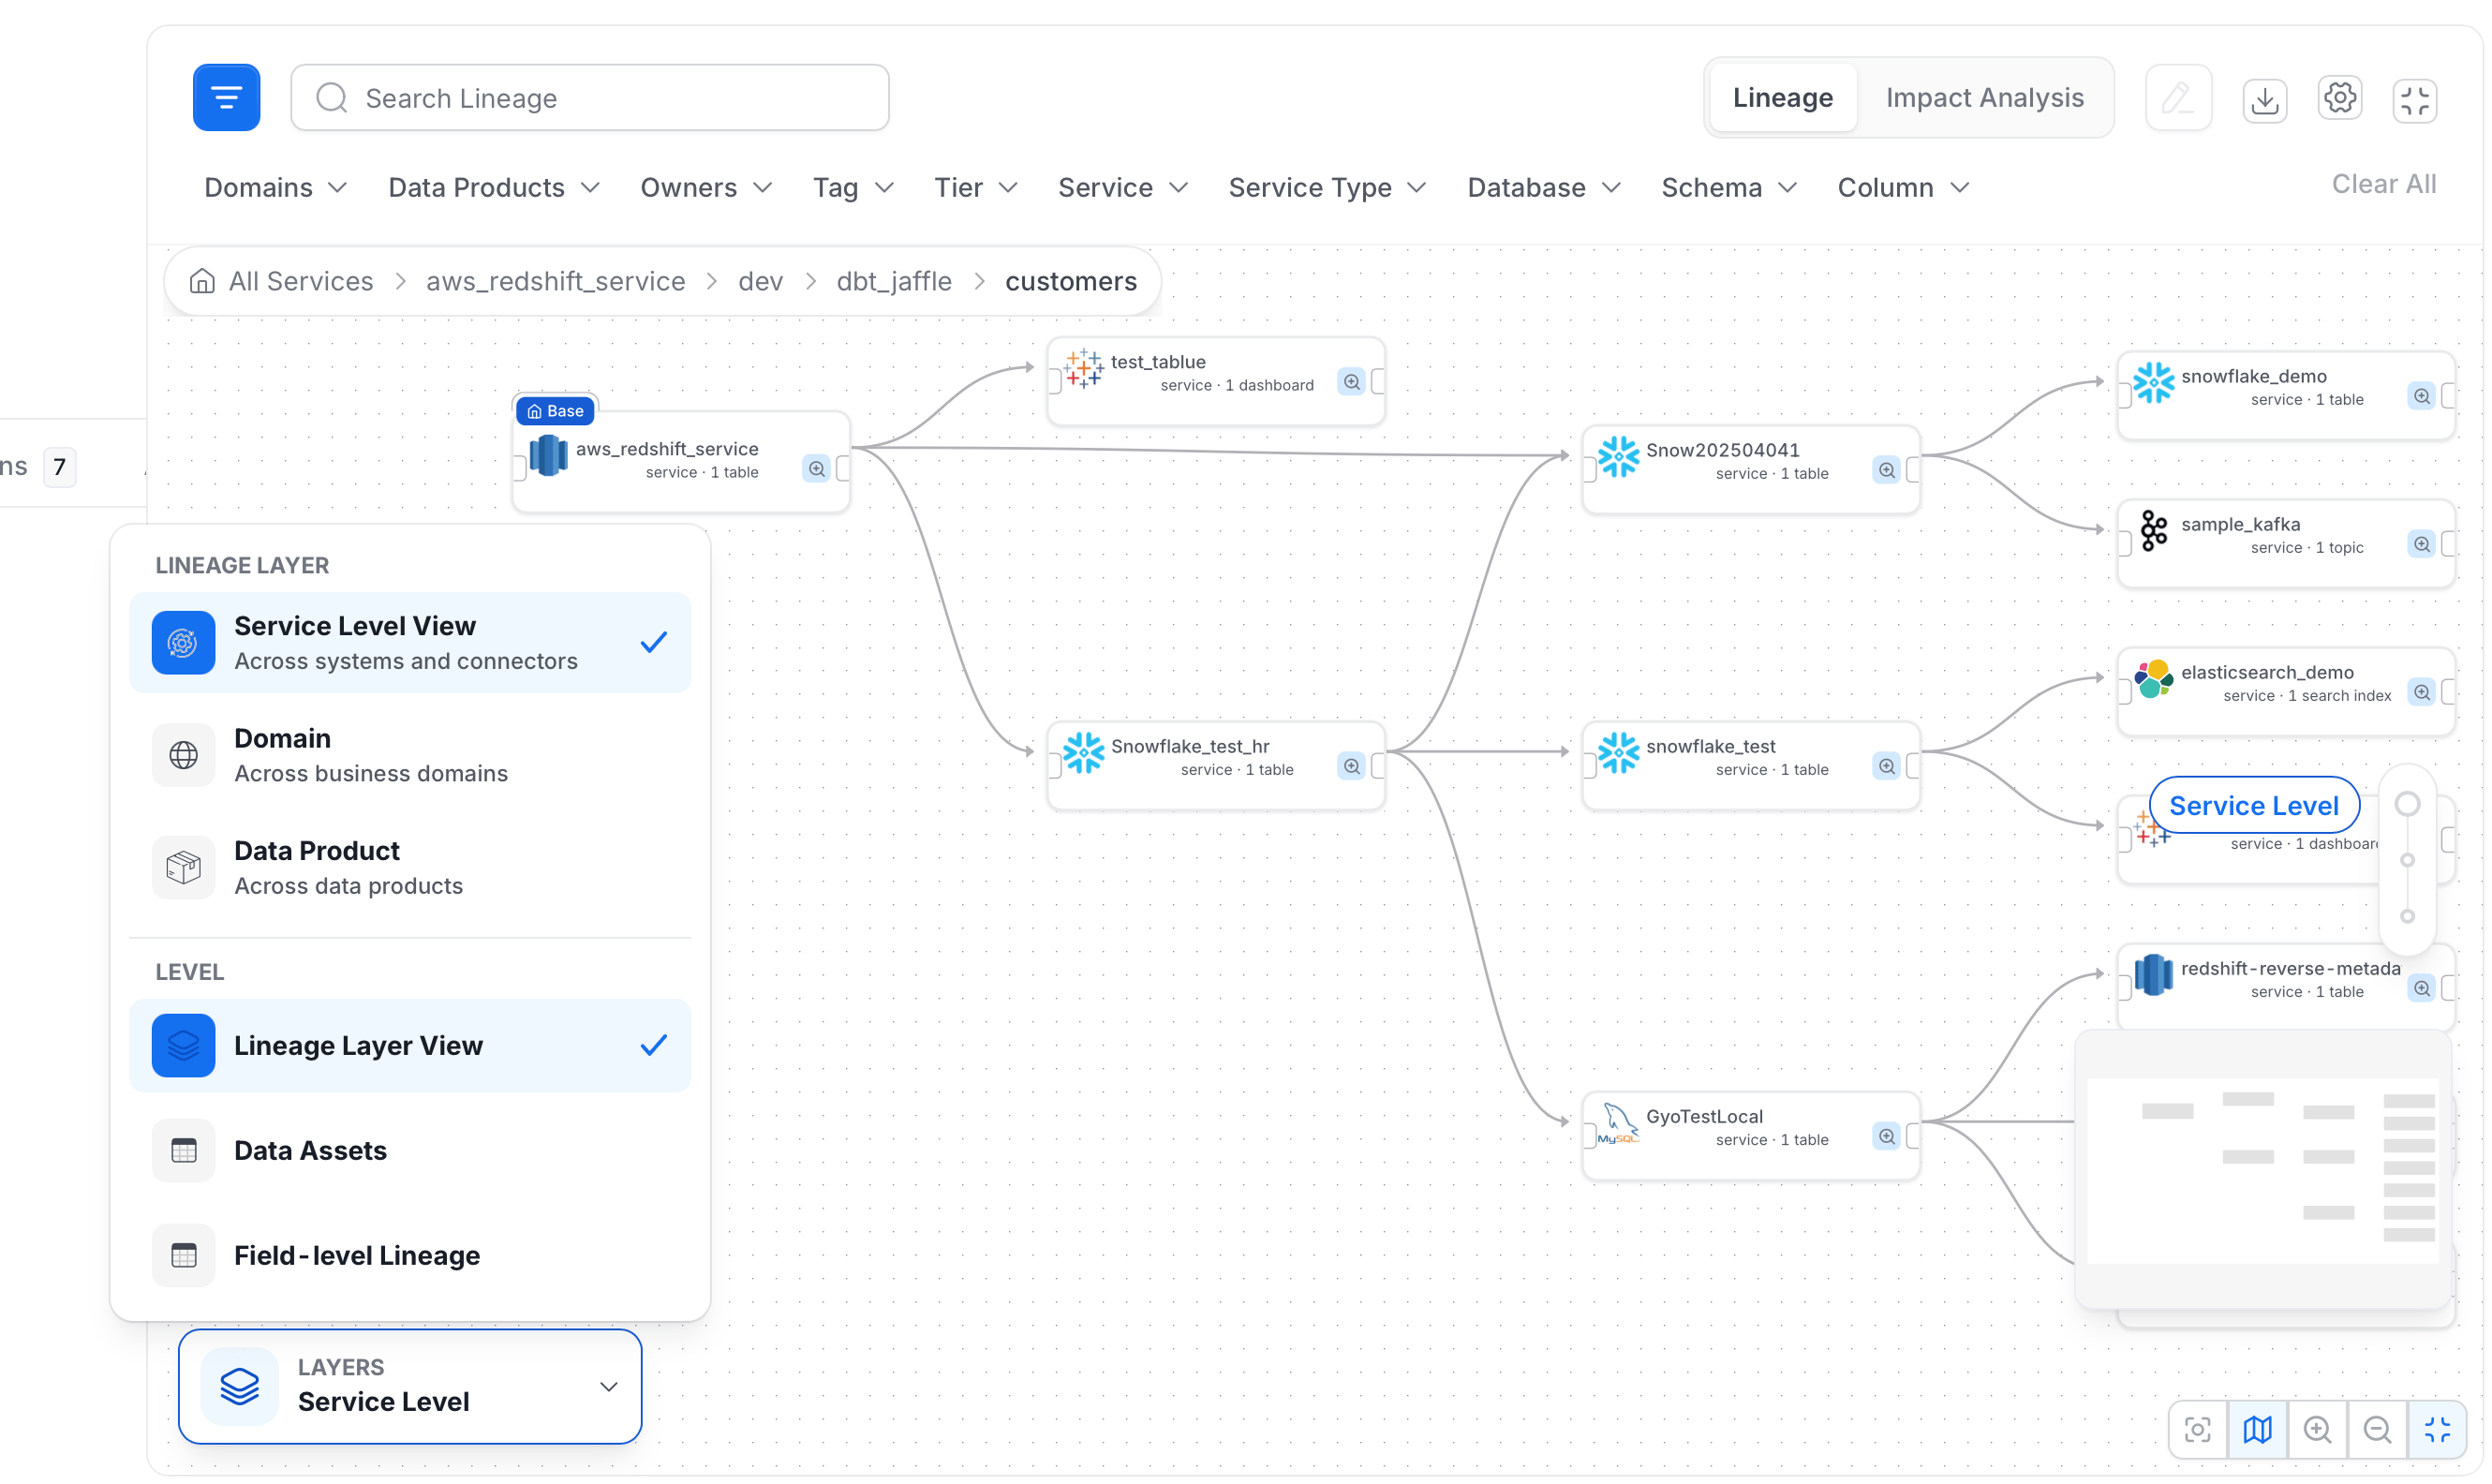
- Select the Layers button on the graph. It shows the current layer, for example Service Level.
- Under Lineage Layer, select how to group assets:
- Service Level View: Across systems and connectors.
- Domain: Across business domains.
- Data Product: Across data products.
- Under Level, select how much detail to show: Lineage Layer View, Data Assets, or Field-level Lineage.
Read the Map
The map shows the following elements:- Nodes: Each node is a group or an asset, depending on the current level. Group nodes show how many assets they hold, for example “service · 1 table”.
- Rollup edges: At the grouped level, a single line can stand for many asset-level connections. The line summarizes all the lineage between the two groups.
- Level label: The level you are viewing, such as Service Level or Table Level, is shown on the map.
- Highlight: Hover over a node to highlight the connected paths. Hover over a column at field level to highlight where it flows.
- Recenter: Use Recenter on base asset to return to the asset you started from.
Navigate the Map
Use these controls to move around the map:- Zoom: Scroll to zoom in or out.
- Pan: Drag the canvas to move around.
- Drill in: Select a group or asset to open the next level of detail. For example, select a service to see its tables, then select a table to see its columns.
- Level control: Use the level buttons on the map to switch between the layer, asset, and field levels. A deeper level is available only when the node you selected has something to show below it. Otherwise the tooltip reads Zoom In.
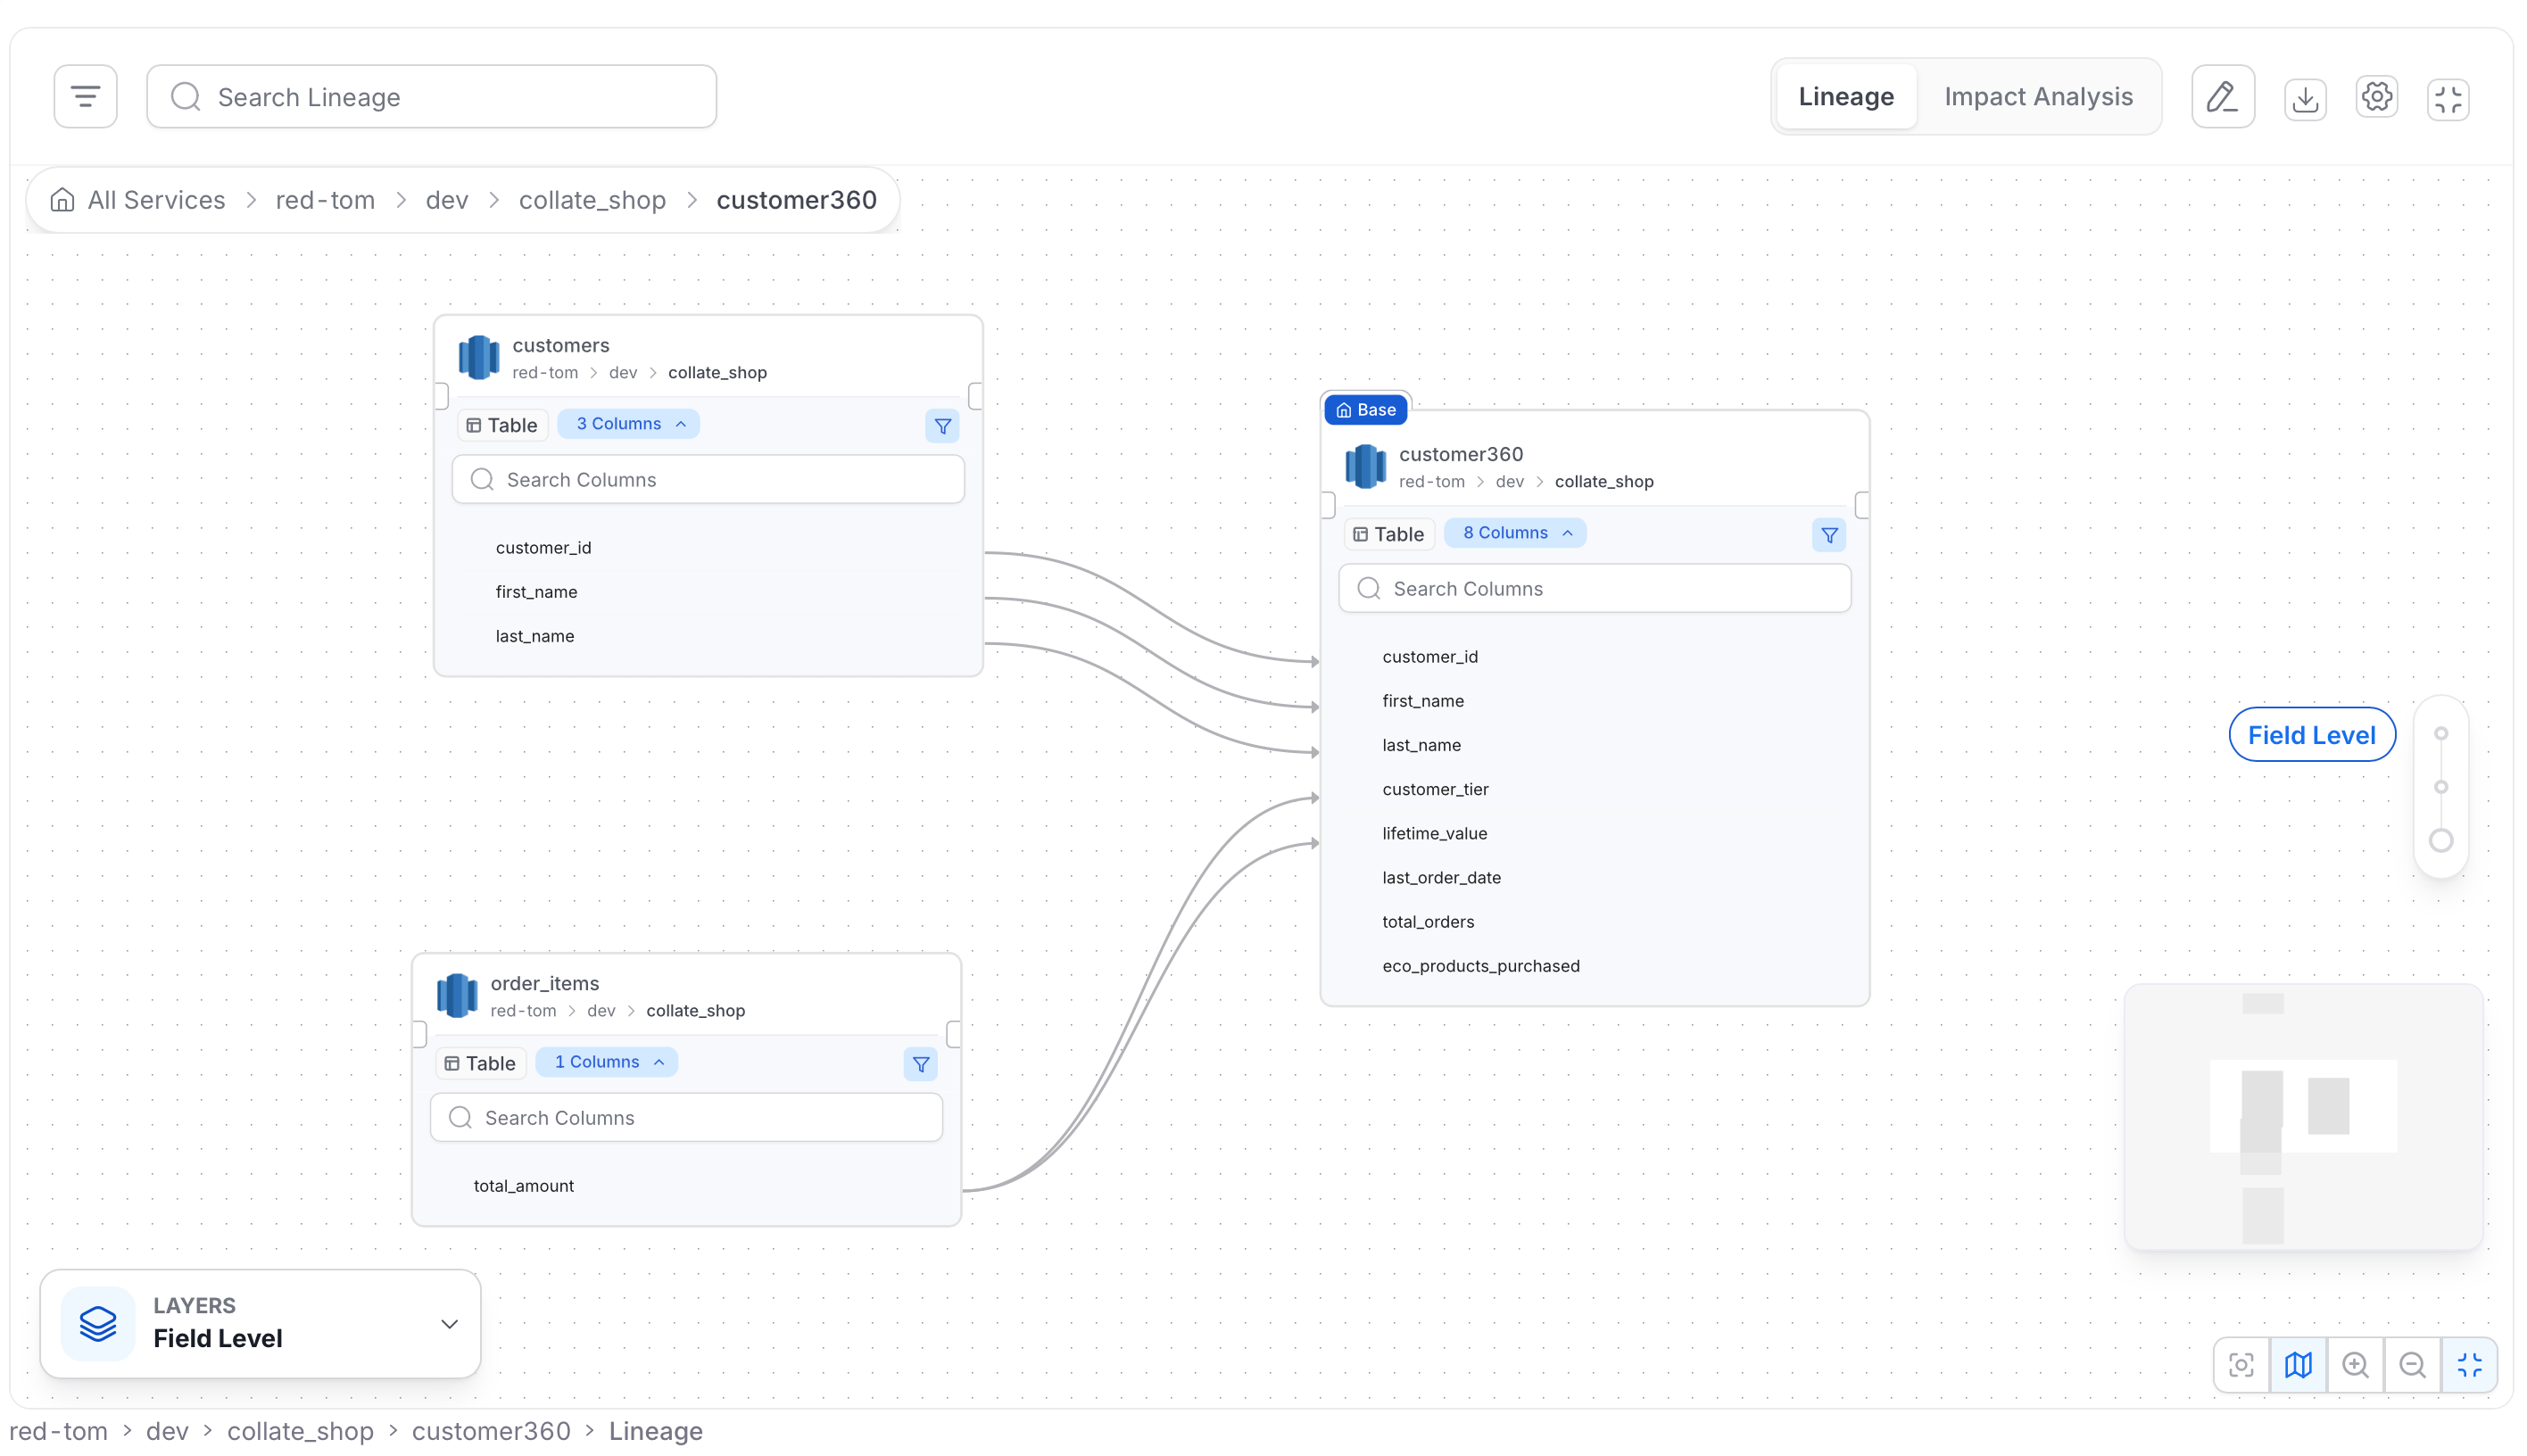
Field Level View
Choose Field-level Lineage under Level to see individual columns on the map.- Table cards: Each table shows its name, its location, and the number of columns it has.
- Column list: Expand a table to list its columns. Use Search Columns to find one.
- Column lines: A line connects a column to the columns it feeds. In the example below,
customer_id,first_name, andlast_namefromcustomersfeed the same columns incustomer360. - Filter: Select the filter icon on a table card to narrow the columns shown.
- Level label: The label next to the zoom control reads Field Level.
Use the Breadcrumb
The breadcrumb above the graph shows the path you took, for exampleAll Services > Snowflake > sales > orders.
- Select any step to jump back to that level.
- The first step, with the home icon, returns you to the top of the current layer.
- Long paths collapse automatically.
Large Graphs
If a level has more nodes than the map can show at once, it shows a sample and tells you:- A +N More badge shows how many nodes are hidden.
- A warning reads “Showing N of M assets” when the view is sampled.
Edit Mode and Impact Analysis
Edit mode and Impact Analysis work as follows:- Switching to edit mode turns off the level buttons and breadcrumb. Save or cancel your edits first, then navigate.
- Use the Impact Analysis view for a table of upstream and downstream assets. It lists the upstream and downstream assets in a table.
How Column-Level Lineage Works
Explore and edit the rich column-level lineage.