
Explore Data Assets
The data asset details page displays the Source, Owner (Team/User), Tier, Type, Usage, and Description on the top panel.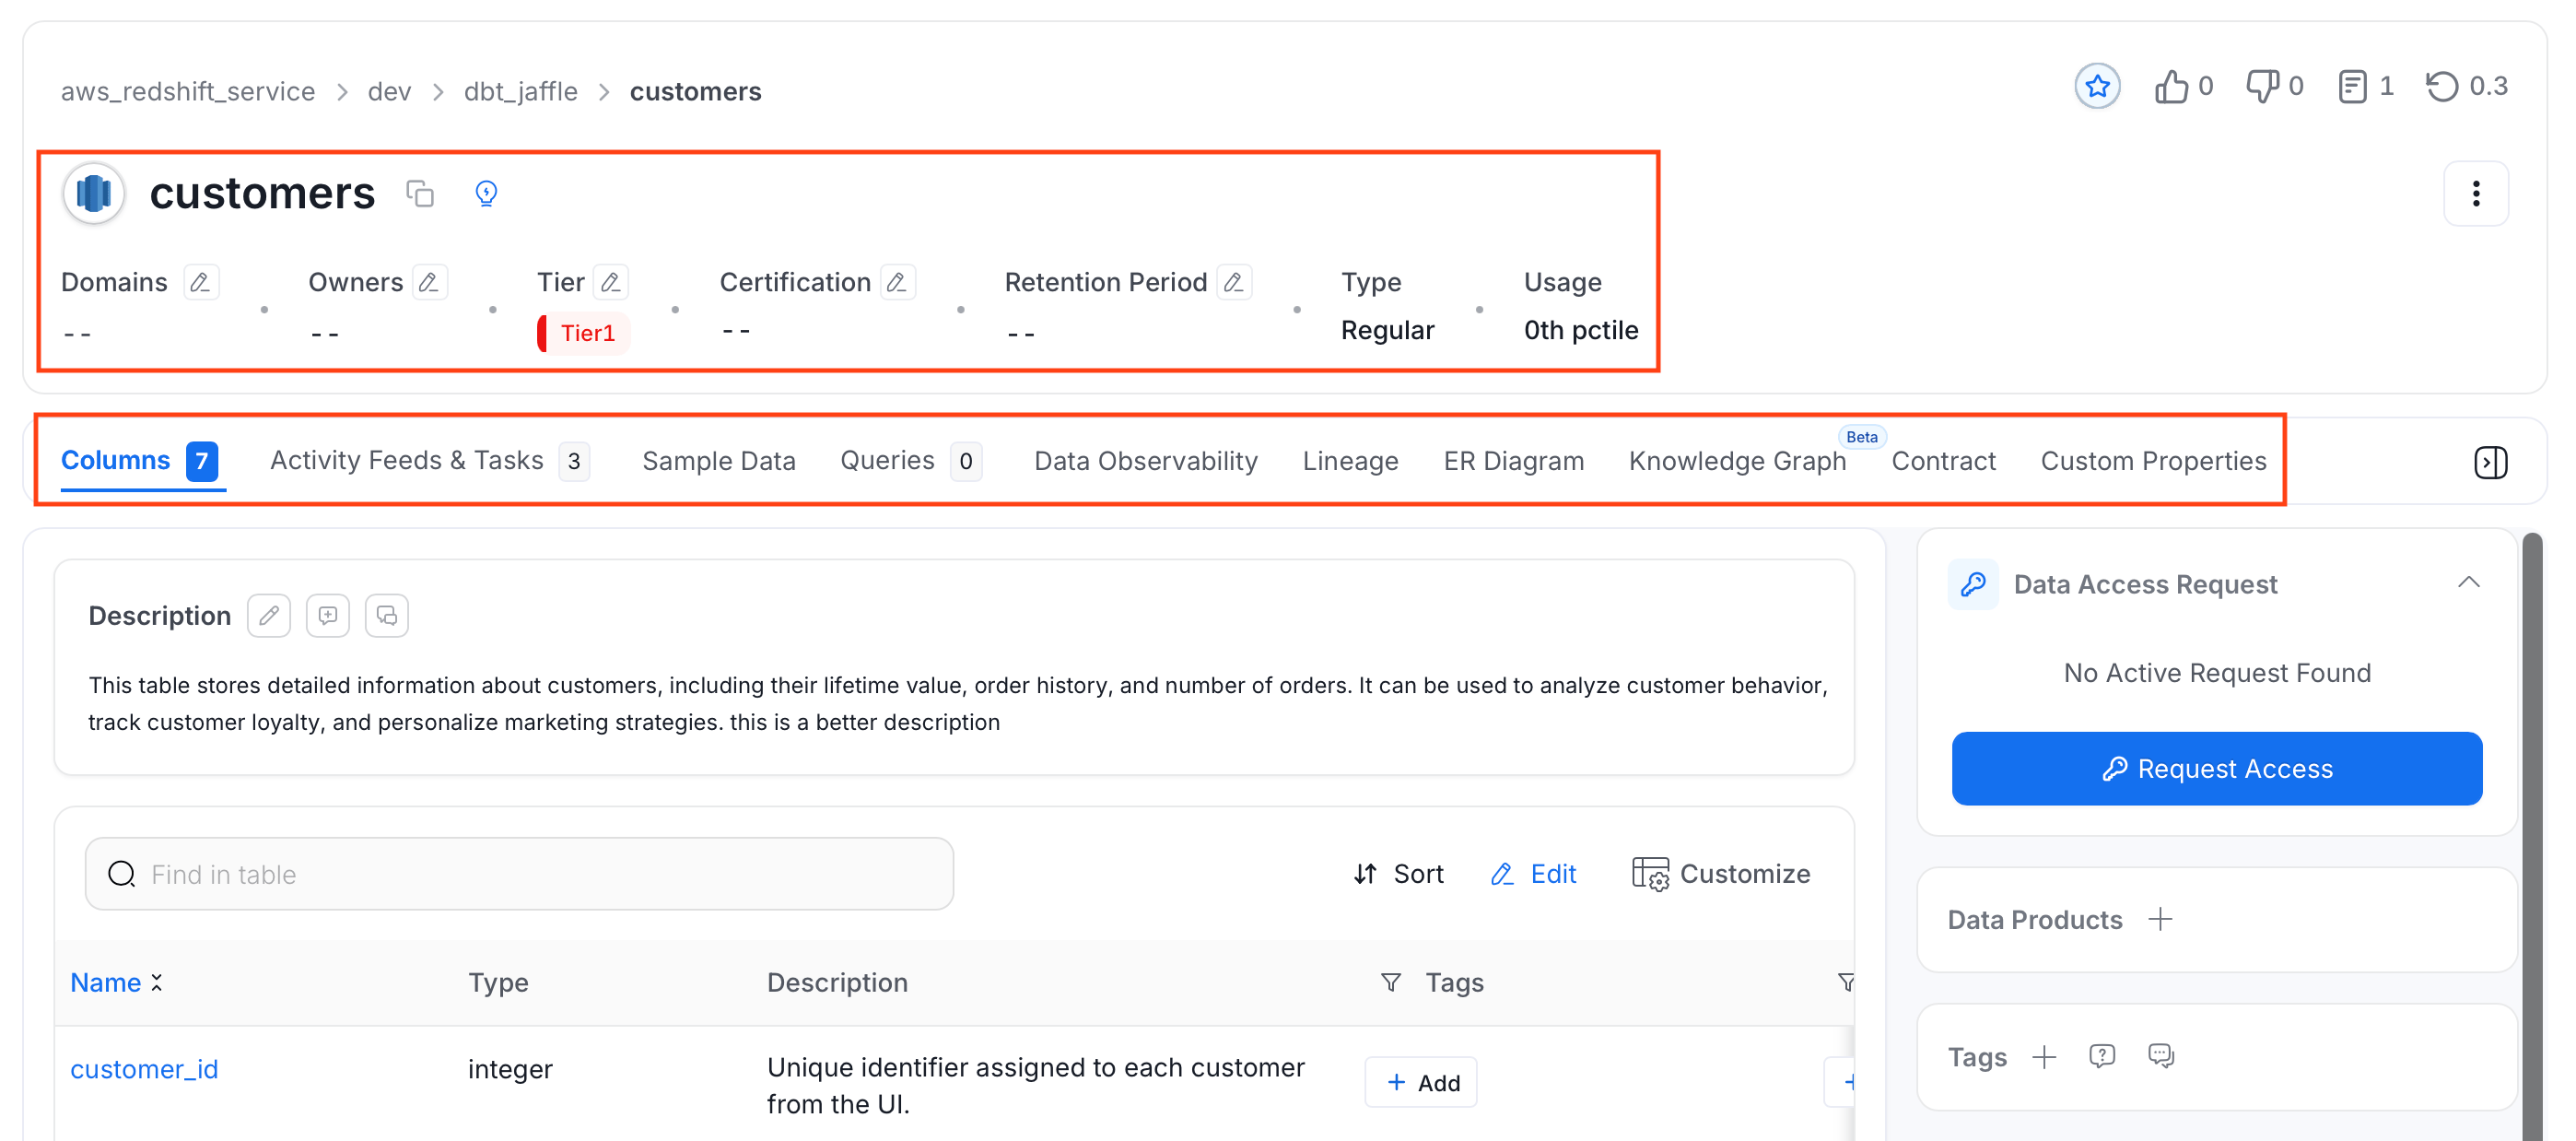
Access Data Asset Details Page
To access a data asset details page, in the left navigation menu, click Explore and select an data asset to view its details page.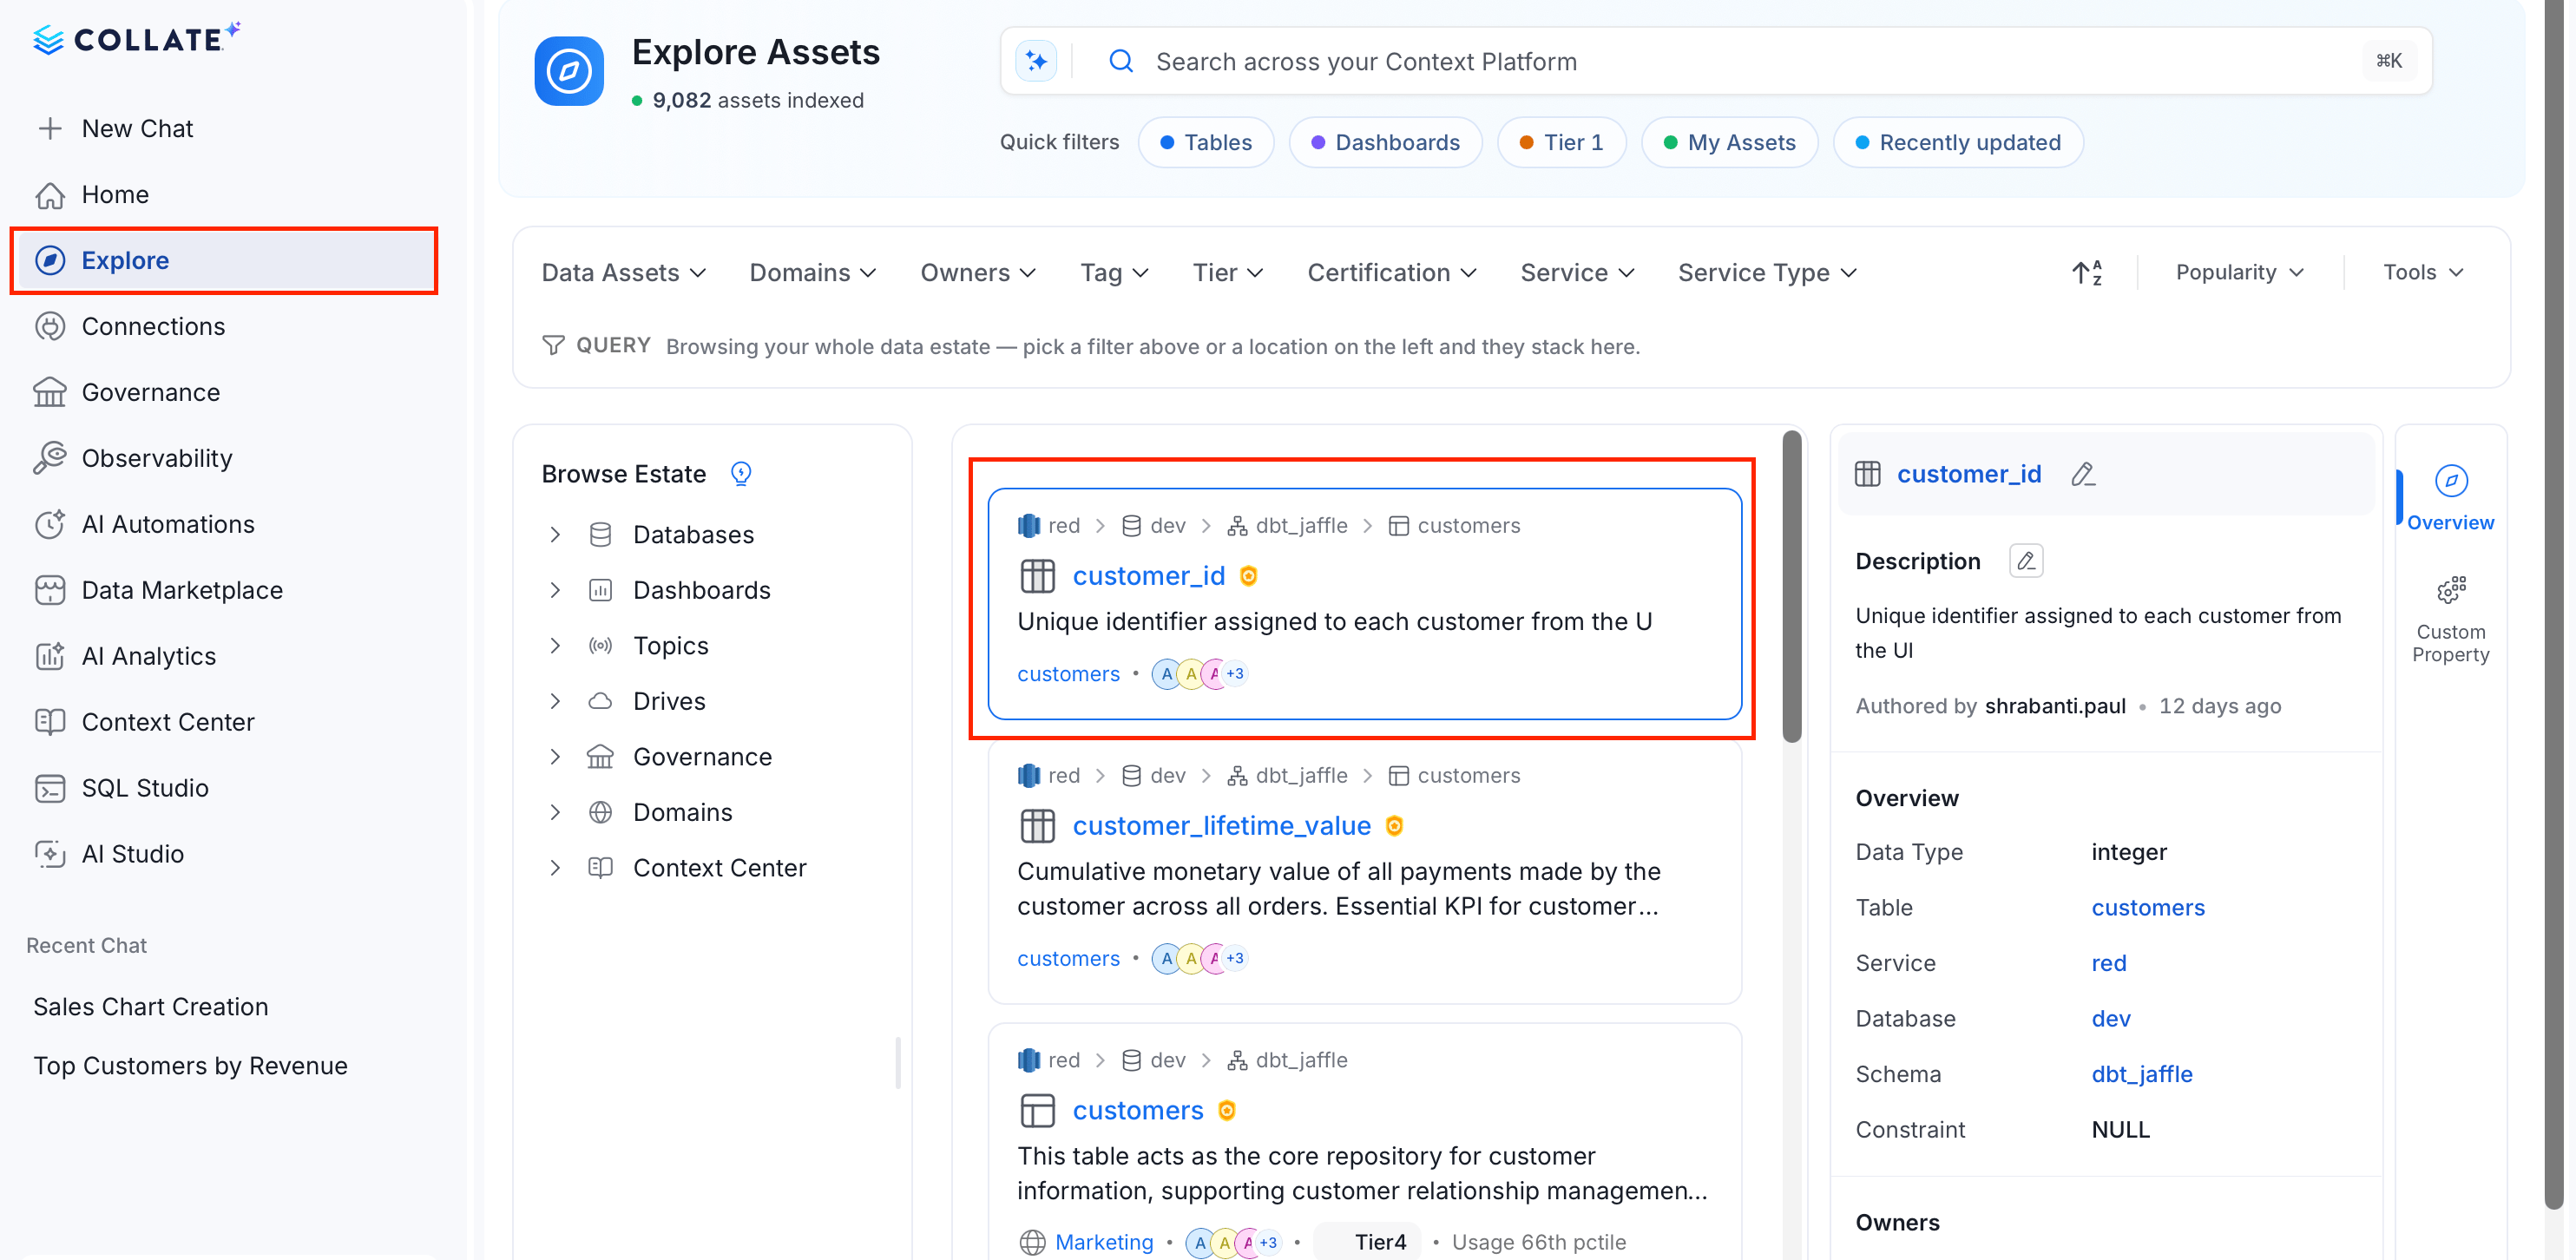
Version History and Other Details
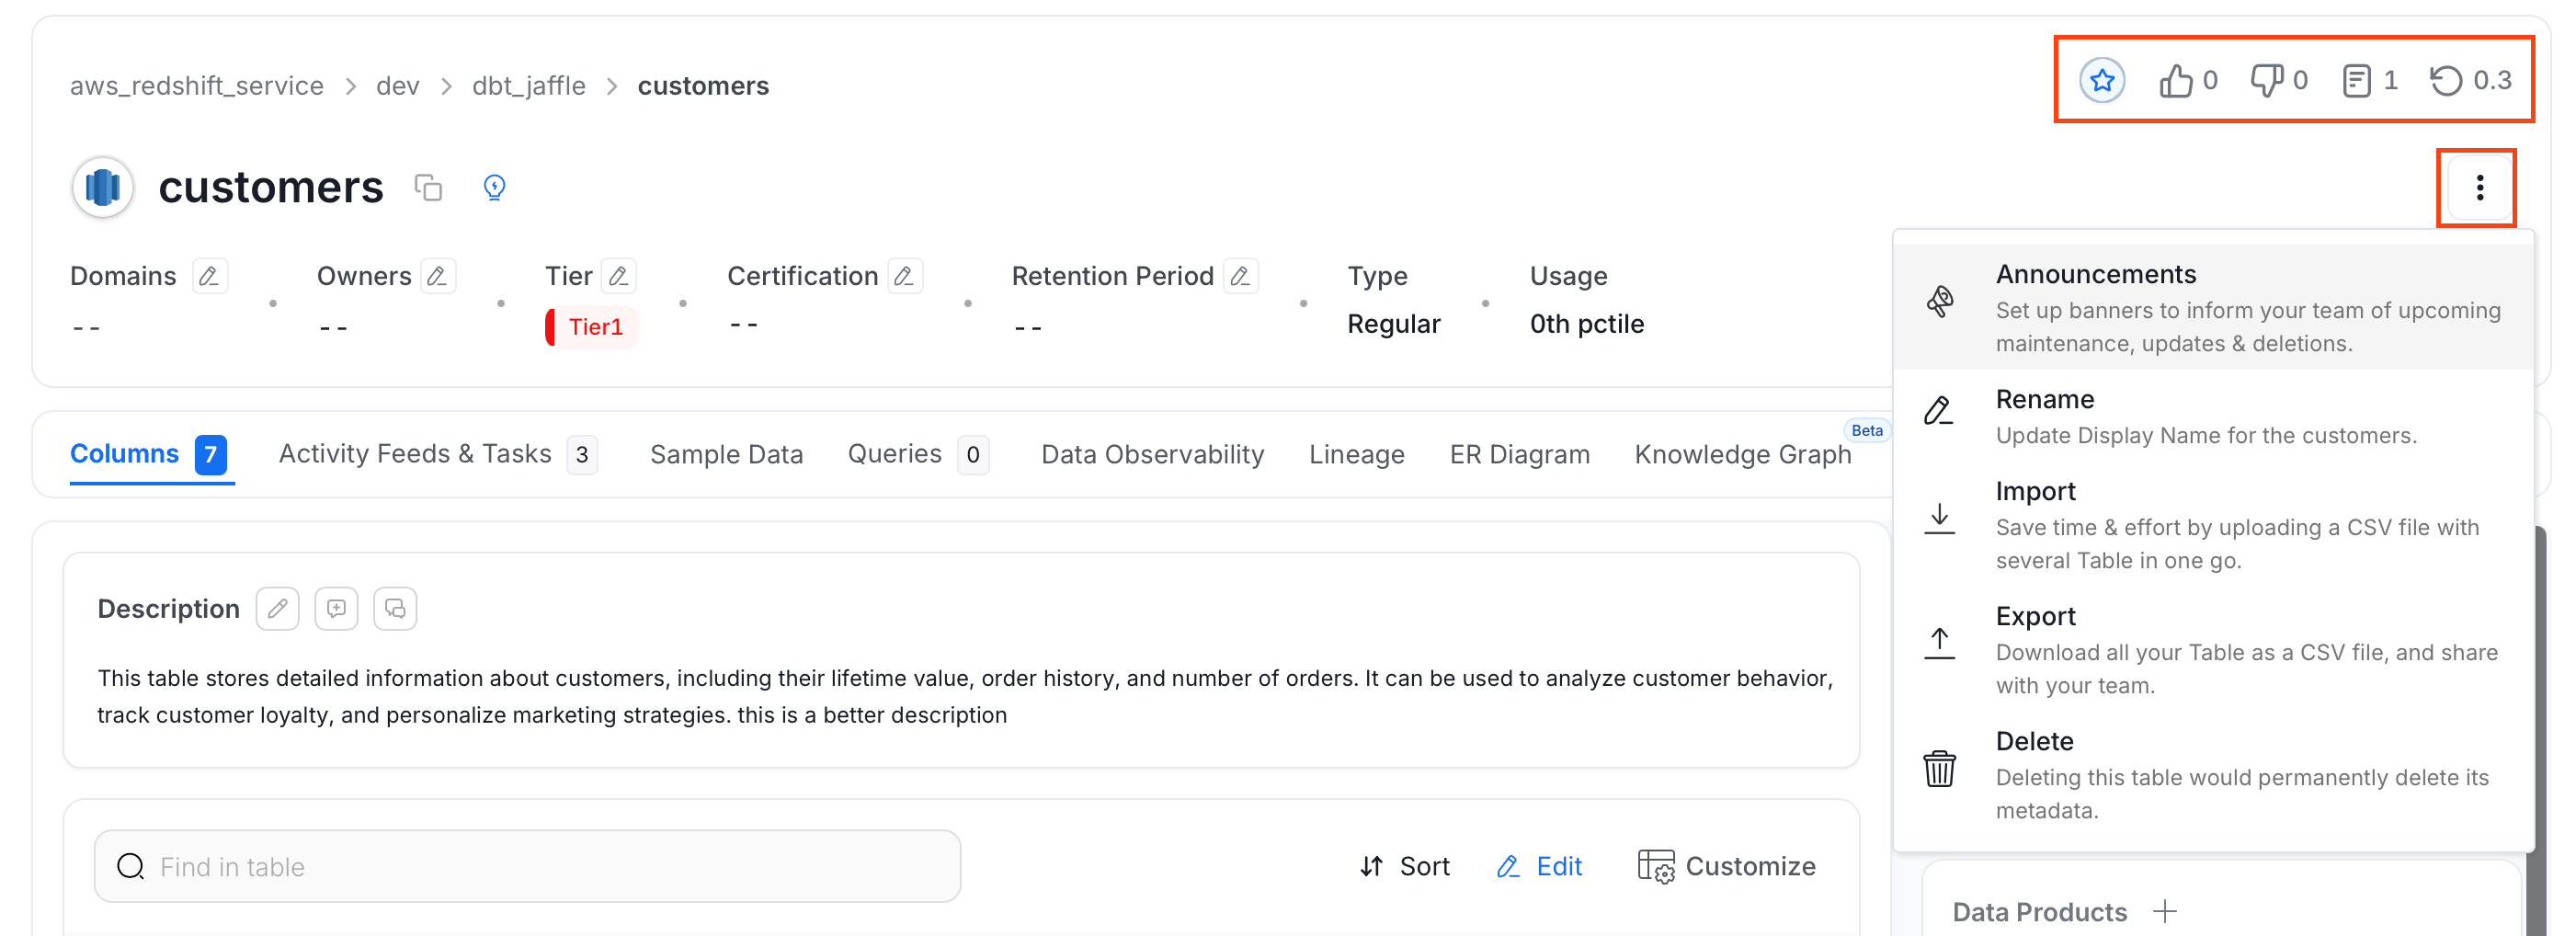
On the top right of the data asset details page, you can find the following actions:- Follow: Click the star icon to follow a data asset and receive updates when it changes. Following an asset keeps it easily accessible from your personal feed.
- Votes: The thumbs-up and thumbs-down icons let users upvote or downvote a data asset, helping the team signal data quality and trustworthiness at a glance.
- Tasks: The tasks icon shows the number of open tasks associated with the asset. Click it to view, assign, or resolve tasks related to this data asset.
- Version History: The version icon displays the current version number (e.g. 0.3). Click it to explore a full changelog of major and minor changes made to the asset over time.
- Announcements: Post banners on the asset page to inform your team of upcoming maintenance, schema changes, deprecations, or deletions.
- Rename: Update the display name of the data asset without affecting the underlying source or its Fully Qualified Name.
- Import: Upload a CSV file to bulk-update metadata for multiple tables in one go, saving time compared to editing each asset individually.
- Export: Download the asset’s metadata as a CSV file to share with your team or use in external workflows.
- Delete: Permanently delete the data asset and all its associated metadata from Collate.
Data Asset Tabs
There are separate tabs for Columns, Activity Feeds & Tasks, Sample Data, Queries, Data Observability, Lineage, ER Diagram, Knowledge Graph, Contract, Custom Properties, Config, Details, Features, Children, and Executions based on the type of data asset selected. Let’s take a look at each of the tabs.
* Only appears when the RDF Knowledge Graph Indexing app is installed and enabled. See Applications.
Columns Tab
The Columns tab is displayed only for Tables, Topics, and Containers. It displays the columns (or fields for Topics), their type, and description, along with the tags and glossary terms associated with each column. The table also displays details on the Frequently Joined Tables, Tags, and Glossary Terms associated with it.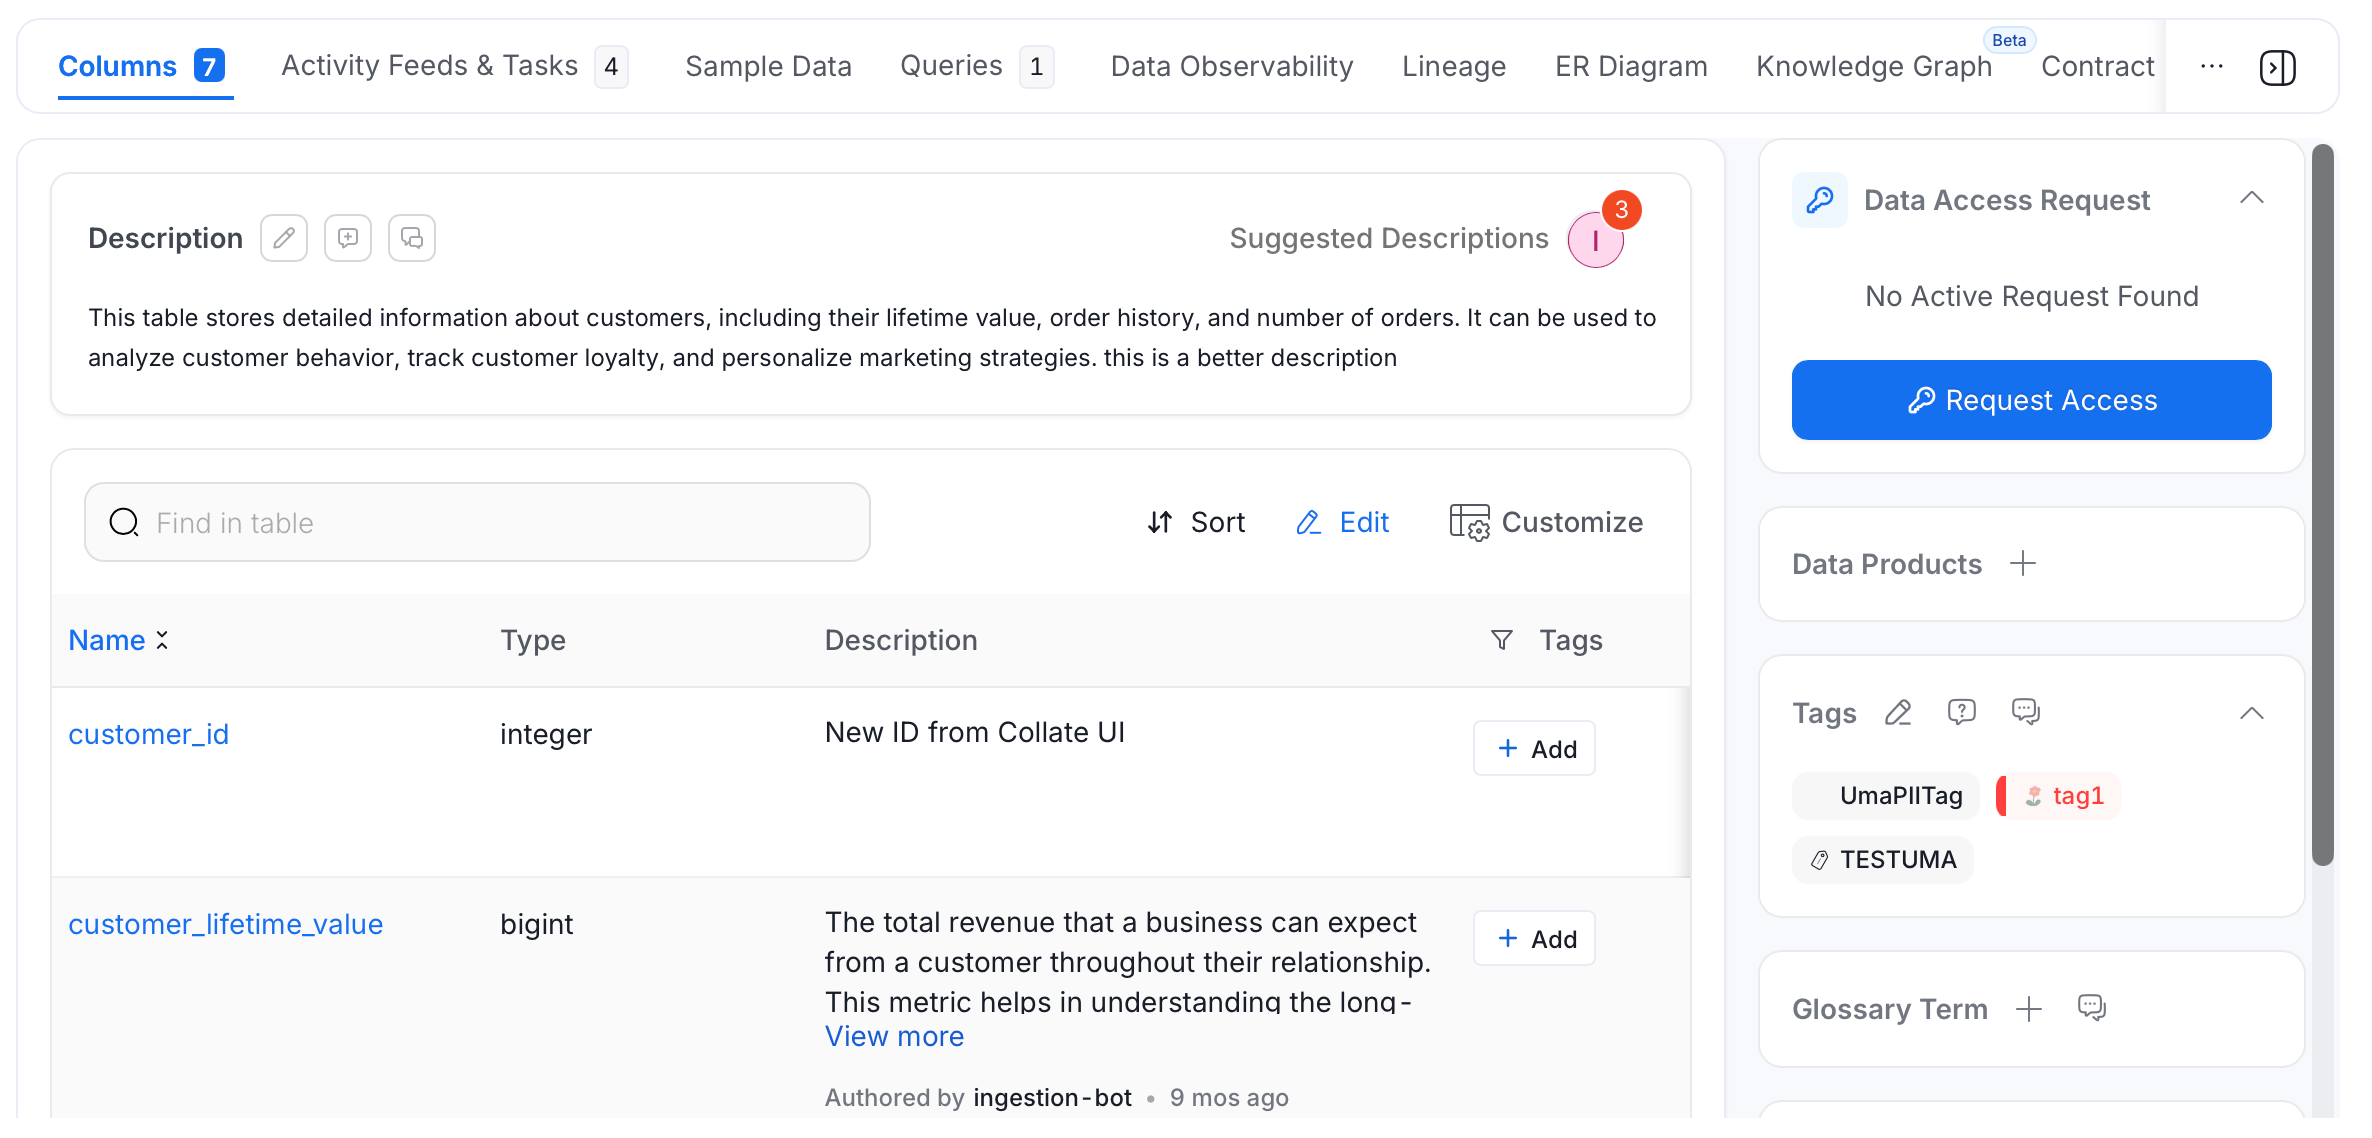
Activity Feeds & Tasks Tab
The Activity Feeds & Task tab is displayed for all types of data assets. It displays all the tasks and mentions for a particular data asset.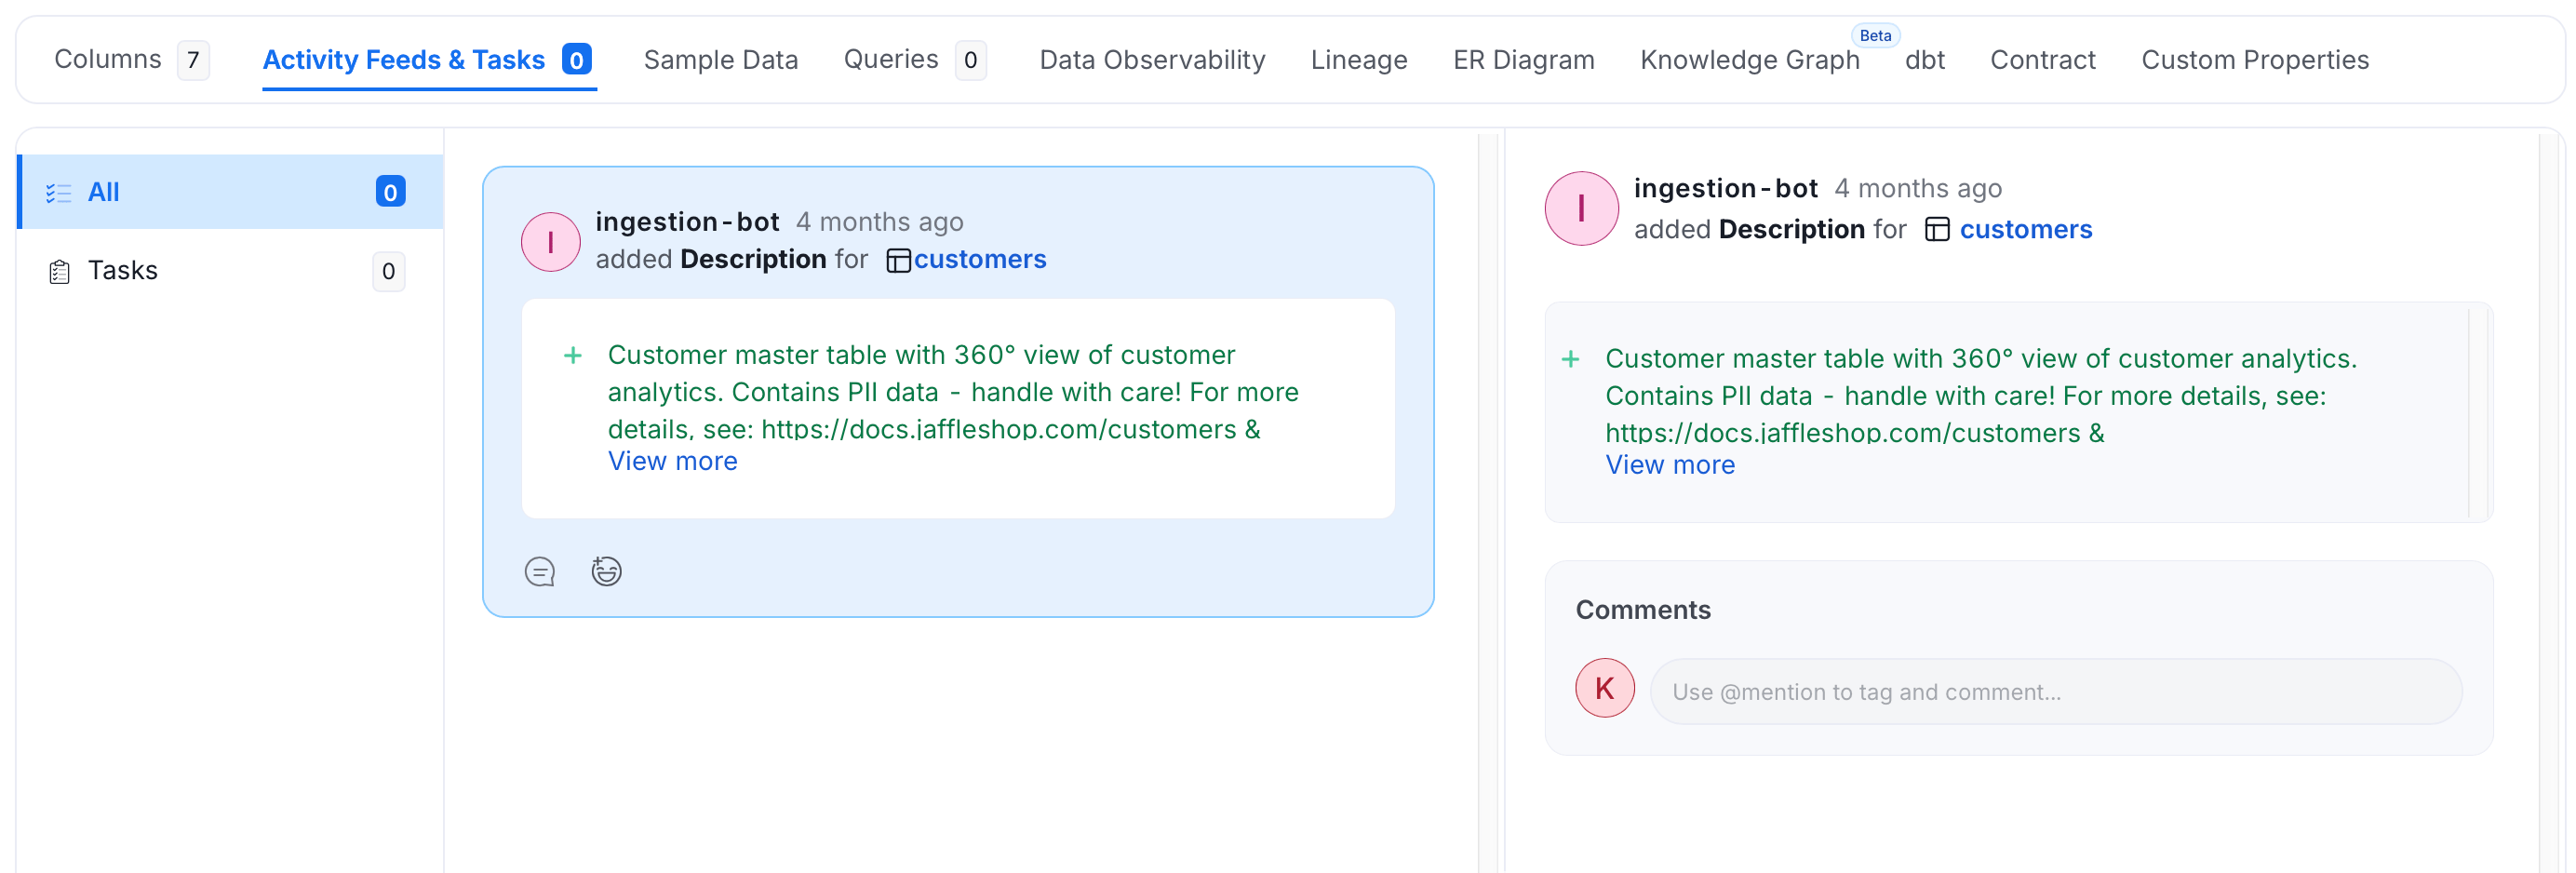
Sample Data Tab
During metadata ingestion, you can opt to bring in sample data. If sample data is enabled, the same is displayed here. The Sample Data tab is displayed only for Tables and Topics.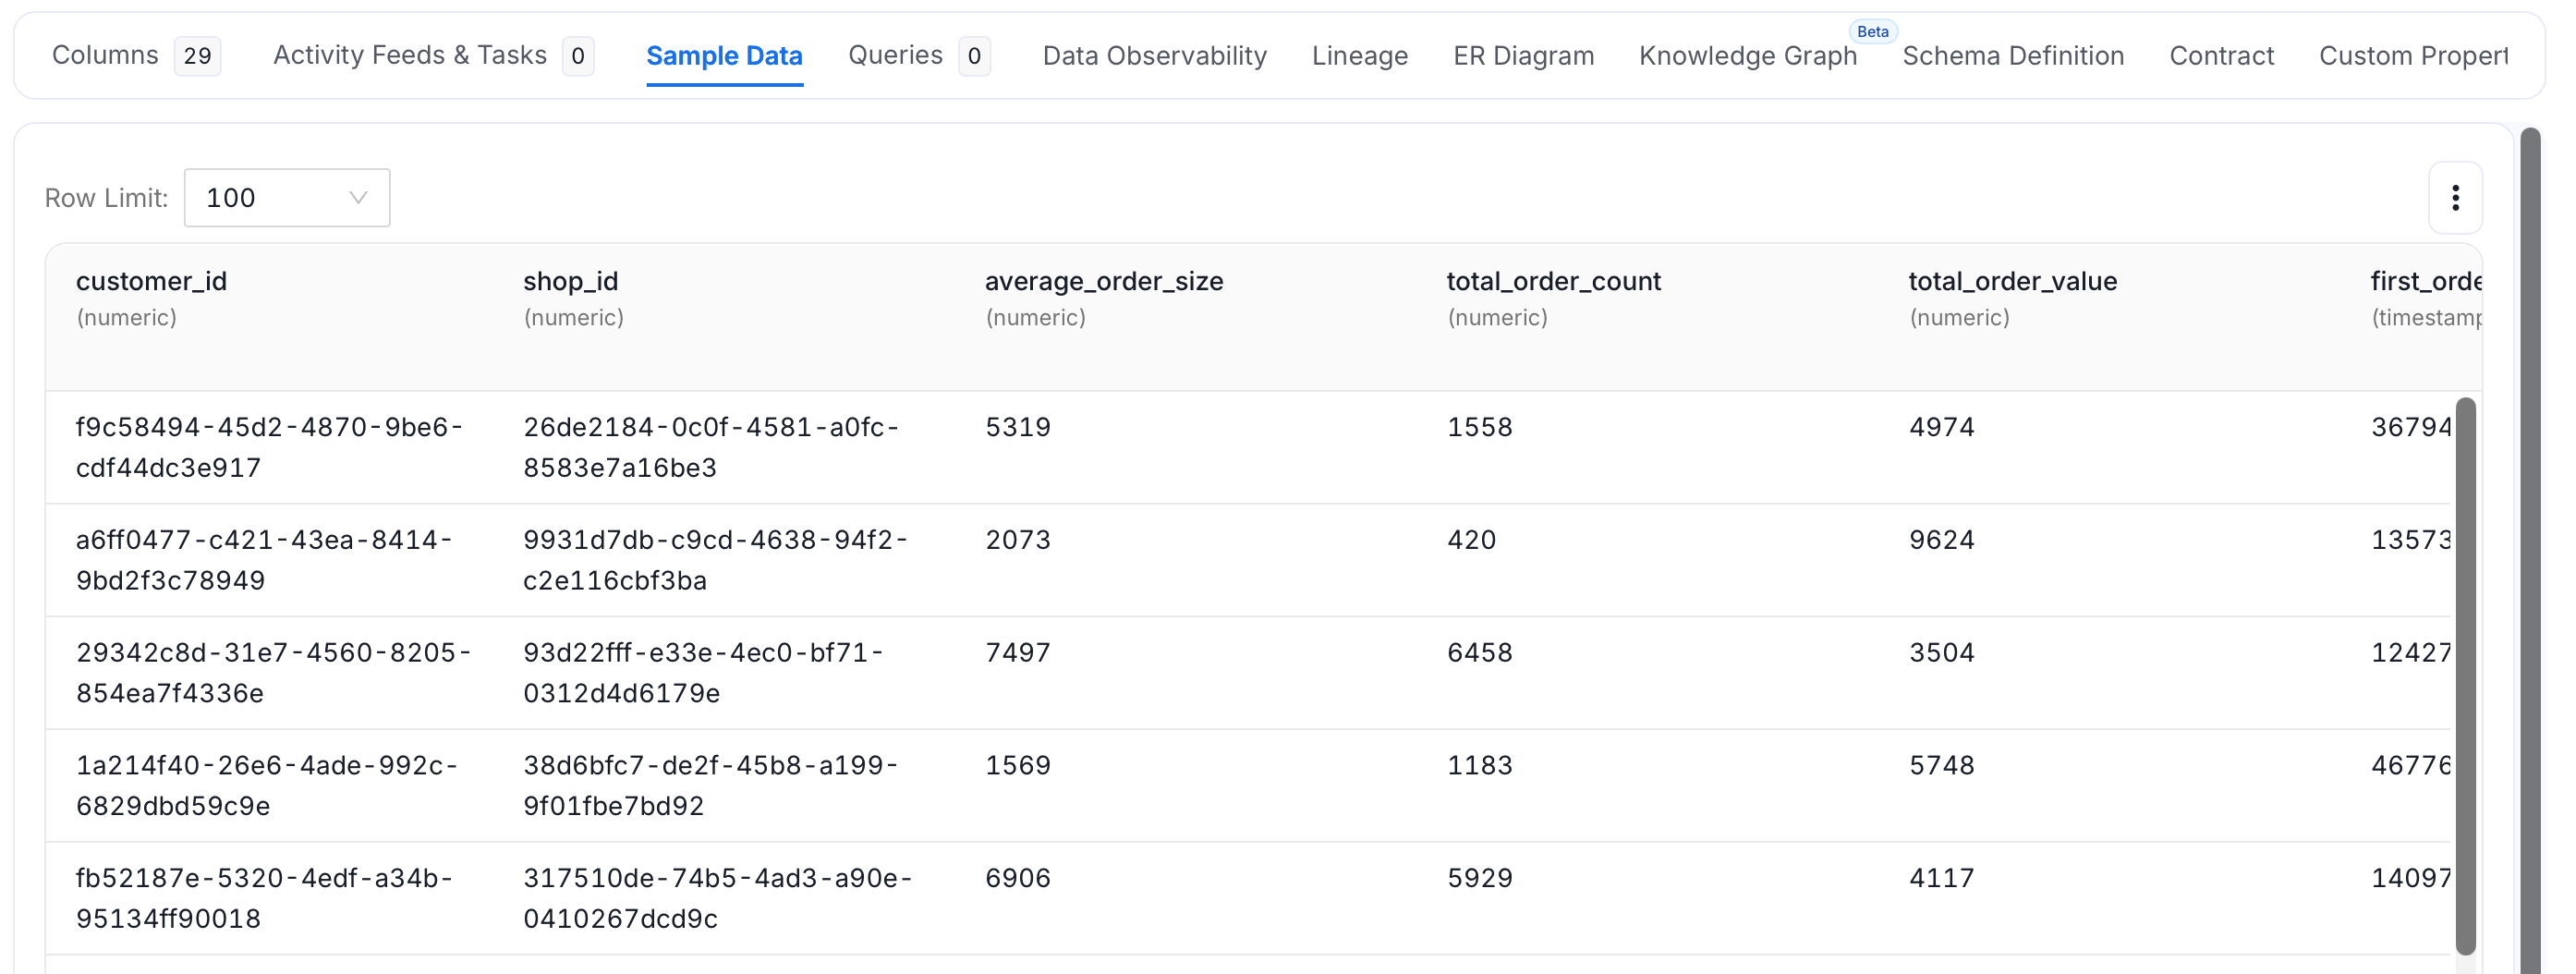
Queries Tab
The Queries tab is displayed only for Tables. It displays the SQL queries run against a particular table. It provides the details on when the query was run and the amount of time taken. It also displays if the query was used by other tables. You can also add new queries.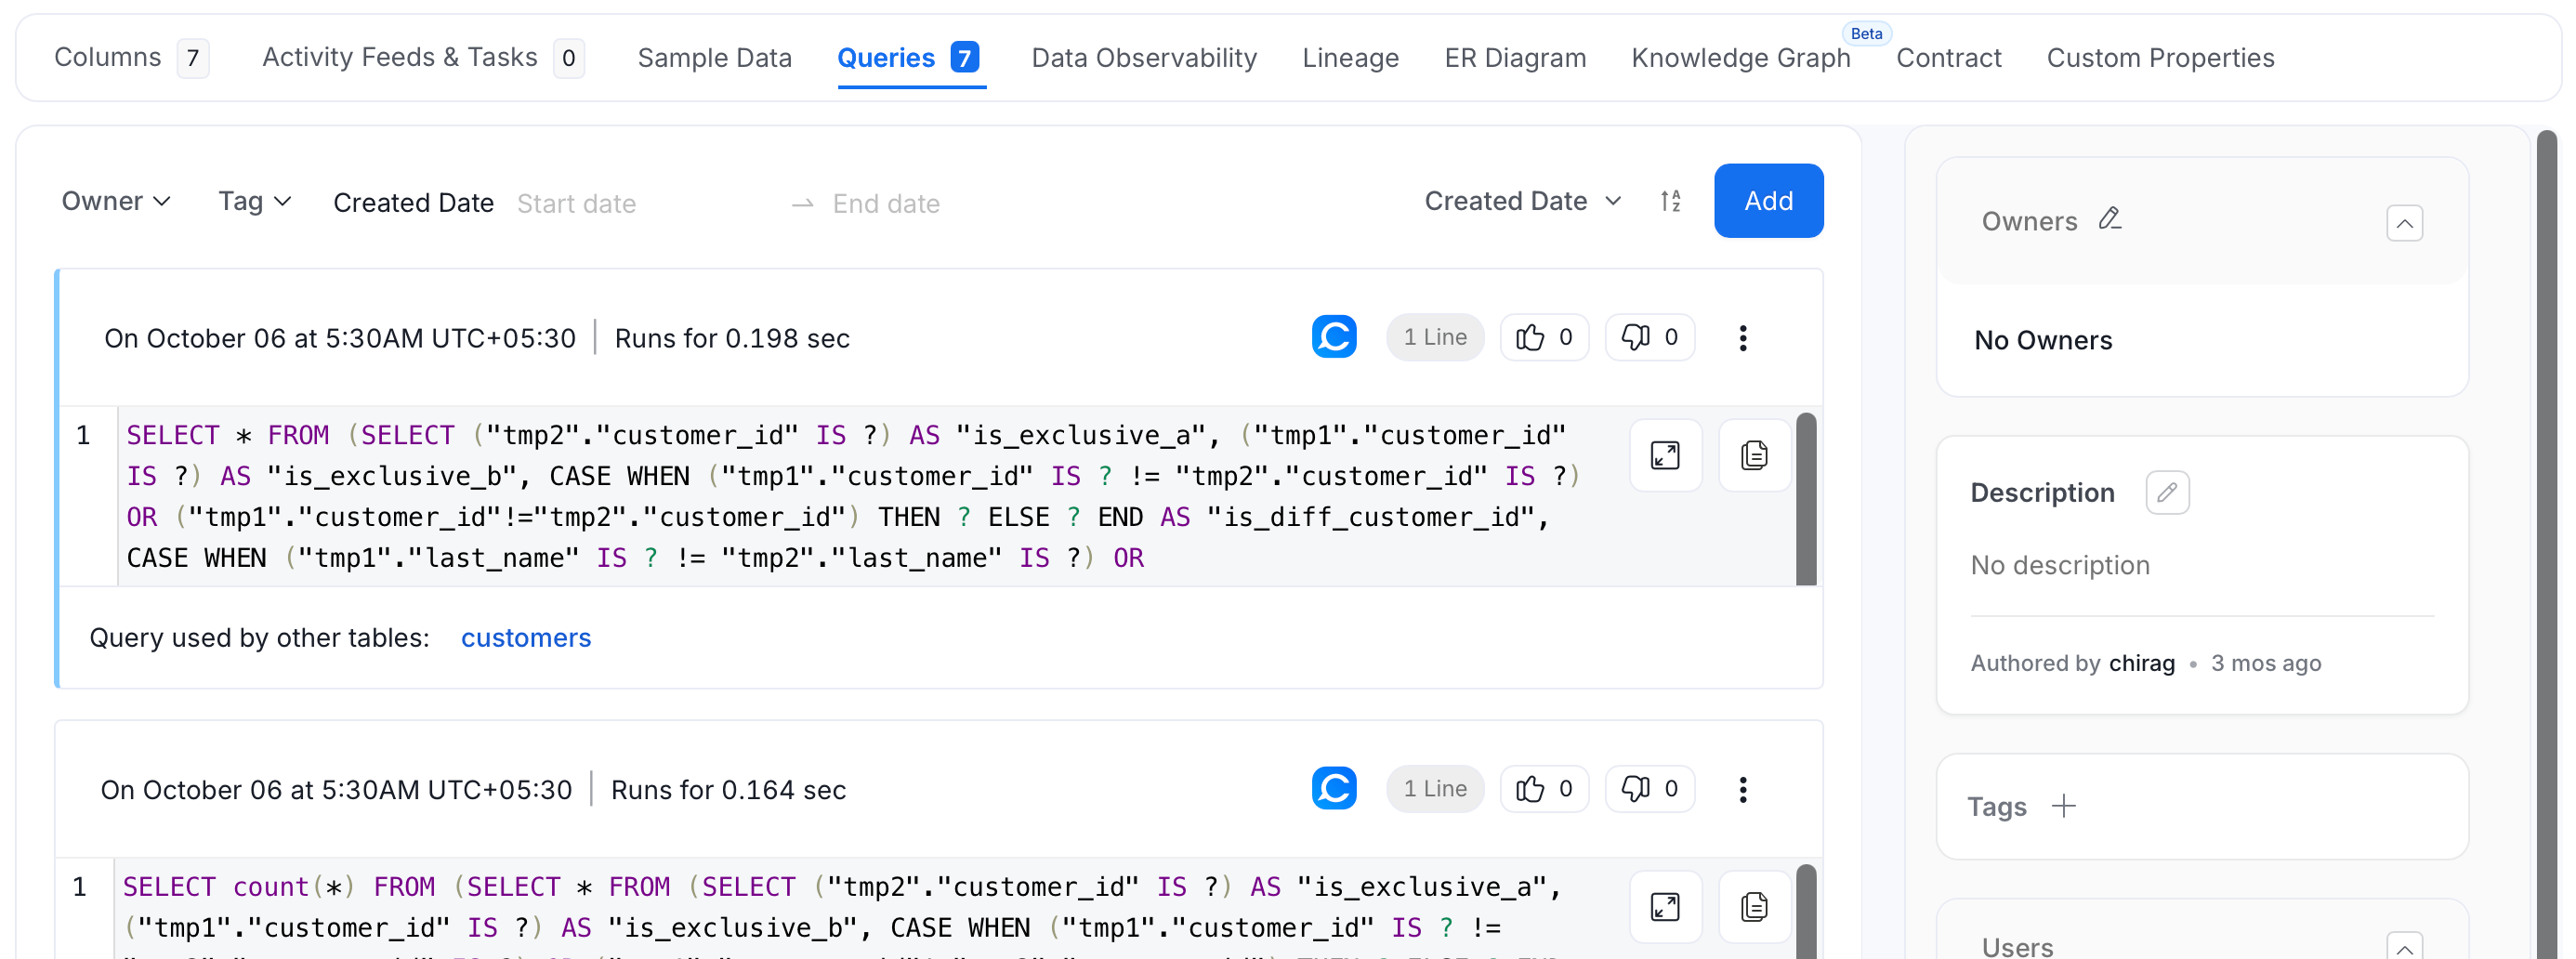
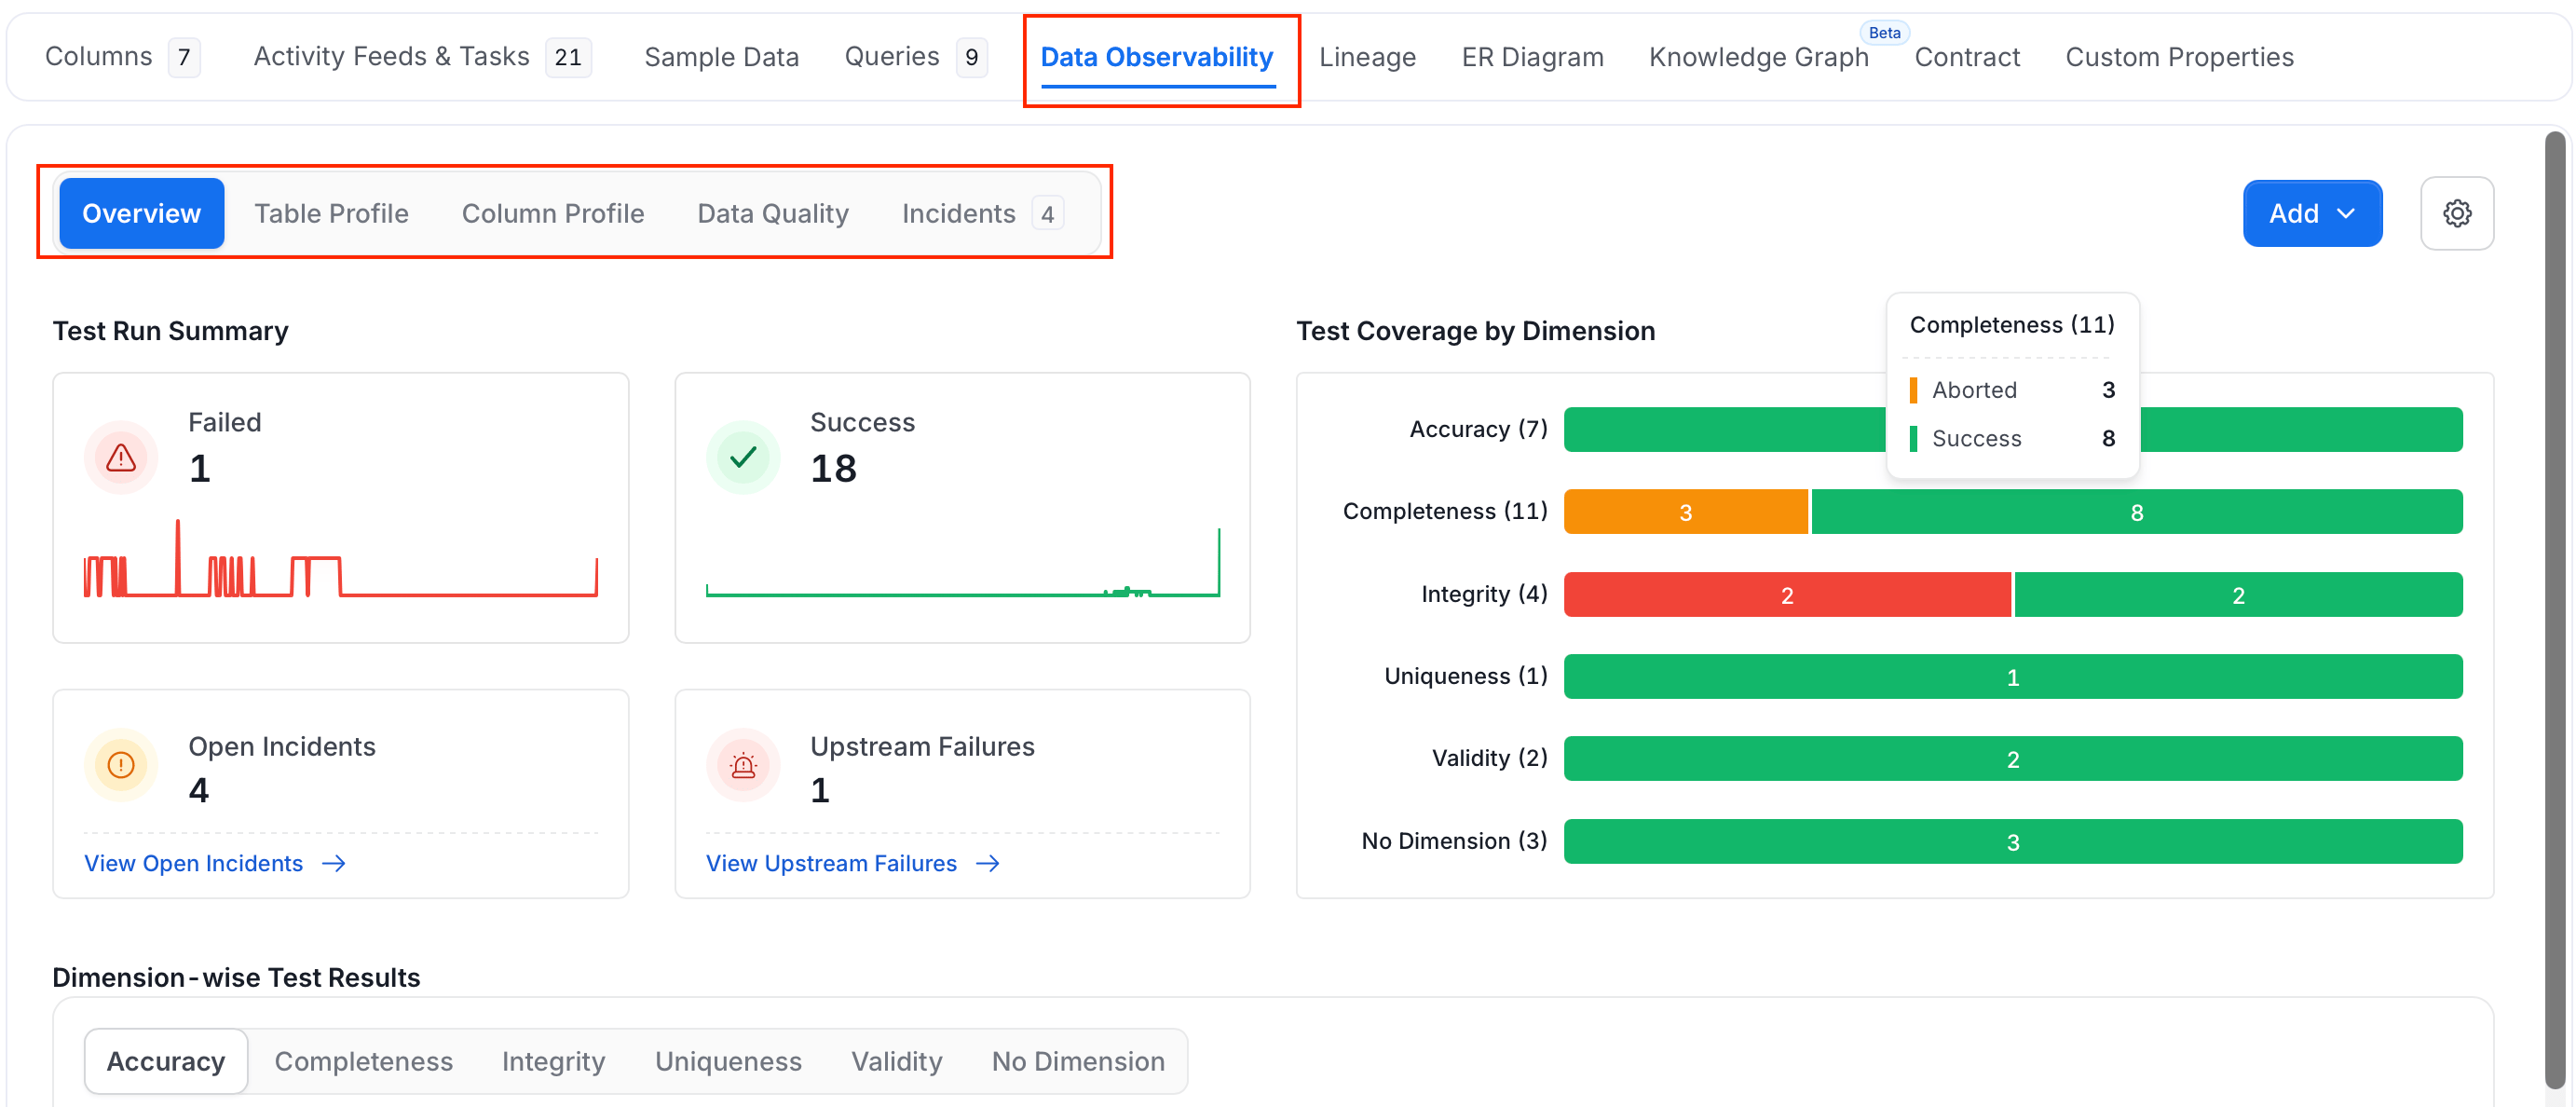
Data Observability Tab
The Data Observability tab is displayed only for Tables. It contains five sub-tabs:- Overview: A summary of your table’s data quality health. Displays the Test Run Summary (Failed, Success, Open Incidents, Upstream Failures counts), Test Coverage by Dimension showing which quality dimensions are covered, and Dimension-wise Test Results with a breakdown of test outcomes by category such as Consistency, Completeness, Accuracy, and more.
- Table Profile: Displays table-level metrics including the number of rows and columns, data volume over time, table update frequency, and volume changes. Useful for detecting unexpected data growth or drops.
- Column Profile: Shows per-column statistics — type, value count, null value %, distinct value %, and unique %. Helps identify columns with missing data, high cardinality, or unexpected distributions.
- Data Quality: Lists all data quality tests configured for the table at both the table and column levels. Shows test status, last run time, and pass/fail results. New tests can be added directly from this tab.
- Incidents: Tracks open data quality incidents triggered by failed tests. Each incident shows its severity, the affected column or table, and the current resolution status.
Lineage Tab
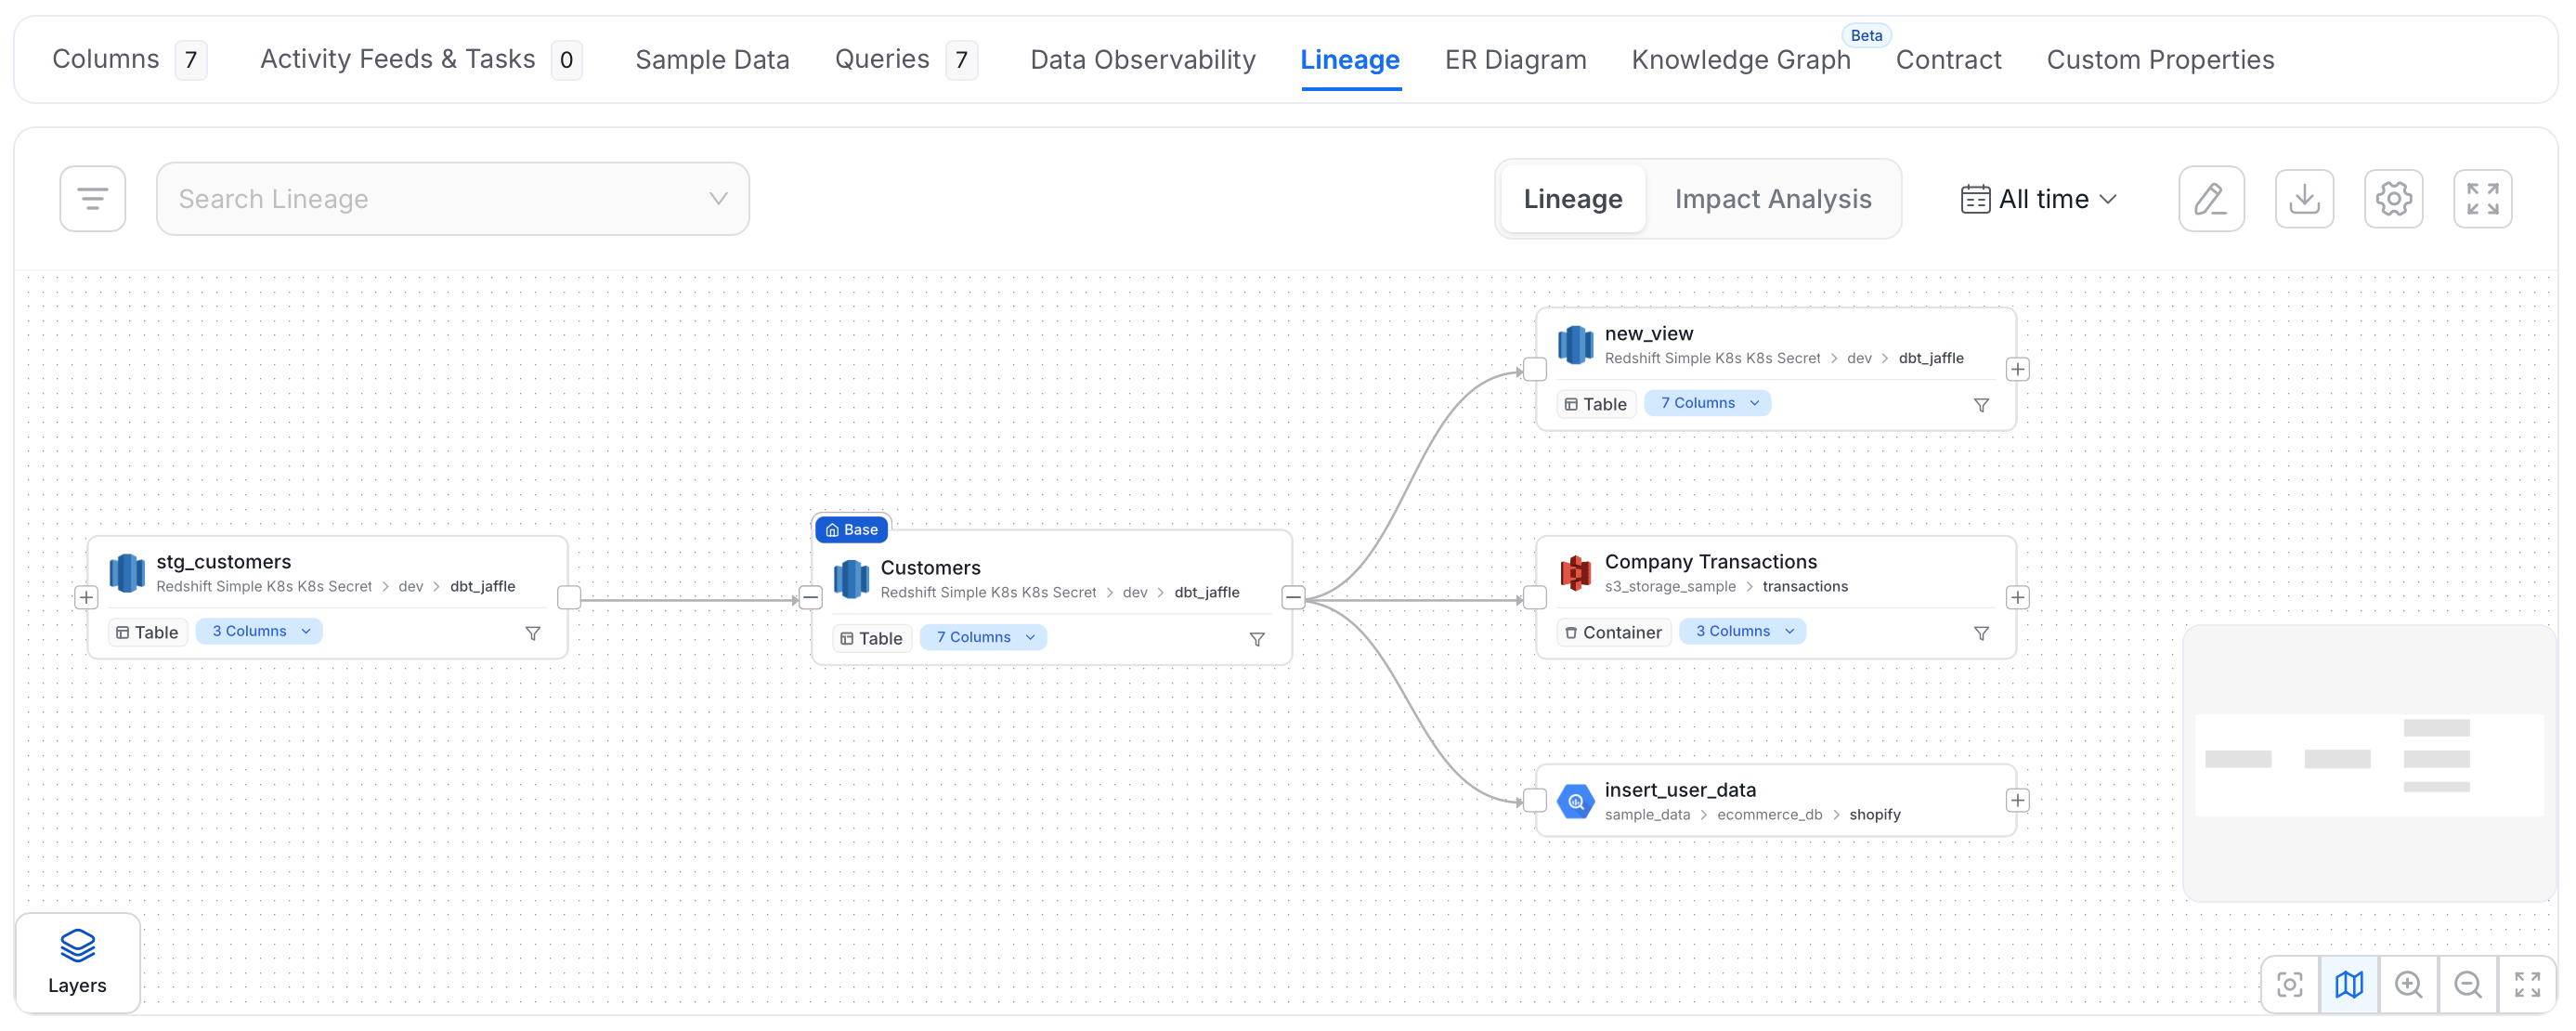
The Lineage tab is available for all data asset types. It shows you the full journey of your data — where it comes from (upstream) and where it flows to (downstream) — in a visual graph.- End-to-end traceability: View lineage at both the table and column level to understand exactly how data moves and transforms across your pipelines.
- Upstream & downstream: Each node in the graph shows its direct dependencies and dependents. Follow the chain to trace the root cause of a data issue or understand the impact of a change.
- Configurable view: Click the Settings icon to adjust the number of upstream/downstream levels and nodes per layer displayed, keeping the graph focused on what matters.
- Manual lineage: Click the Edit icon to manually connect data assets using a no-code editor — useful for sources that don’t support automatic lineage extraction.
- Asset preview: Click any node in the lineage graph to see a quick preview of that asset, including its tags, columns, data quality status, and profiler metrics.
Knowledge Graph Tab
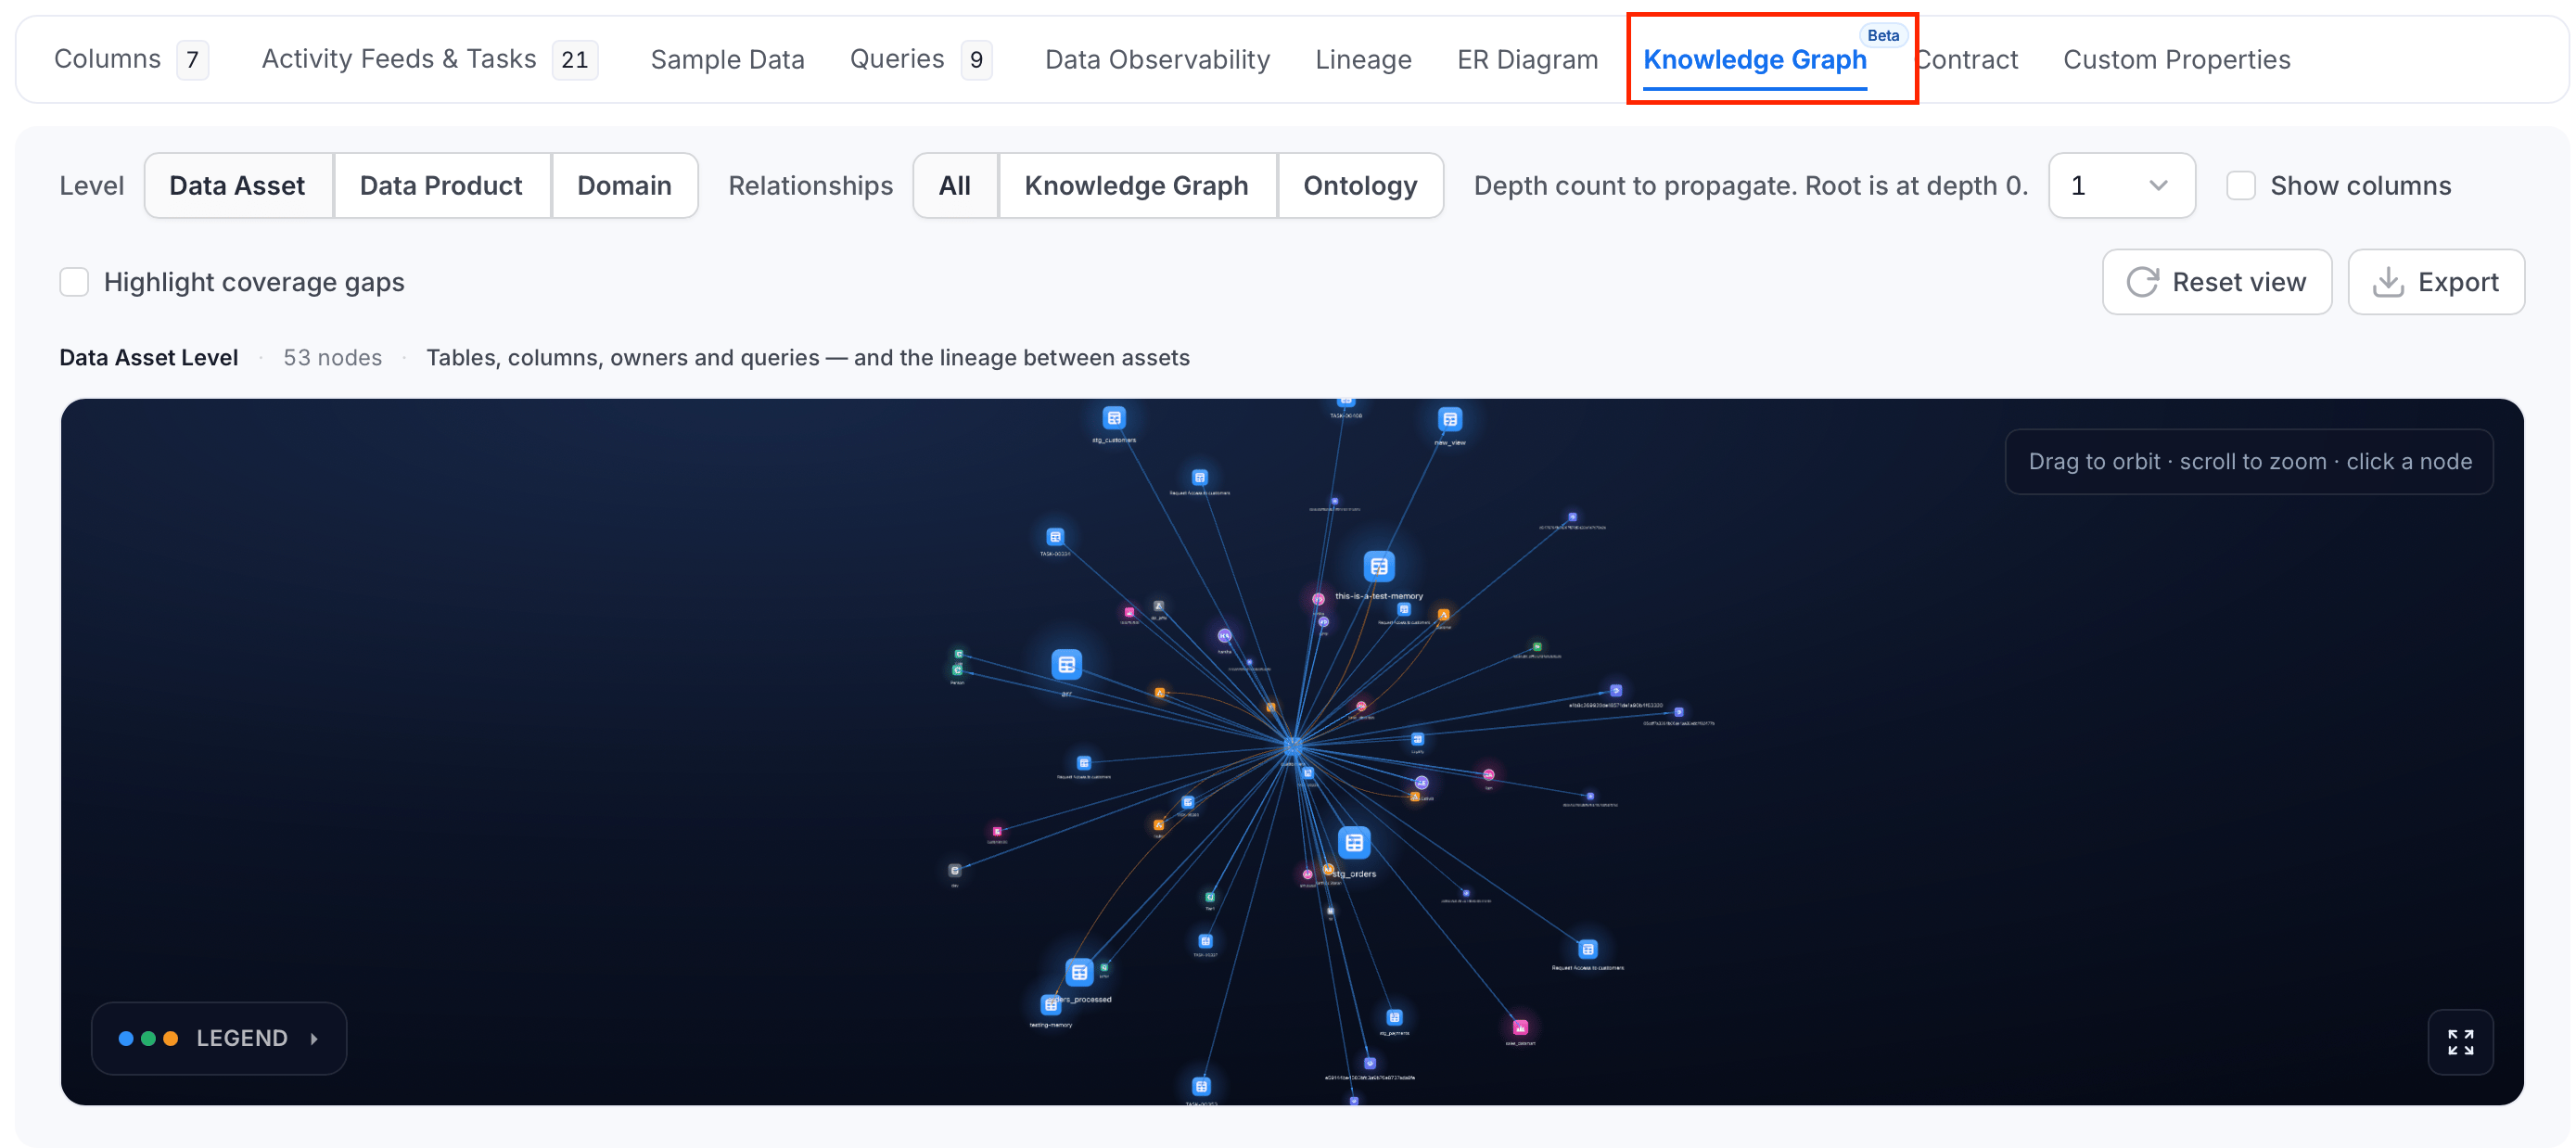
The Knowledge Graph tab is displayed only for Tables and is currently in Beta. It requires the RDF Knowledge Graph Indexing app to be installed and enabled; without it, the tab doesn’t appear. See Applications. The tab renders an interactive 3D graph of the table and its related entities, built from the RDF triple store rather than Collate’s standard lineage edges.- Level: Scope the graph to Data Asset, Data Product, or Domain relationships.
- Relationships: Filter which relationship types are shown: All, Knowledge Graph, or Ontology.
- Depth count to propagate: Set how many relationship hops to expand from the root node.
- Show columns: Toggle whether column-level nodes are included in the graph.
- Highlight coverage gaps: Flag nodes that are missing metadata coverage.
- Reset view: Return the graph to its default zoom and orientation.
- Export: Download the current graph.
Contract Tab
The Contract tab is displayed for all types of data assets. It allows teams to define and enforce a formal data contract for the asset — specifying expectations around data quality, schema, SLAs, and ownership. Data contracts help ensure that producers and consumers of a data asset agree on its structure and reliability.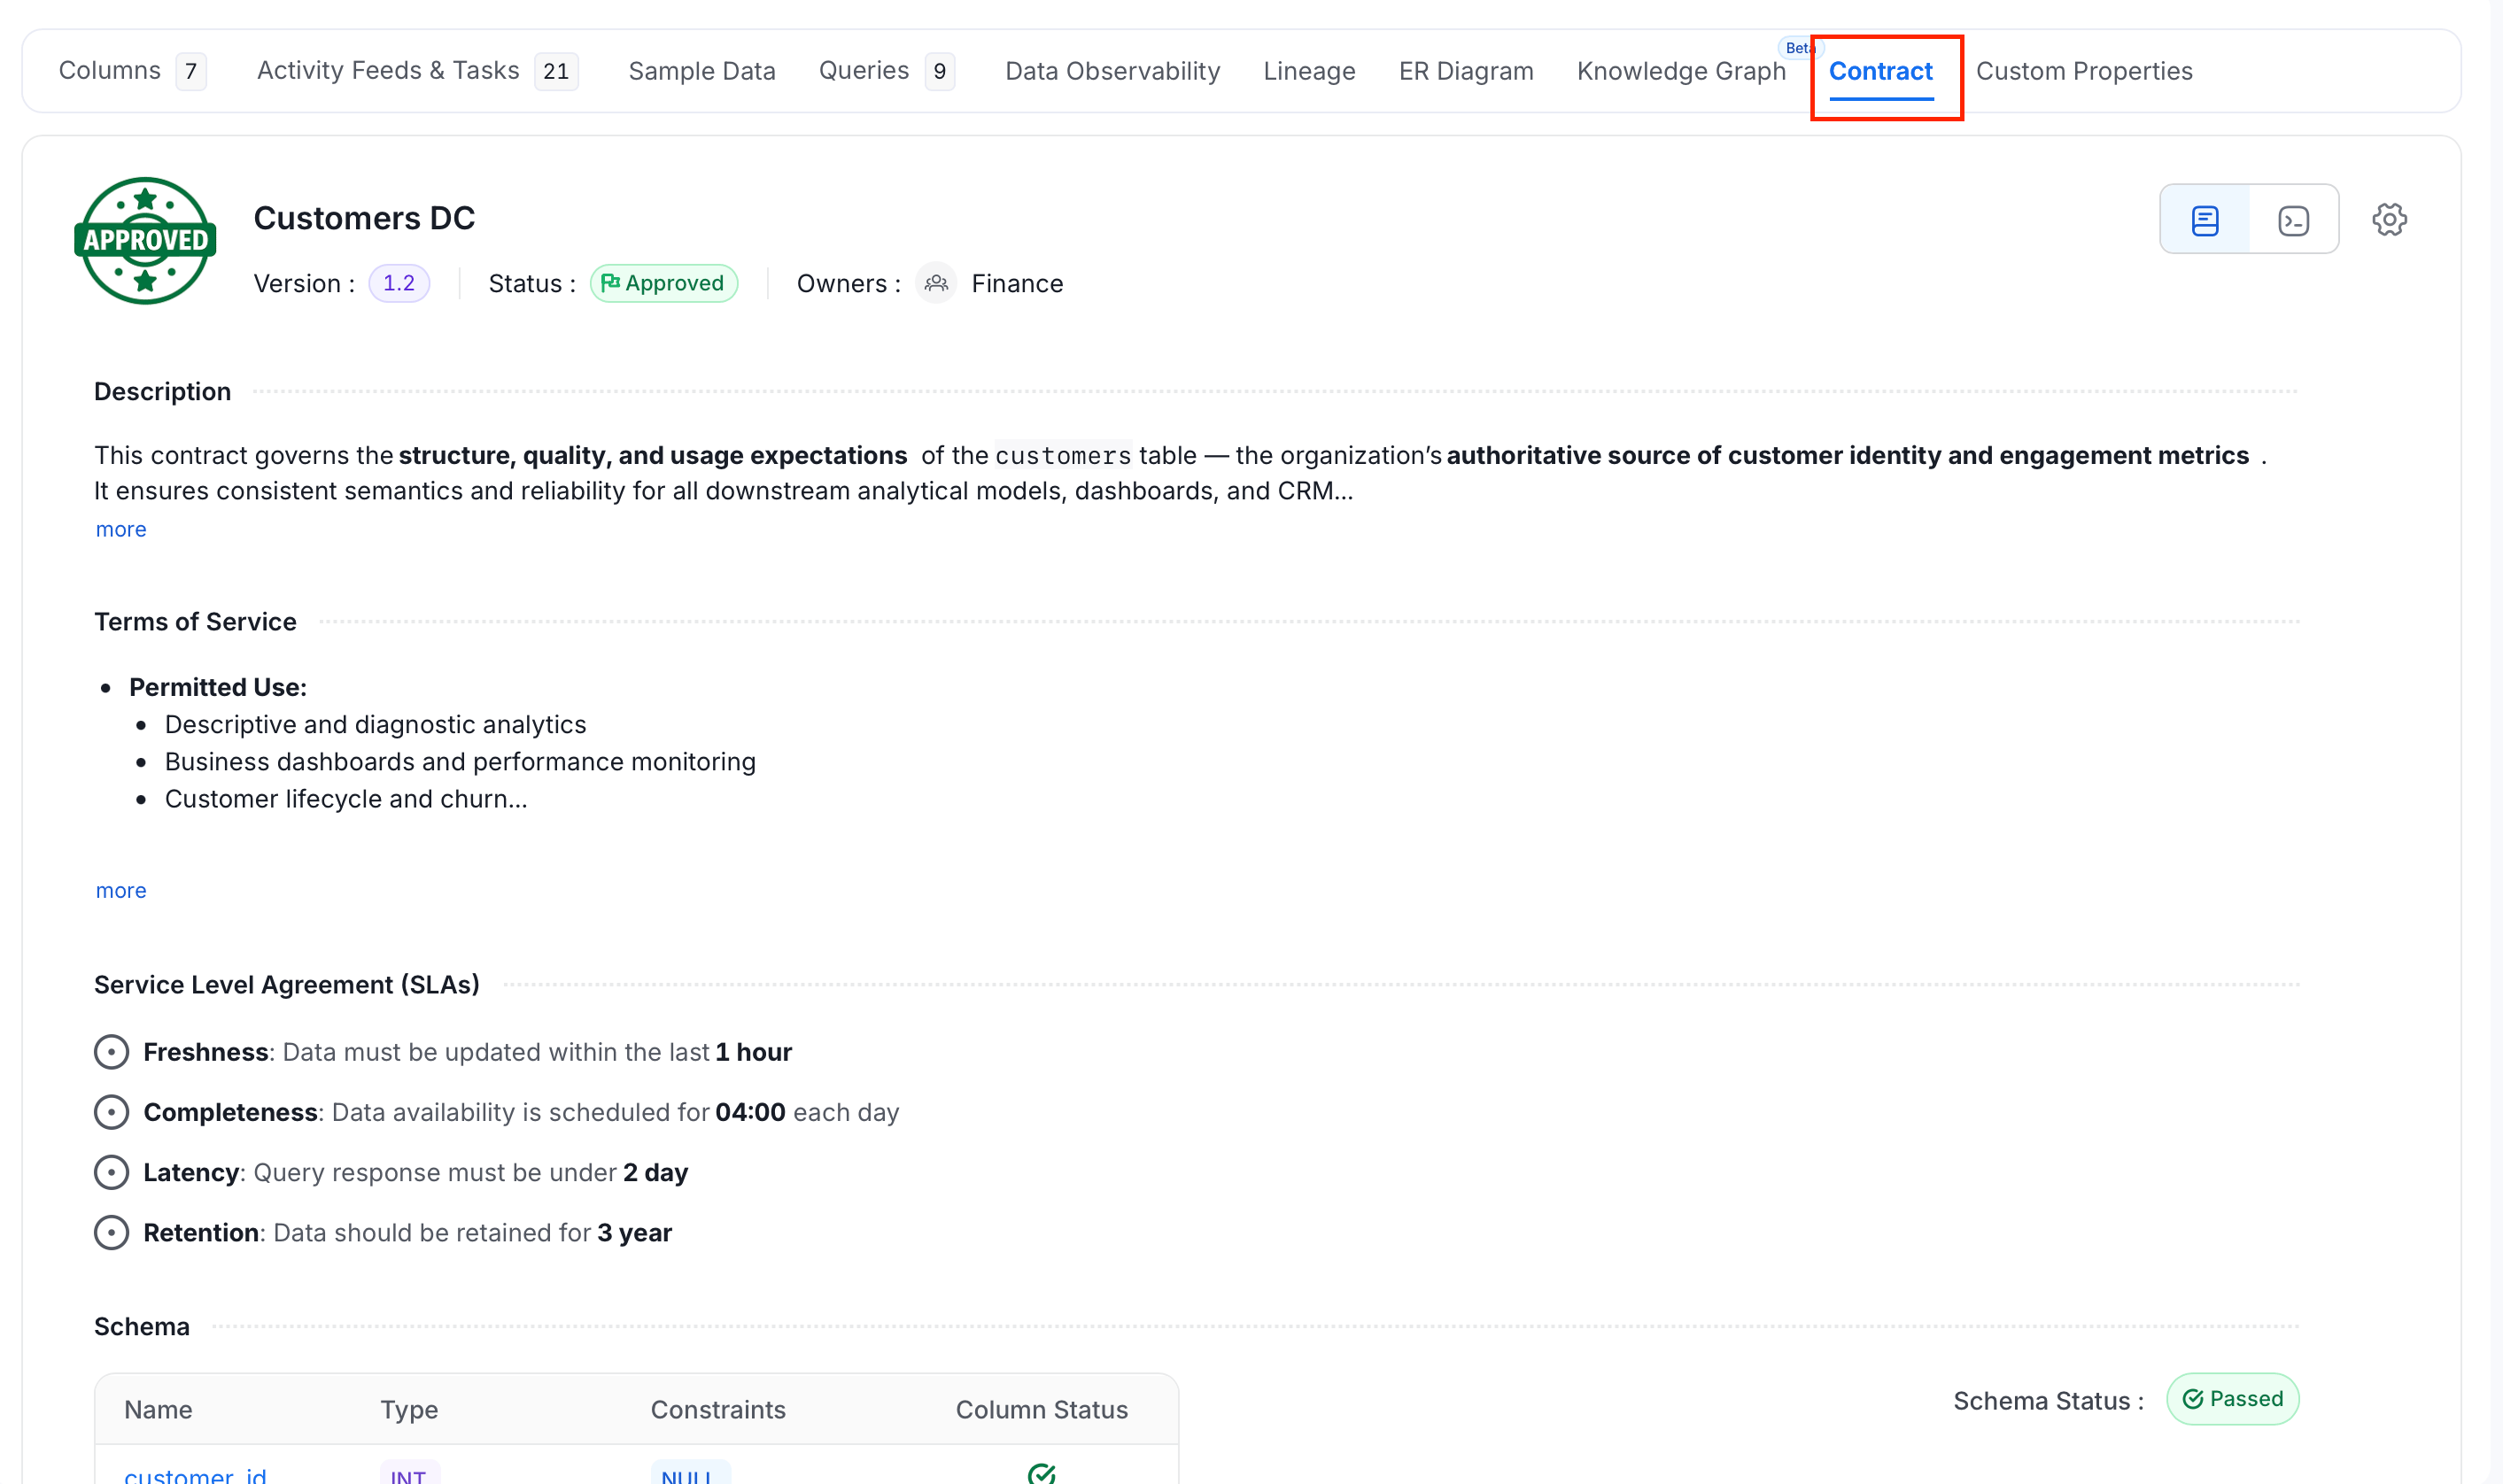
Custom Properties Tab
Collate uses a schema-first approach. We also support custom properties for all types of data assets. Organizations can extend the attributes as required to capture custom metadata. The Custom Properties tab shows up for all types of data assets. User can add or edit the custom property values for the data assets from this tab. See How to Create a Custom Property for a Data Asset.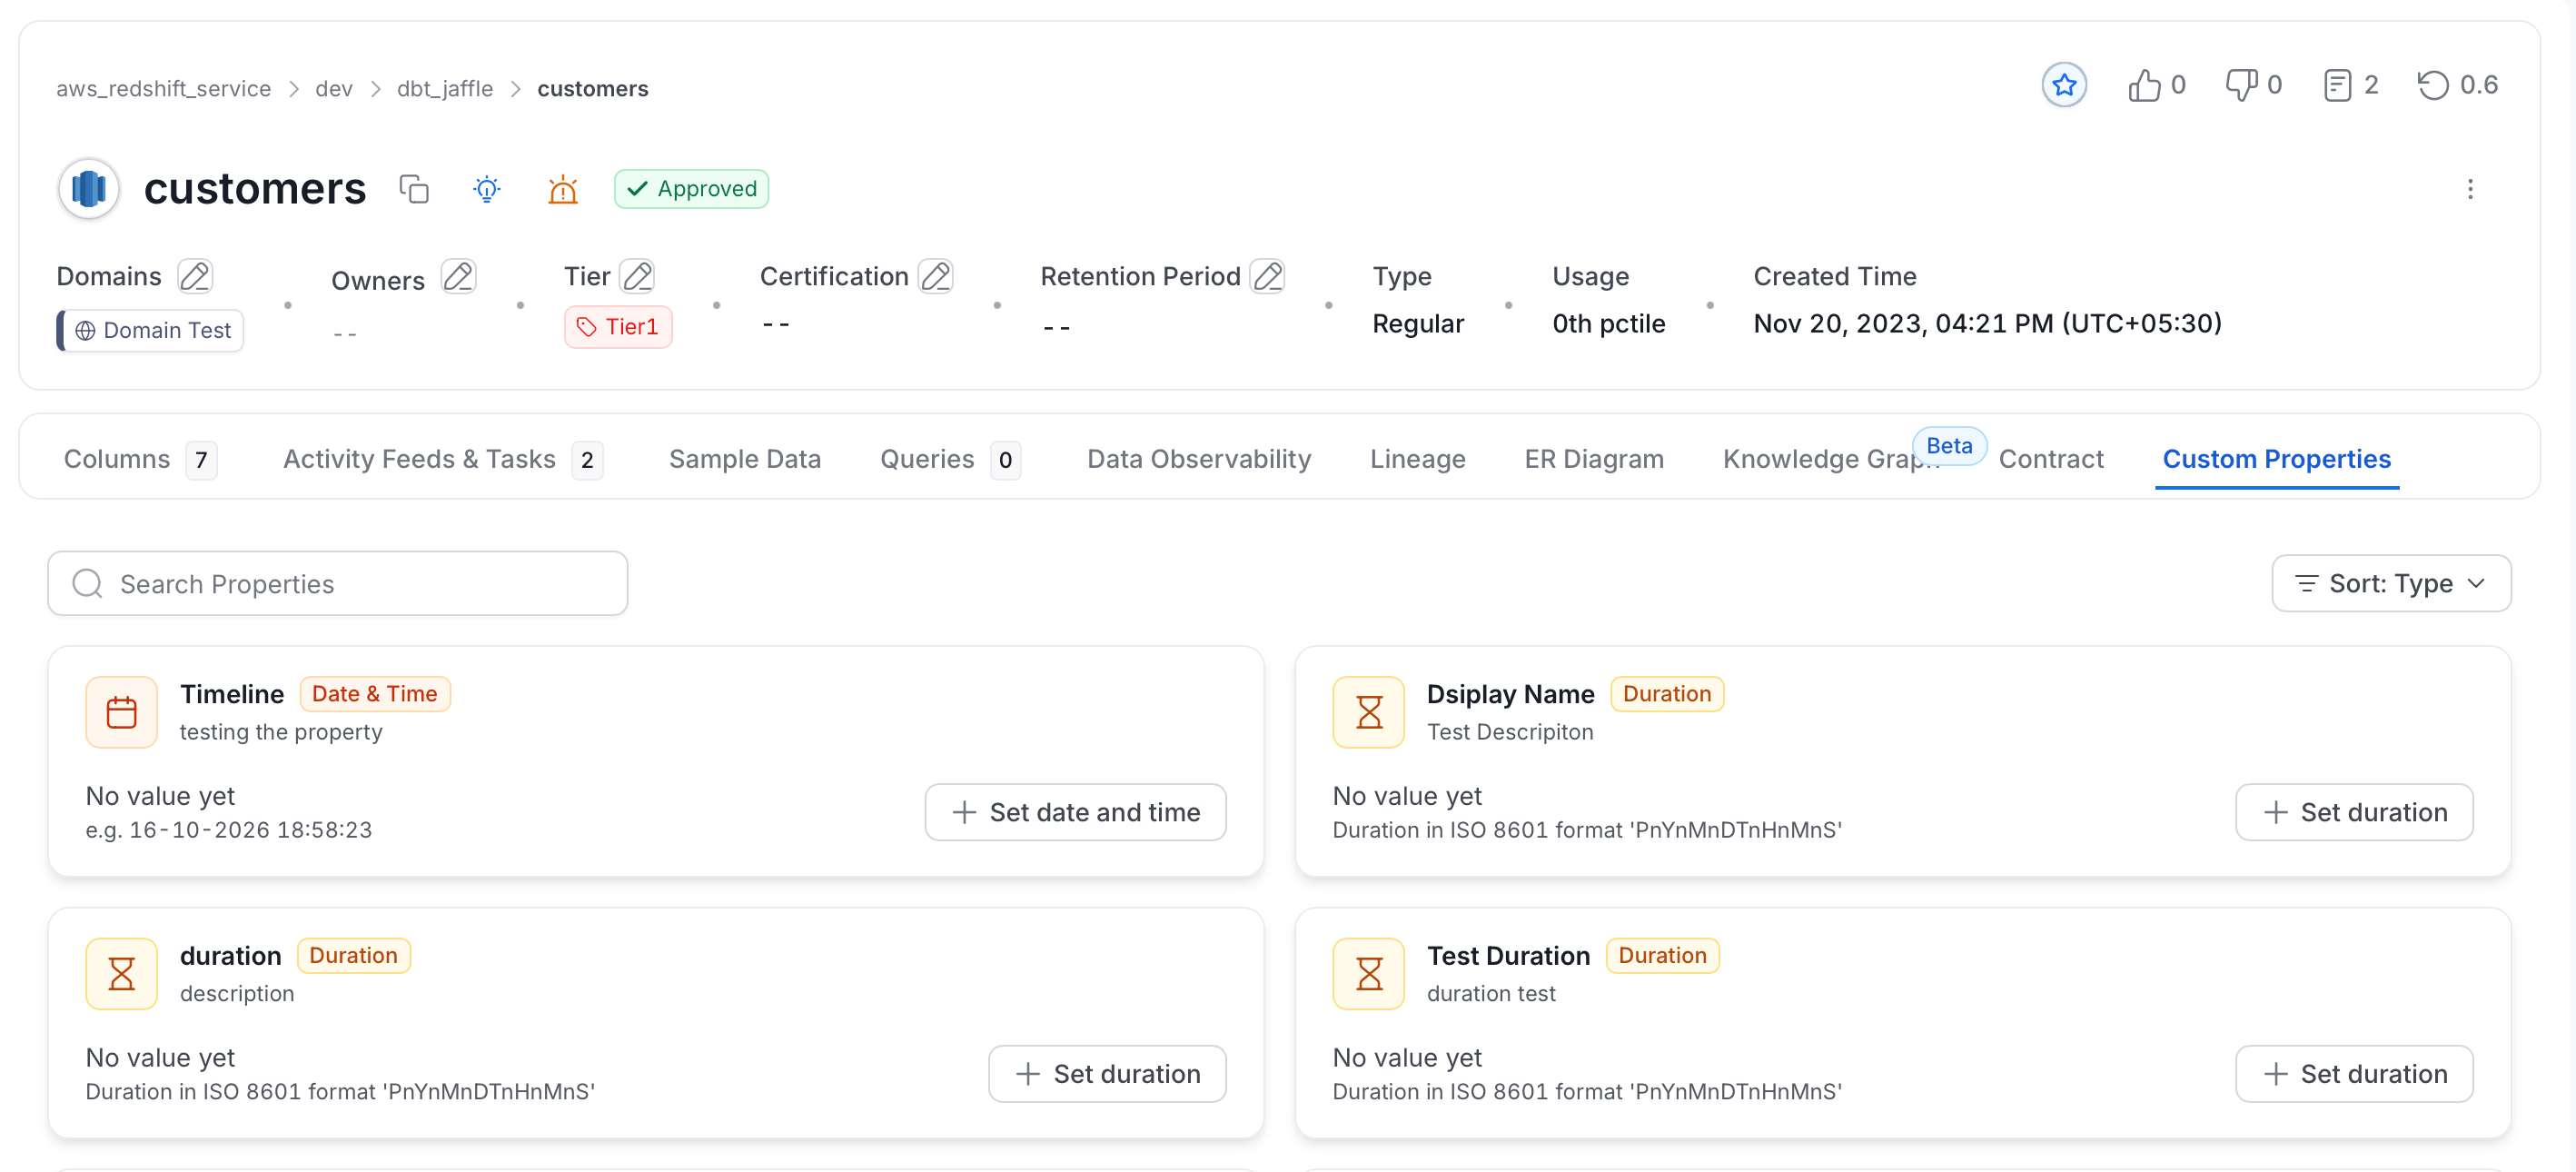
Config Tab
The Config tab is displayed only for Topics.Details Tab
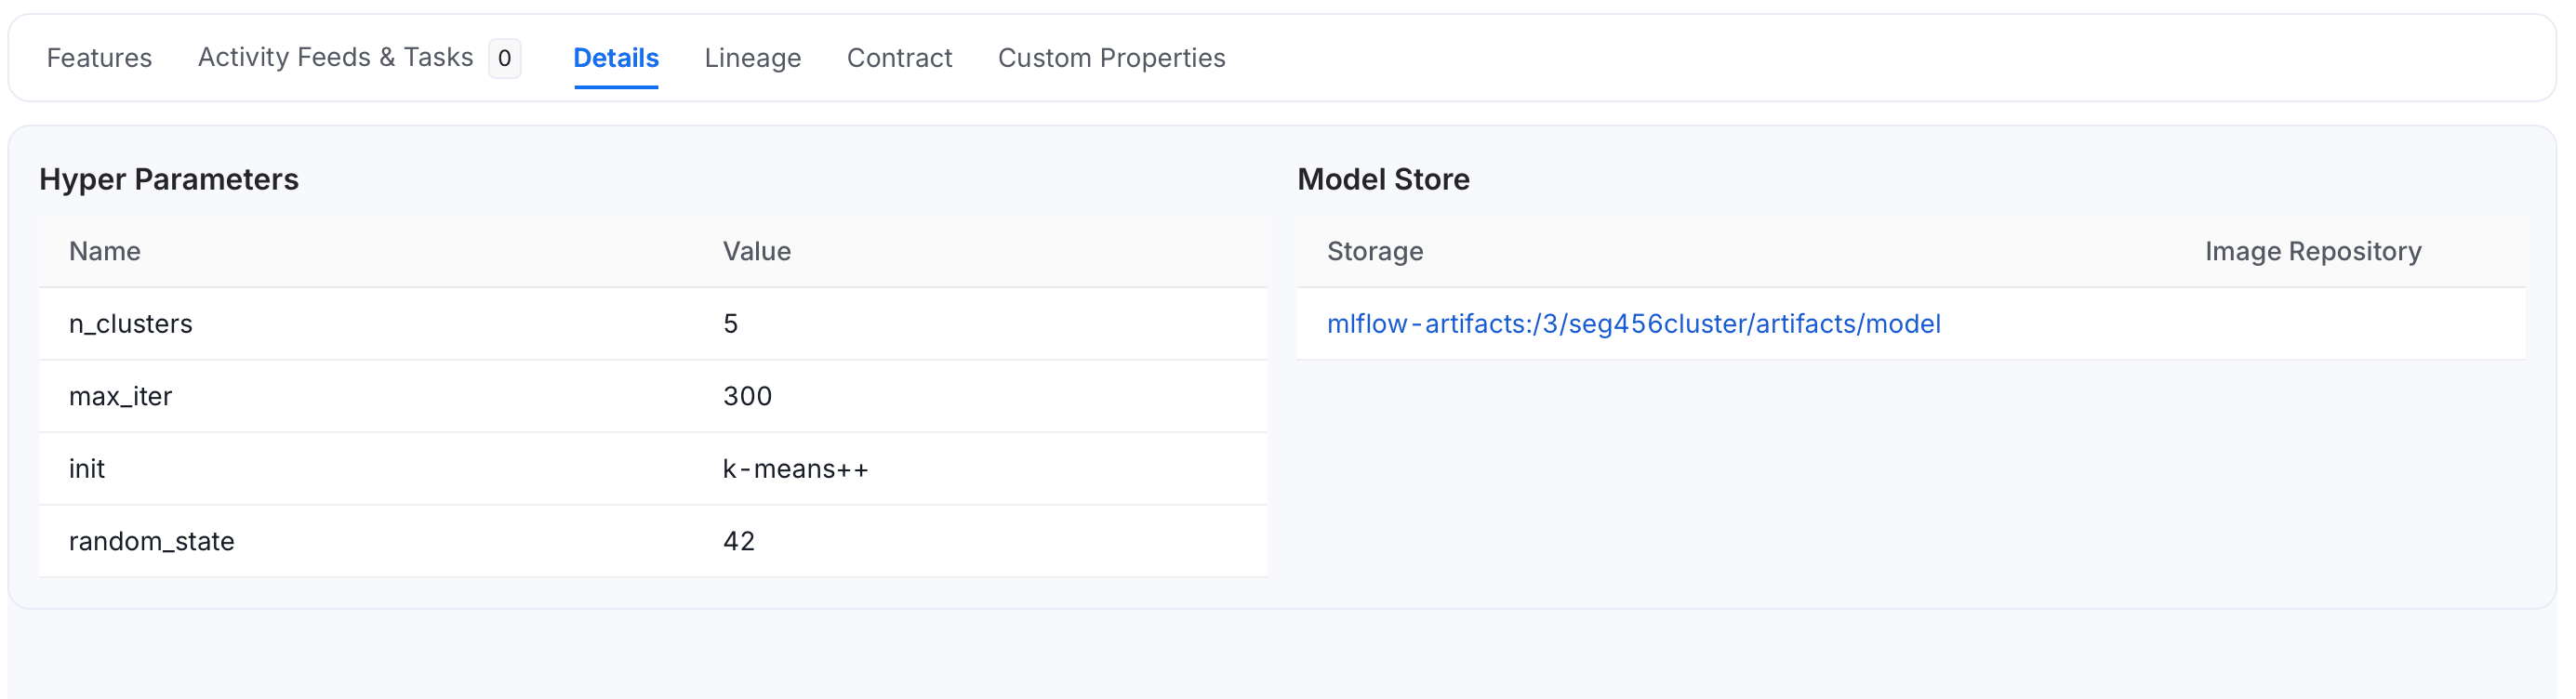
The Details tab is displayed only for Dashboards and ML Models. In case of Dashboards, the Details tab displays the chart name, type of chart, and description of the chart. It also displays the associated tags for each chart.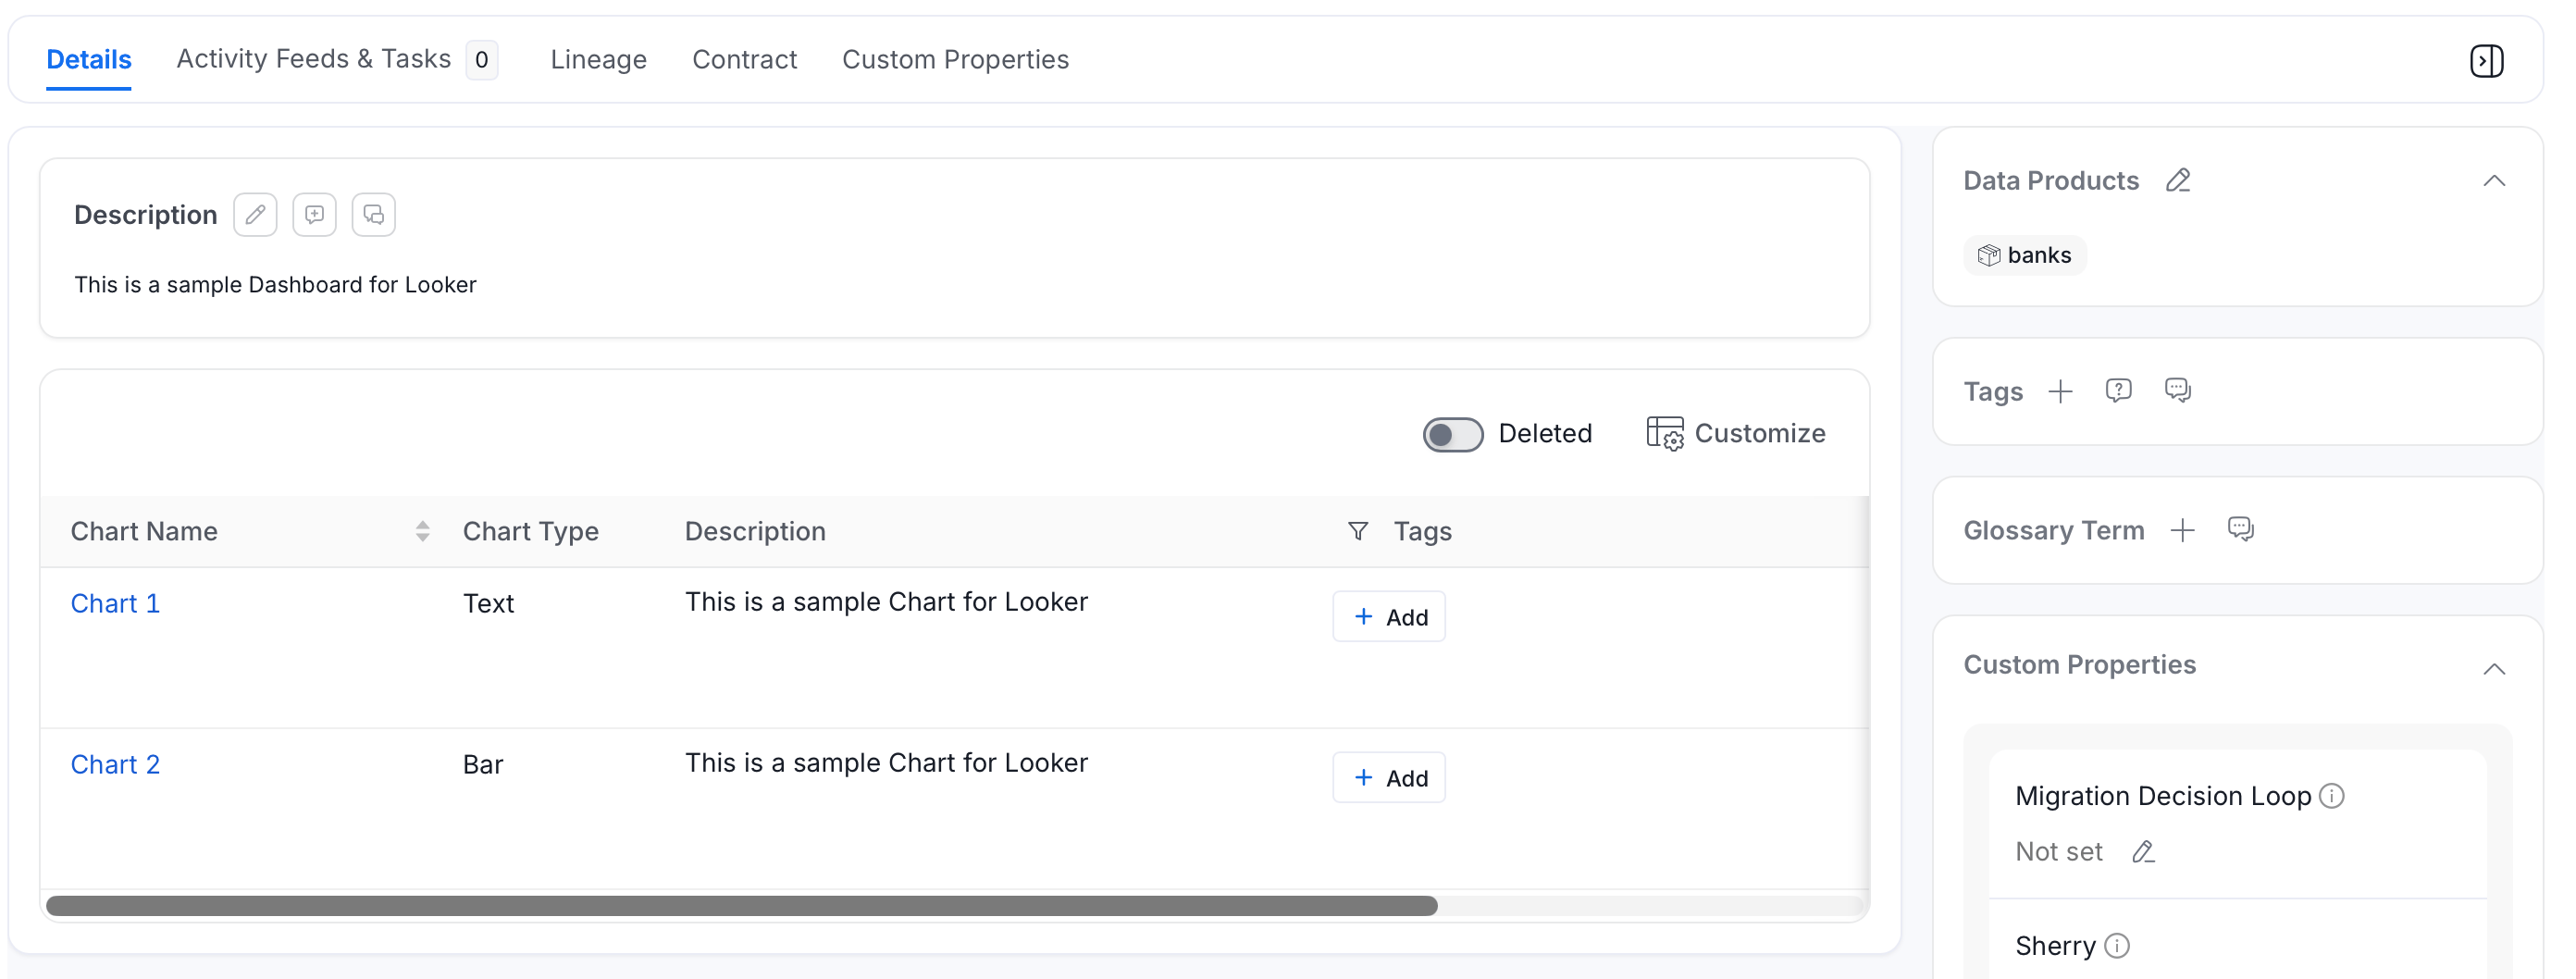
Executions Tab
The Executions tab is displayed only for Pipelines. It displays the Date, Time, and Status of the pipelines. You can get a quick glance of the status in terms of Success, Failure, Pending, and Aborted. The status can be viewed as a Chronological list or as a tree. You can filter by status as well as by date.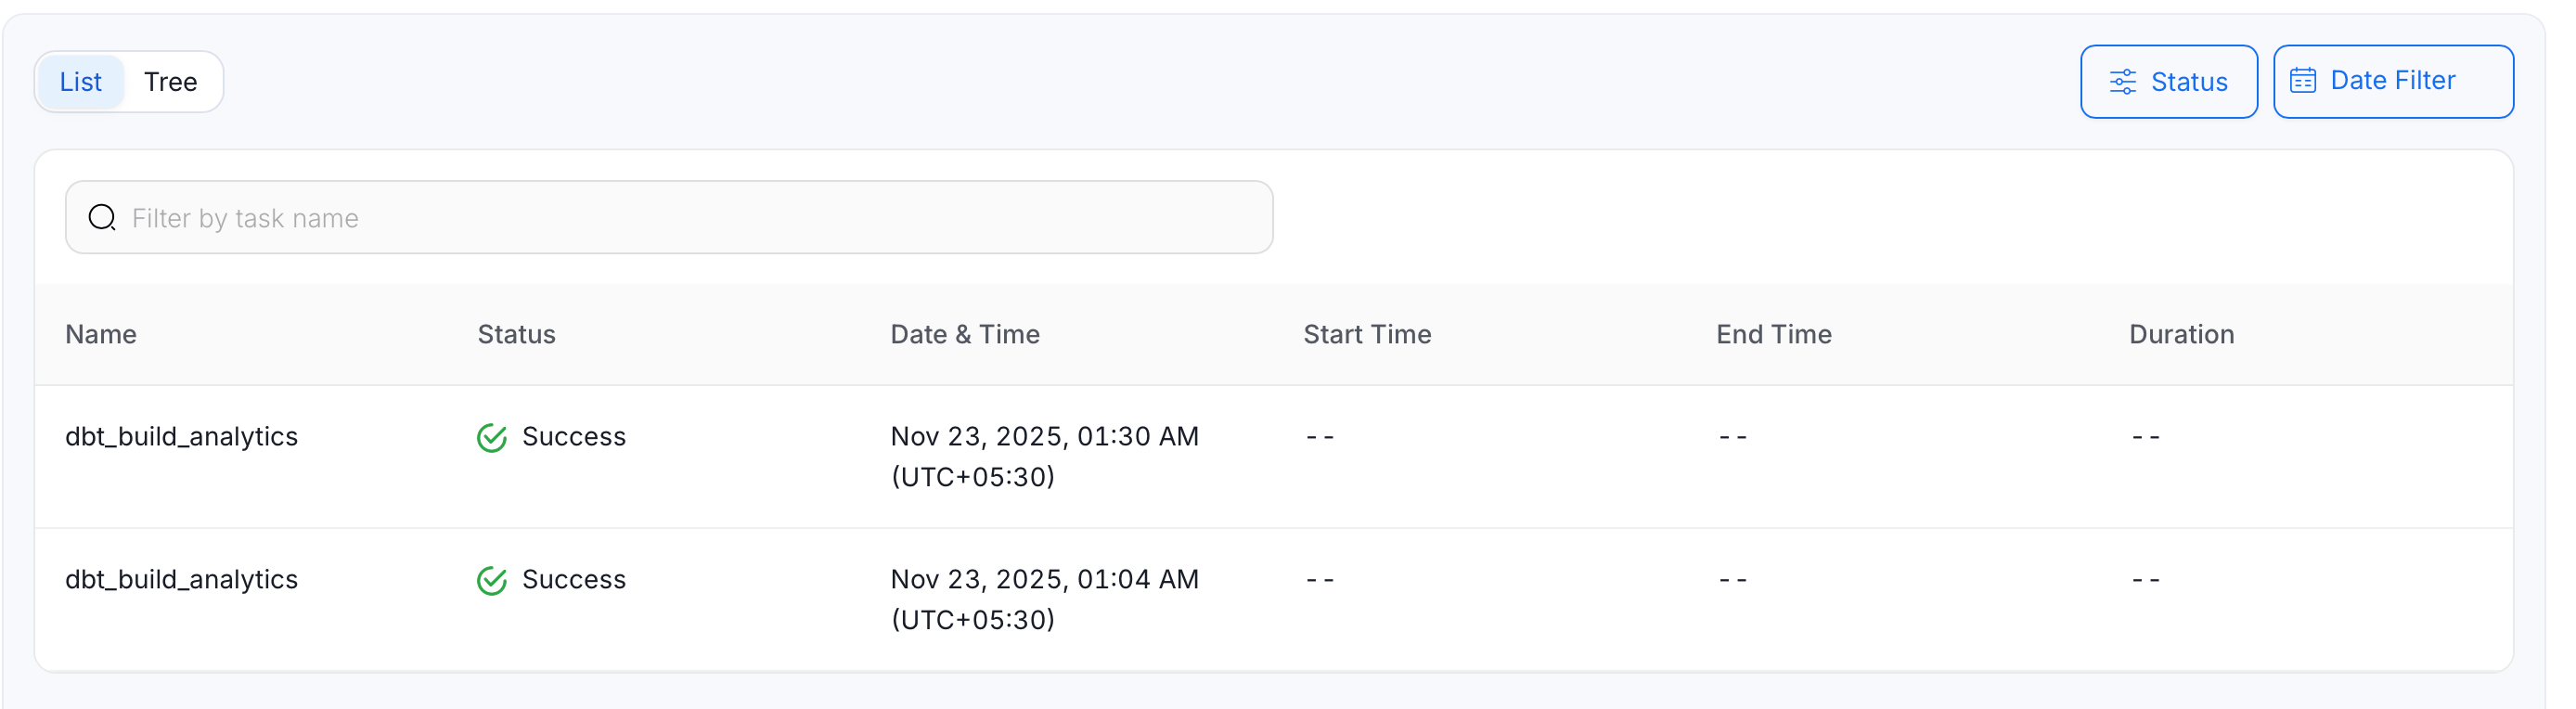
Features Tab
The Features tab is displayed only for ML Models. It displays a Description of the ML Model, and the features that have been used. Each feature will have further details on the Type of feature, Algorithm, Description, Sources, and the associated Glossary Terms and Tags.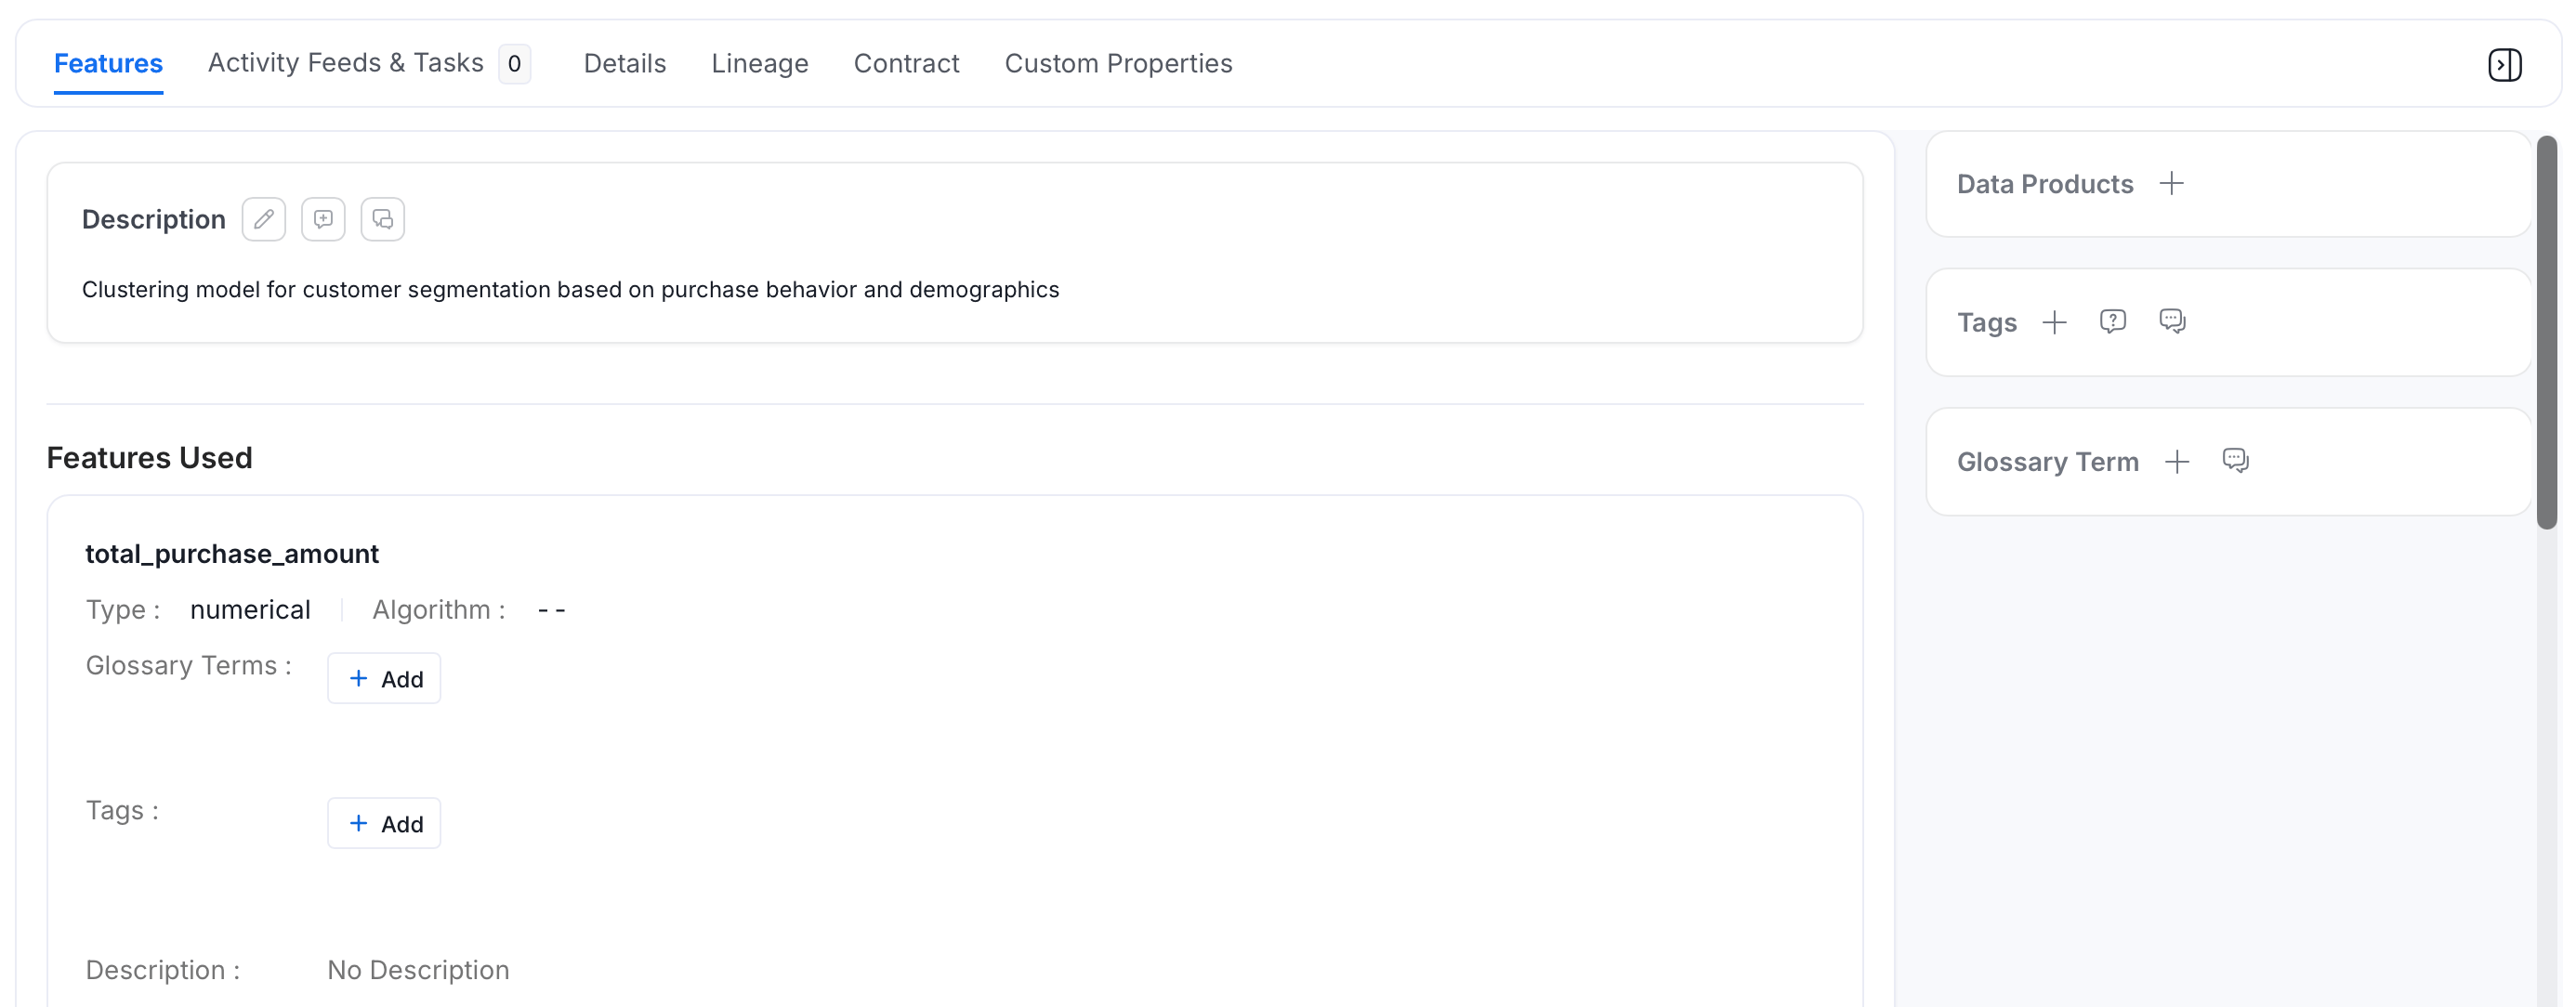
Children Tab
The Children tab is displayed only for Containers.Using Advanced Search
Create complex queries using advanced search.