
AI Analytics
AI Analytics is the dashboard layer of Collate’s AI experience. Ask a question in Collate AI Chat and Collate AI generates a chart automatically. Refine it with follow-up prompts (chart type, groupings, filters) until it shows what you need, then pin it to a dashboard. Pinned charts collect into dashboards that refresh automatically and deliver results to your team on a schedule.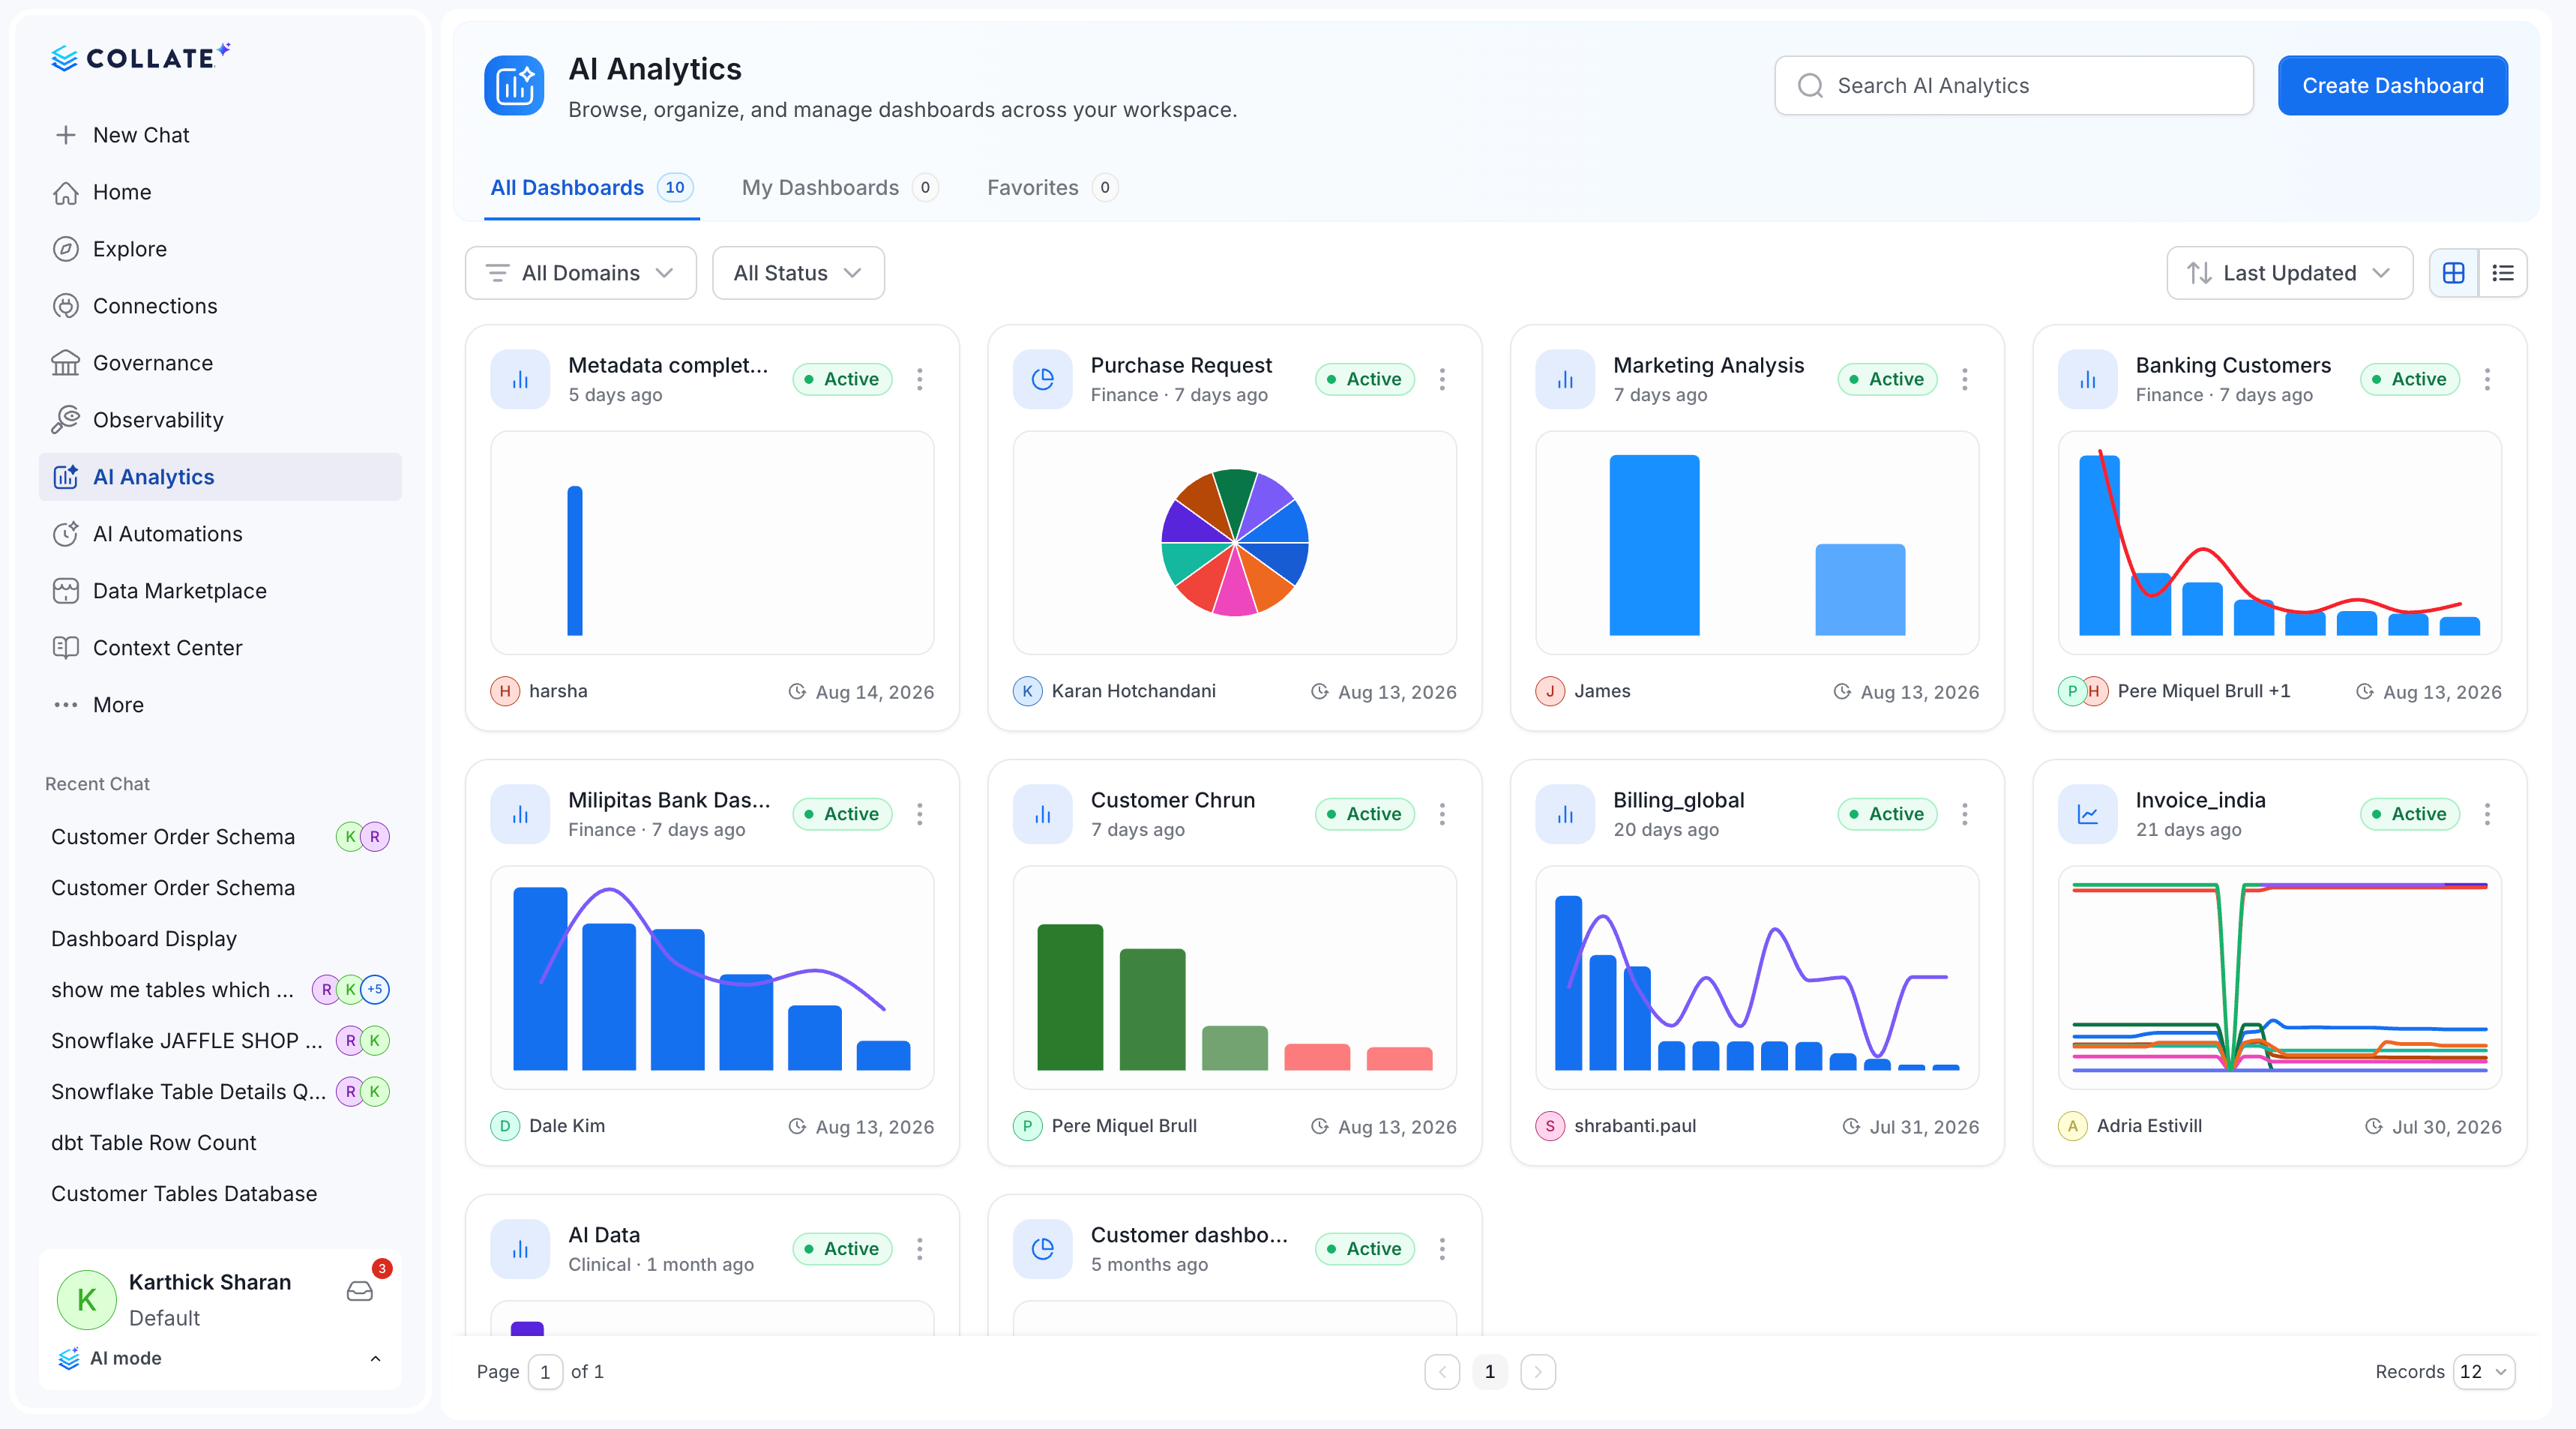
What You Can Do
- Collect pinned charts from any Collate AI Chat conversation into named dashboards.
- Schedule dashboards to re-run their queries automatically — every few minutes, hours, days, or weeks.
- Deliver a PDF snapshot to your team by email or Slack each time a scheduled refresh completes.
- Control access with Private, Shared, or Public visibility.
- Export any dashboard as a CSV or PNG.
- View chart build history — trace any chart back to the conversation, SQL, and reasoning that produced it.
Before You Start
- Collate AI must be enabled in your workspace. Contact your admin if you’re unsure.
- Data sources need to be connected in Collate so Collate AI can generate charts against them.
- Charts are created in Collate AI Chat conversations. See Working with Charts to generate and pin your first chart.
AI Analytics Dashboards
Once you’ve pinned charts, they live on an AI Analytics dashboard — a named collection you can share, schedule, and revisit. To access the AI Analytics page, select AI Analytics from the left navigation menu.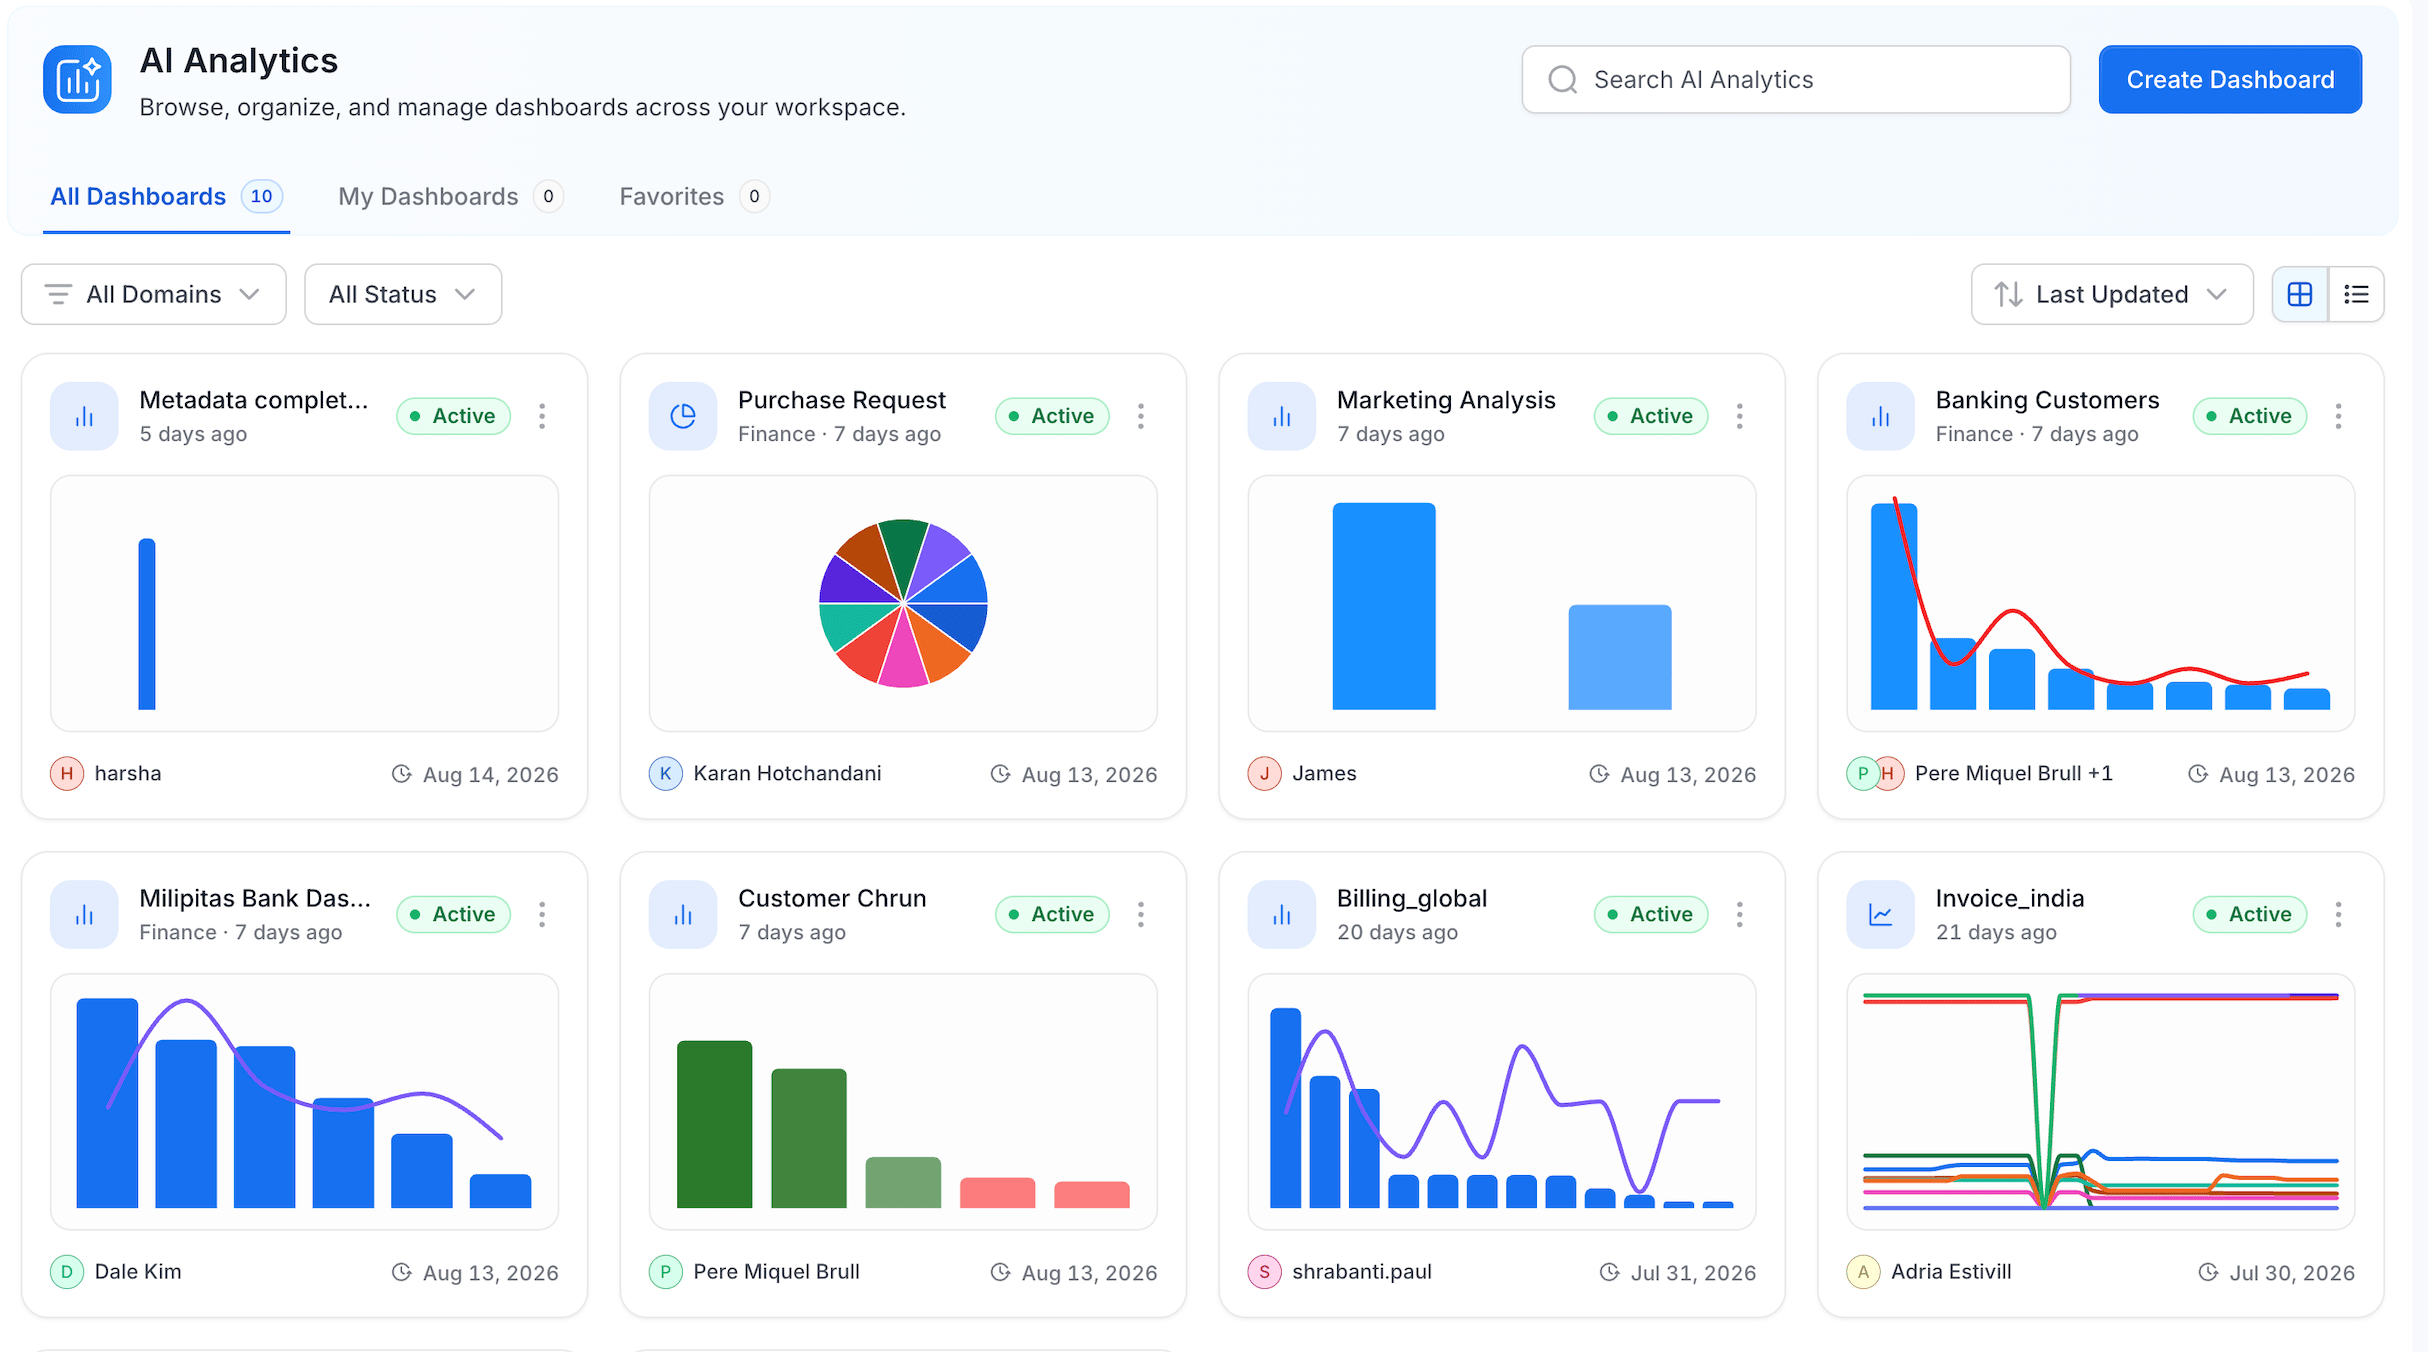
Tabs
Views and Filters
Toggle between Card and Row view. Filter by Domain or Status (Draft, Active), and sort by Last Updated or Name. Card view — each dashboard as a visual card with a chart preview thumbnail, status badge, owner avatar, and last-updated timestamp.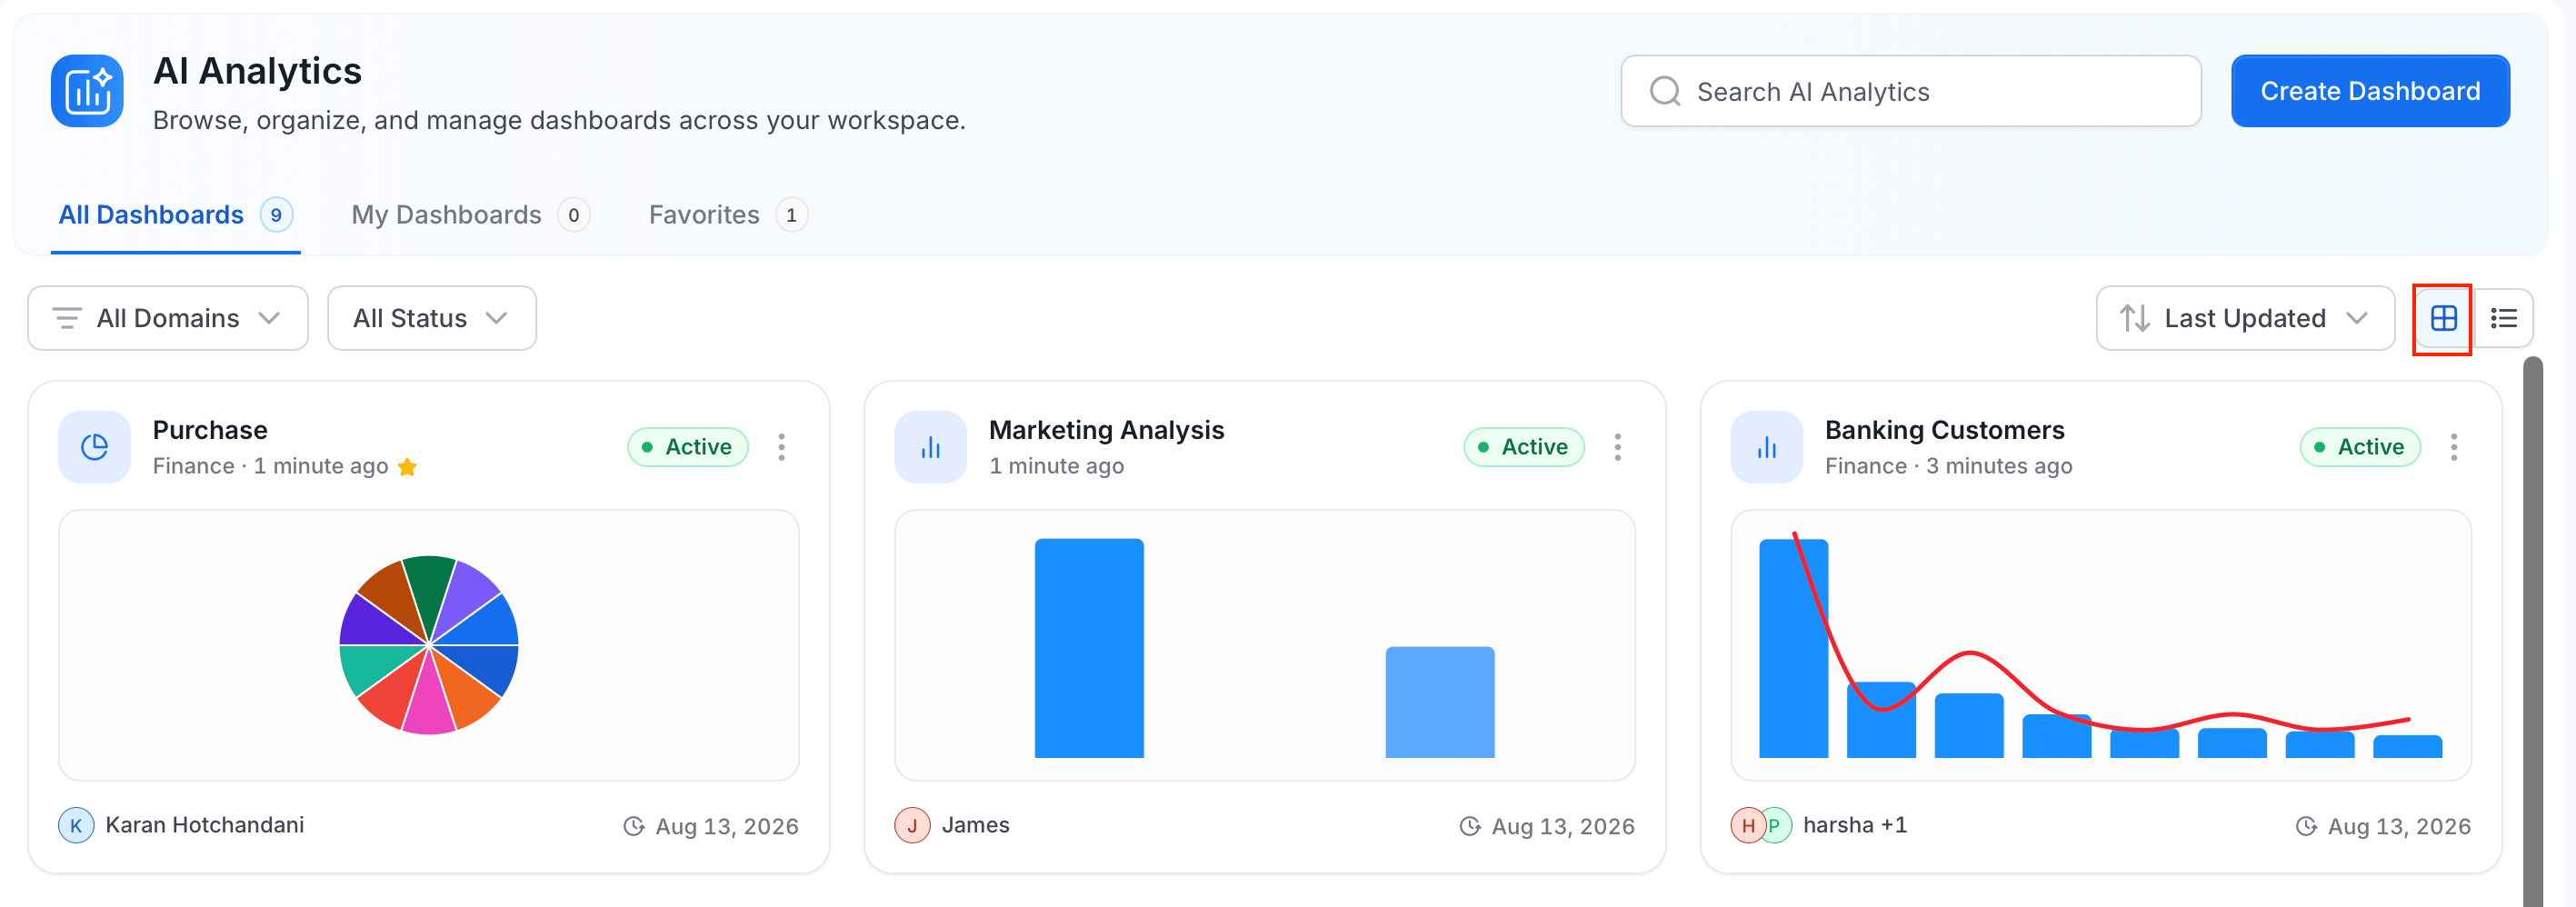
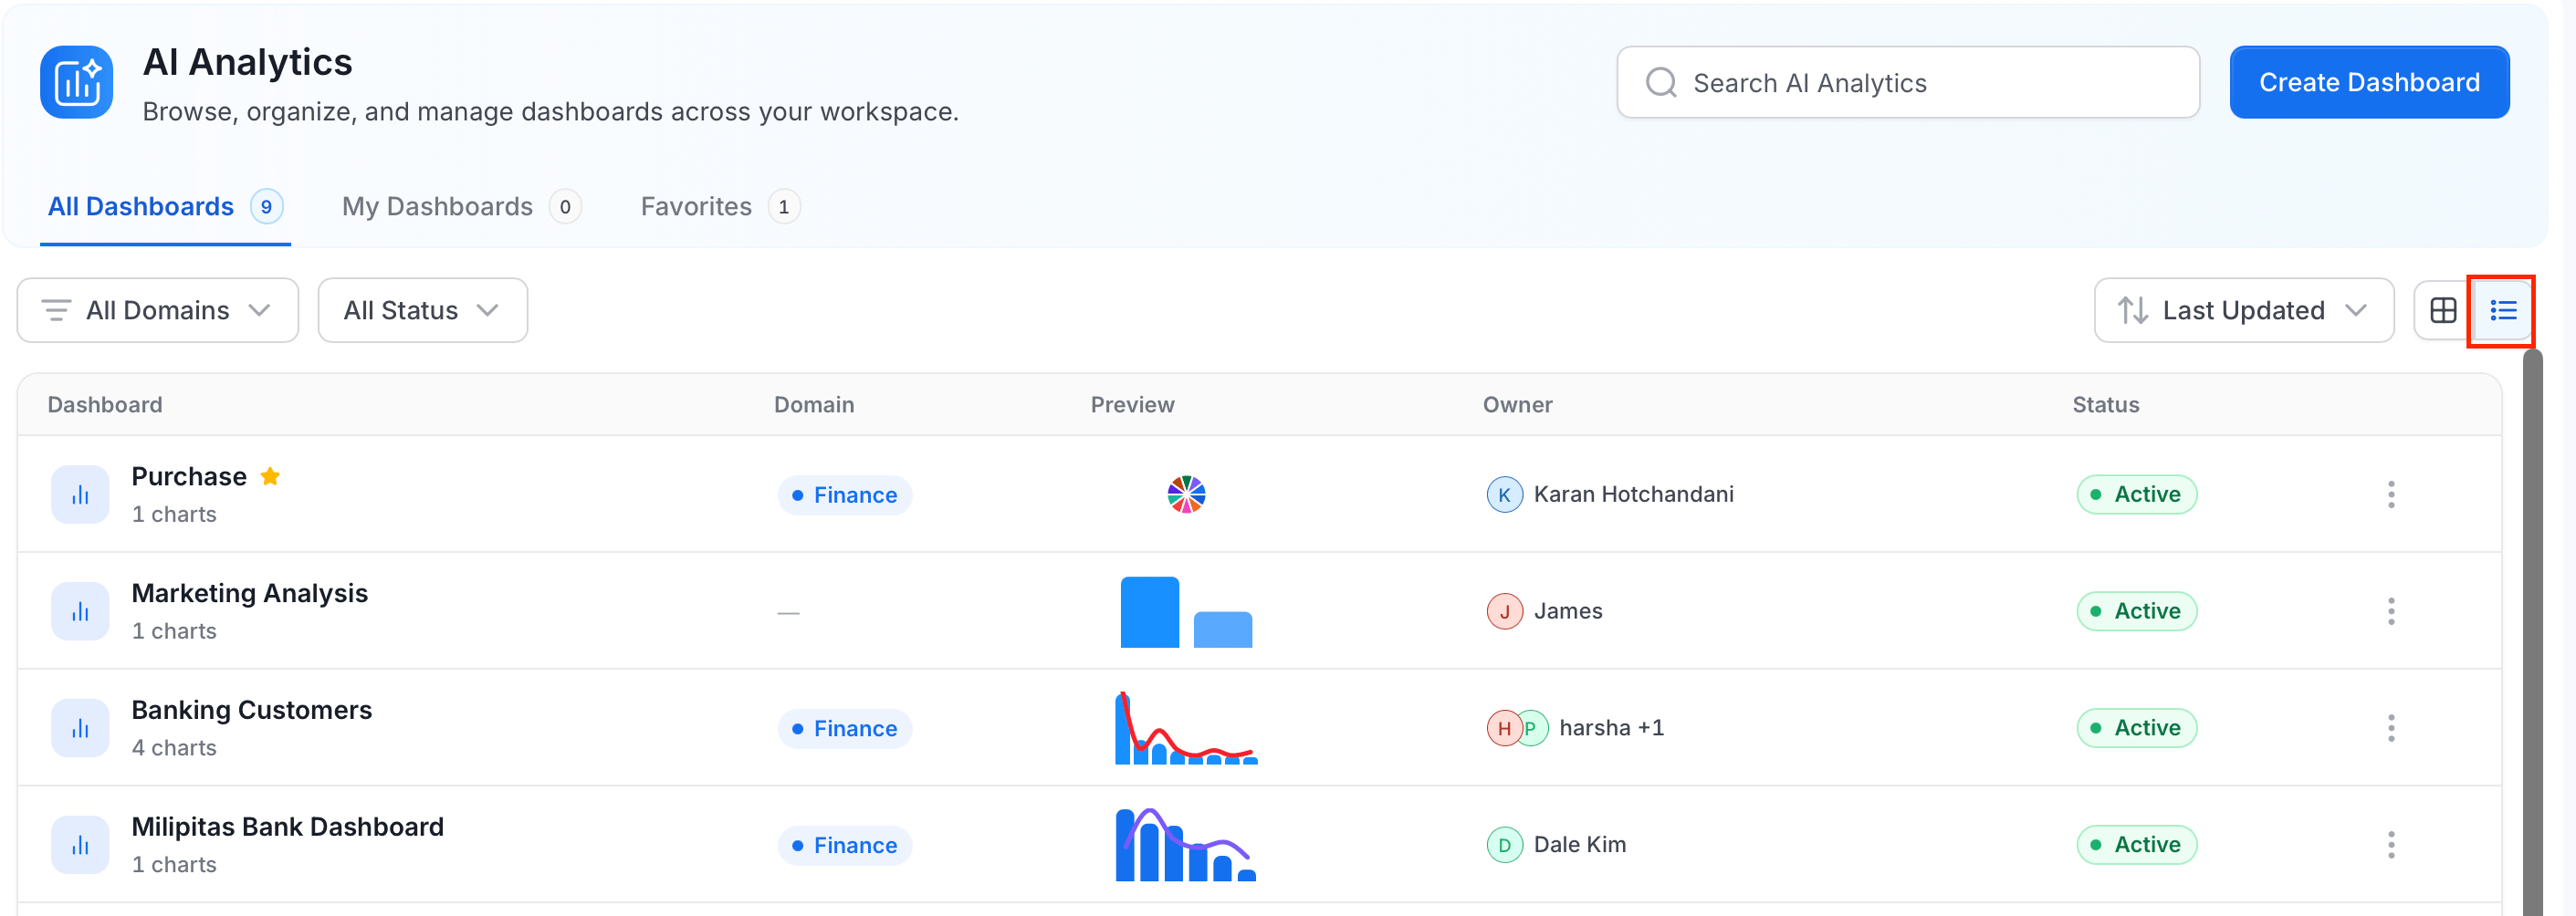
Dashboard Status
Chart Build History
Every chart on a dashboard links back to the Collate AI conversation that produced it — the questions asked, the SQL that ran, and the AI reasoning. Click Build History on a chart to open its provenance. Control whether this is visible to dashboard viewers or private to owners from the dashboard’s sharing settings. See Dashboards for the full dashboard detail page reference.Schedule and Deliver Dashboards
Once a dashboard has charts, you can schedule it to refresh automatically and deliver results to your team.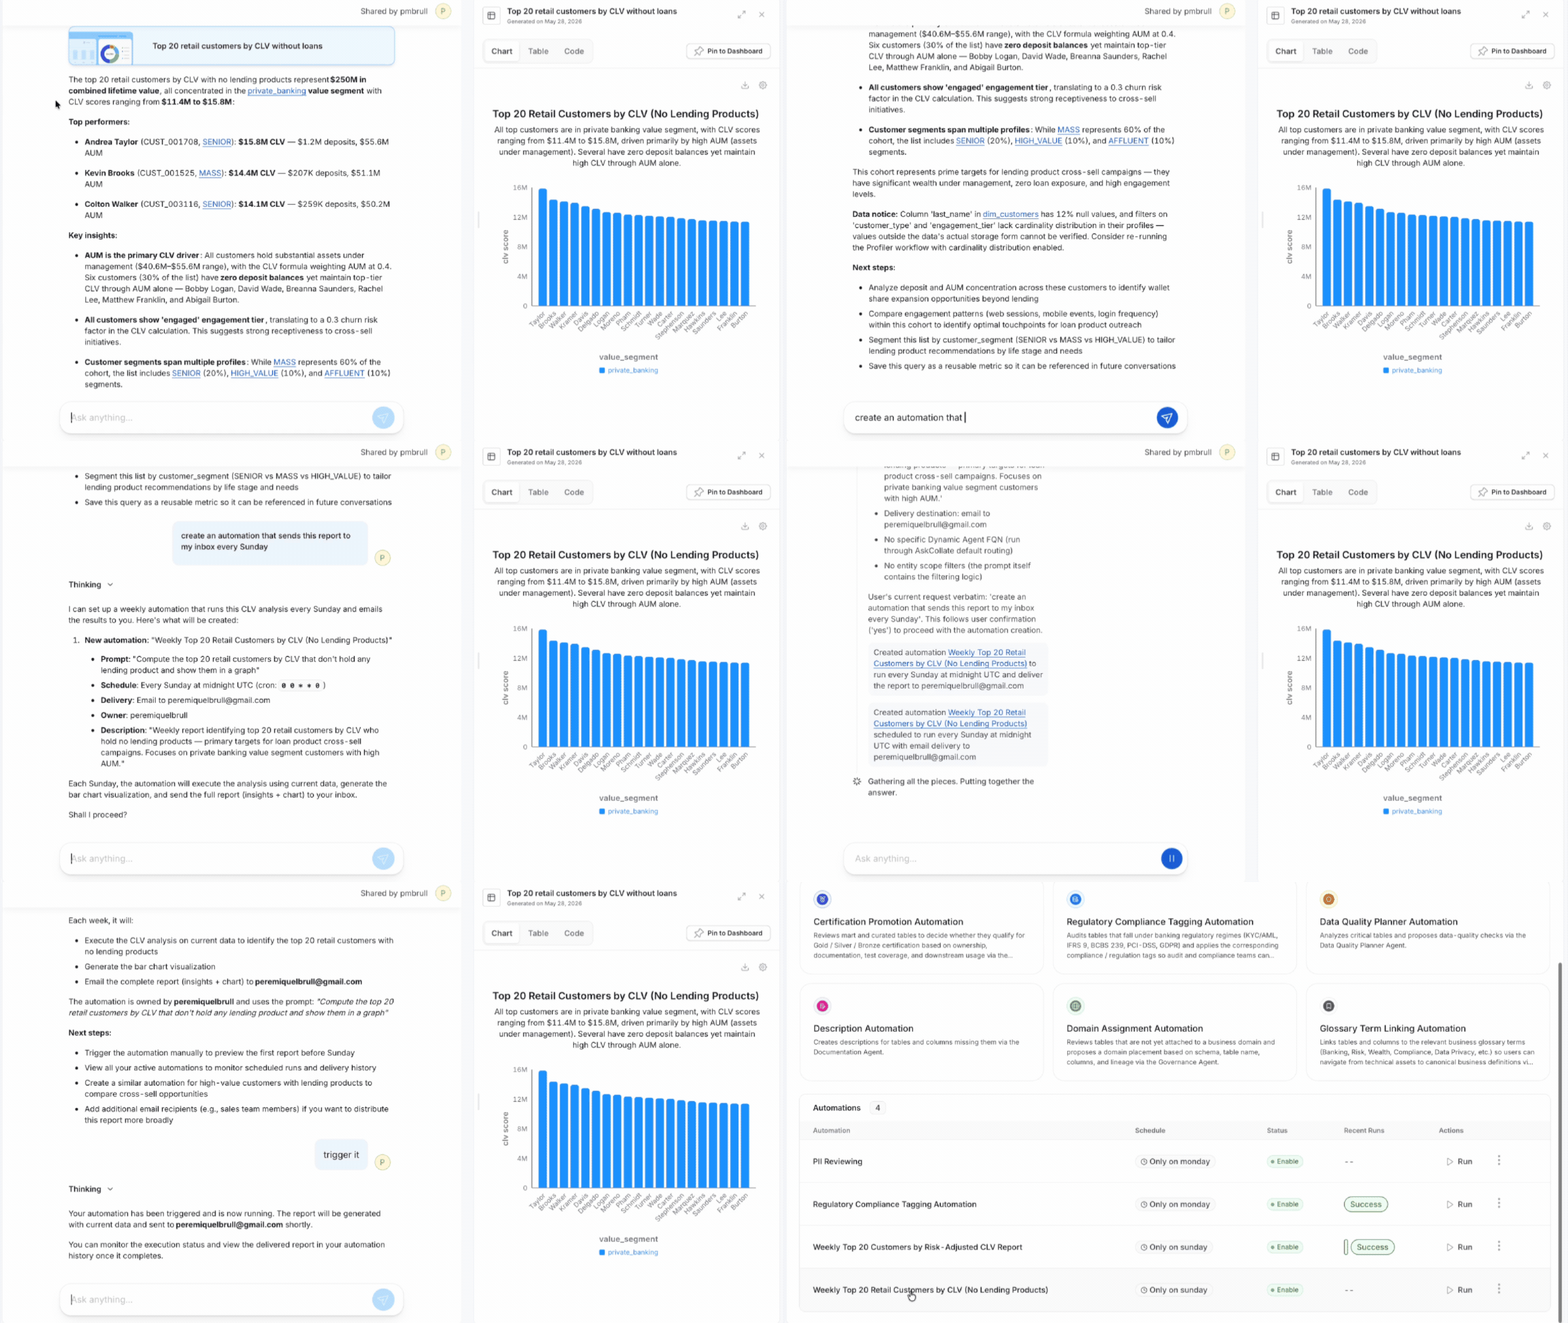
Schedule a Refresh
- Open a dashboard and click ⋮ > Schedule.
- Set the cadence — every N minutes, hours, days, or weeks — and the time and timezone for daily or weekly runs.
- Click Save Changes.
Deliver to Your Team
After setting a schedule, configure delivery destinations so your team gets a snapshot automatically after each refresh. Click Share on a dashboard, then add one or more destinations:Note: Sending PDF attachments to Slack requires an OAuth bot token. A standard incoming webhook cannot deliver file attachments. Contact your Slack admin to configure the OAuth bot for Collate.
Why AI Analytics?
Best Practices
- Be specific about time ranges, groups, or breakdowns — the more specific your question, the better the first chart.
- Pin charts as you go so useful results are easier to find than scrolling back through conversation history.
- Use a dedicated service account as the refresh identity for scheduled dashboards so refreshes do not break when individual users rotate credentials.
- Schedule refreshes during off-peak hours for your data warehouse to avoid competing with production workloads.
- Turn on notifications for dashboards your team checks regularly — the PDF lands in email or Slack so stakeholders get the update without logging in.
Troubleshooting
- Can’t access a dataset? Check that your access request was approved on the Marketplace page.
- Numbers look wrong? Every chart includes the query, raw results, and reasoning steps — check those first.
- Answers seem incomplete? Verify that recent metadata and lineage ingestion runs succeeded.
- Getting inconsistent results? Try being more specific — mention the exact dataset, metric name, or time range. Enriching column descriptions, glossary terms, and business metrics gives Collate AI the context it needs for accurate, consistent answers.