Understanding the Basics of Collate
Let’s Start with ‘My Data’ Page
Once you login to Collate, you can start exploring from the widget-rich ‘My Data’ page. My Data provides a single pane view of all your data assets, collaboration updates, data insights and more. This landing page comprises of widgets for Activity Feeds, Data Insights, Announcements, and other data asset related widgets.Activity Feed Widget
The main section consists of the Activity Feed Widget.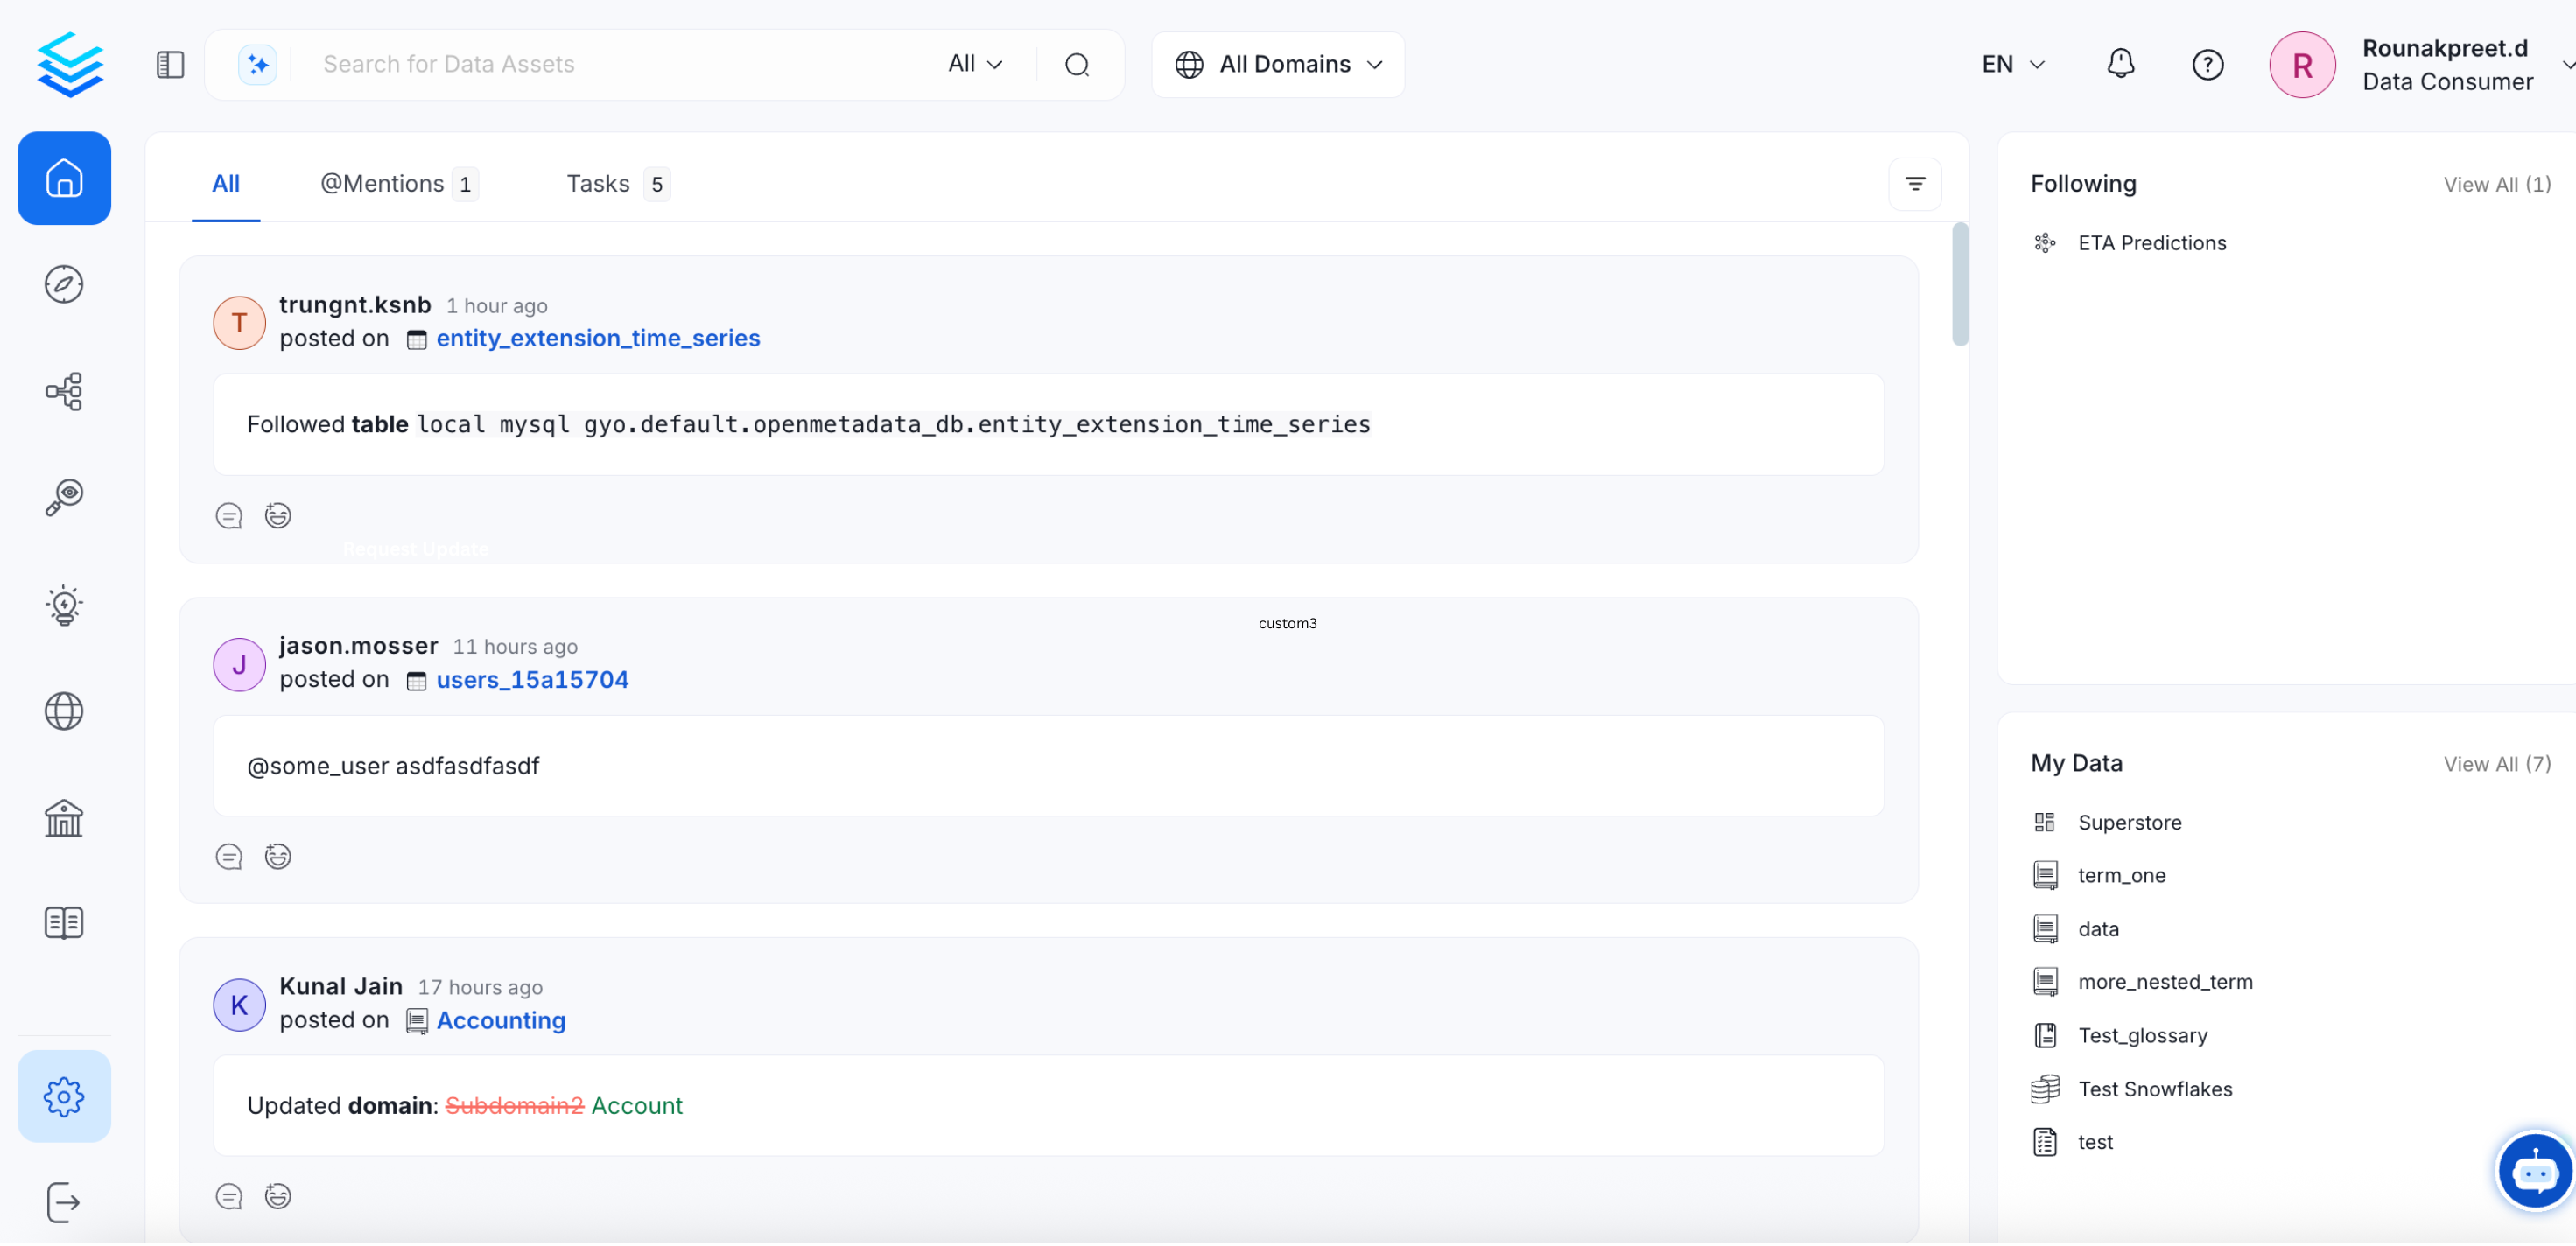
- All: All the activities related to the data assets that you own, follow, or where you are mentioned
- @Mentions: Feeds where you are mentioned
- Tasks: Tasks created by you, or assigned to you are displayed. Only the Open tasks are displayed here.
My Data Widget
A quick glance at the My Data Widget will display all the data assets that you own. In case, you or your team does not own any data assets, you can start claiming the assets from the Explore page.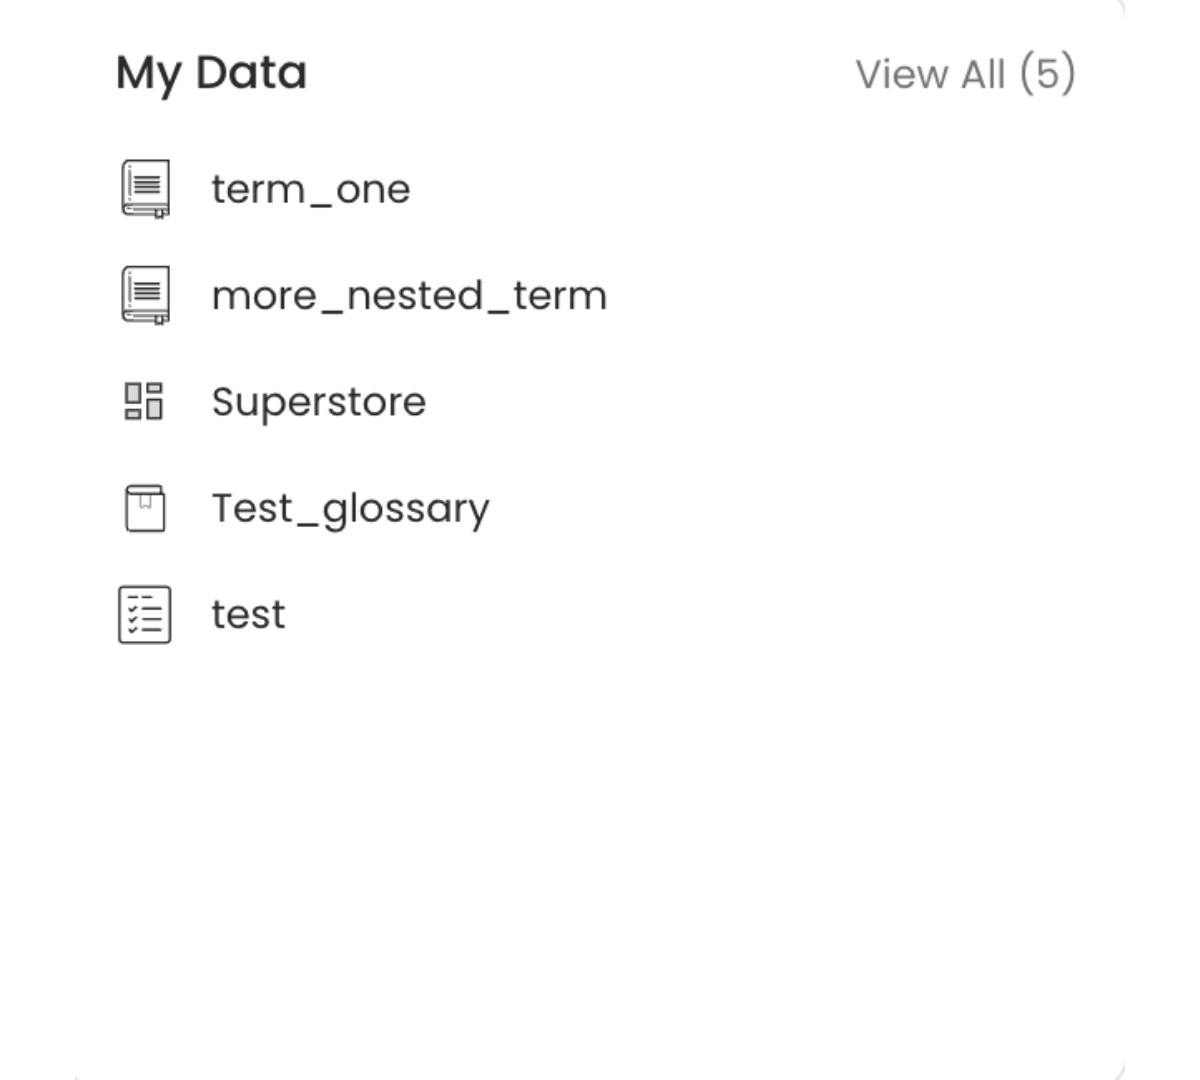
Key Performance Indicators (KPI) Widget
The KPI widget is accessible to Admins only. Other users can also be given access to the KPI widget. The KPI widget gives ready information about the data asset ownership coverage, description coverage, and tiering.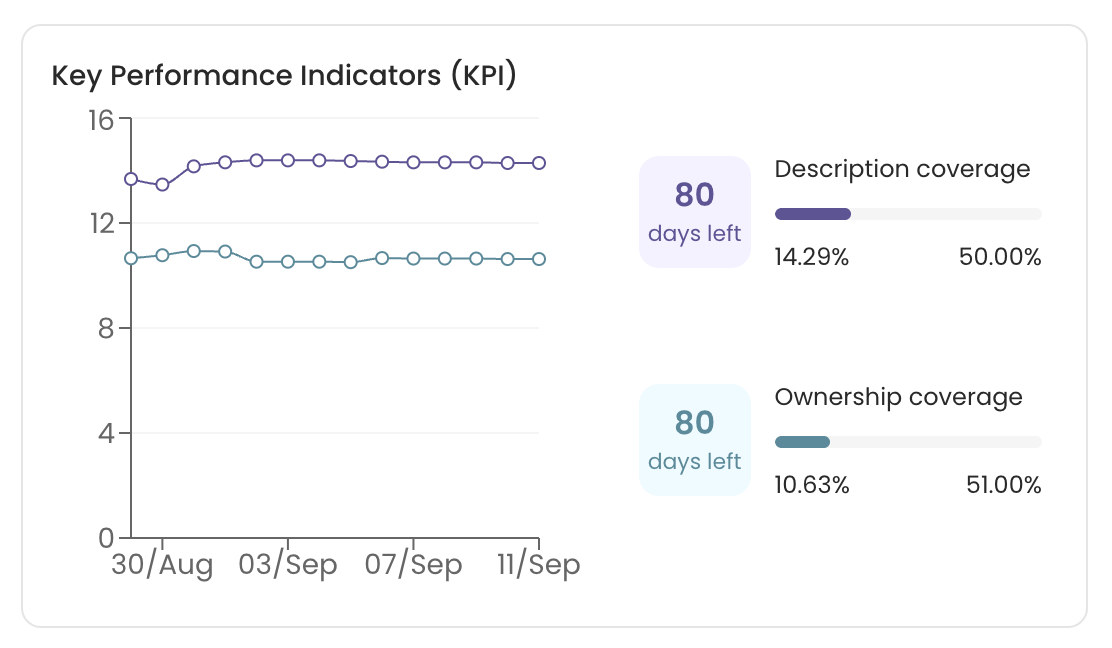
Total Data Assets Widget
This widget displays the trend of the total data assets in the last 14 days. It displays the total Tables, Dashboards, Databases, Database Schemas, Pipelines, Topics, MLModels, Charts, etc. Users can quickly identify the most populated data assets. In the below example, the organization has more Tables when compared to any other data asset.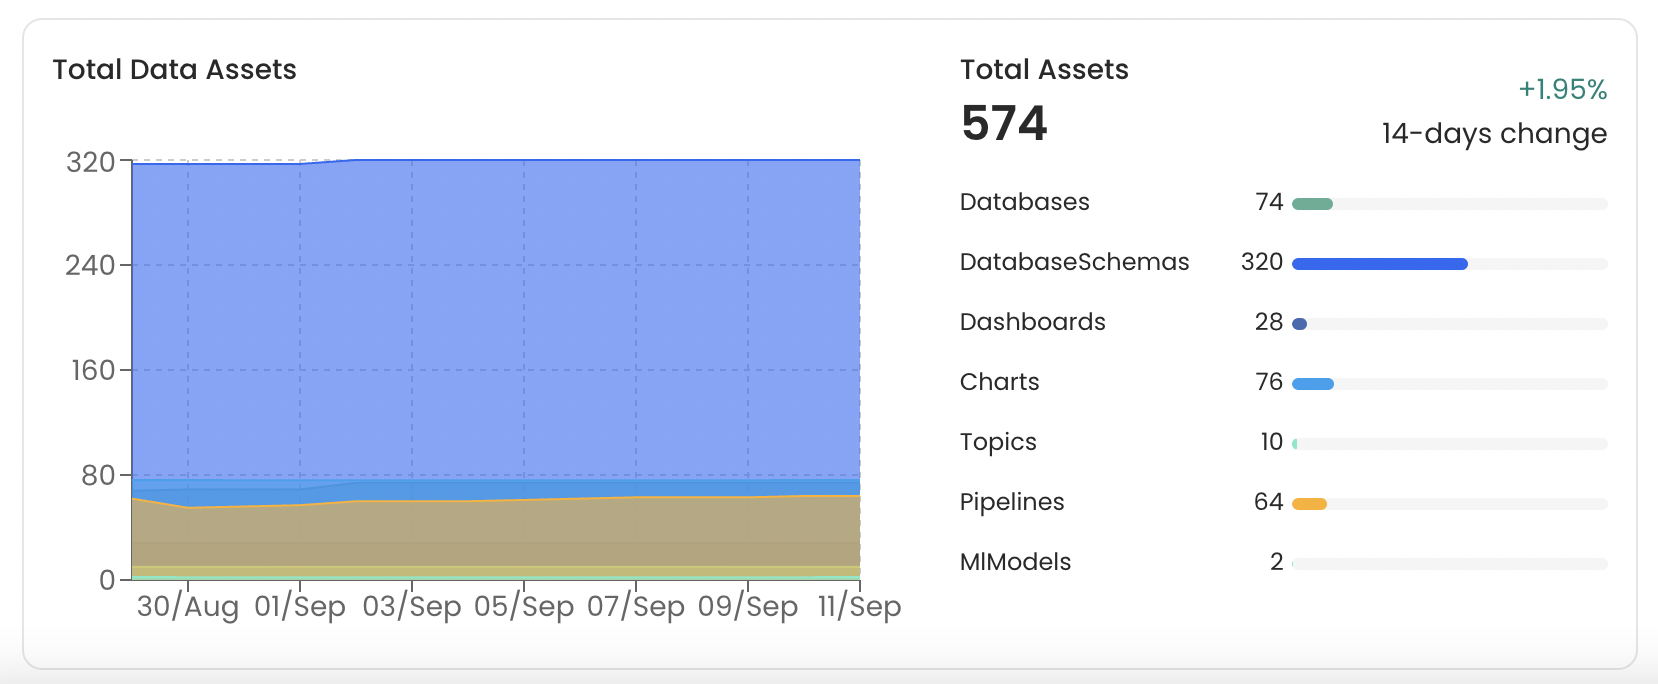
Announcements, Following, and Recent Views
The right-side panel of the ‘My Data’ page displays the Recent Announcements, the data assets that you are Following, and the Recently Viewed data assets.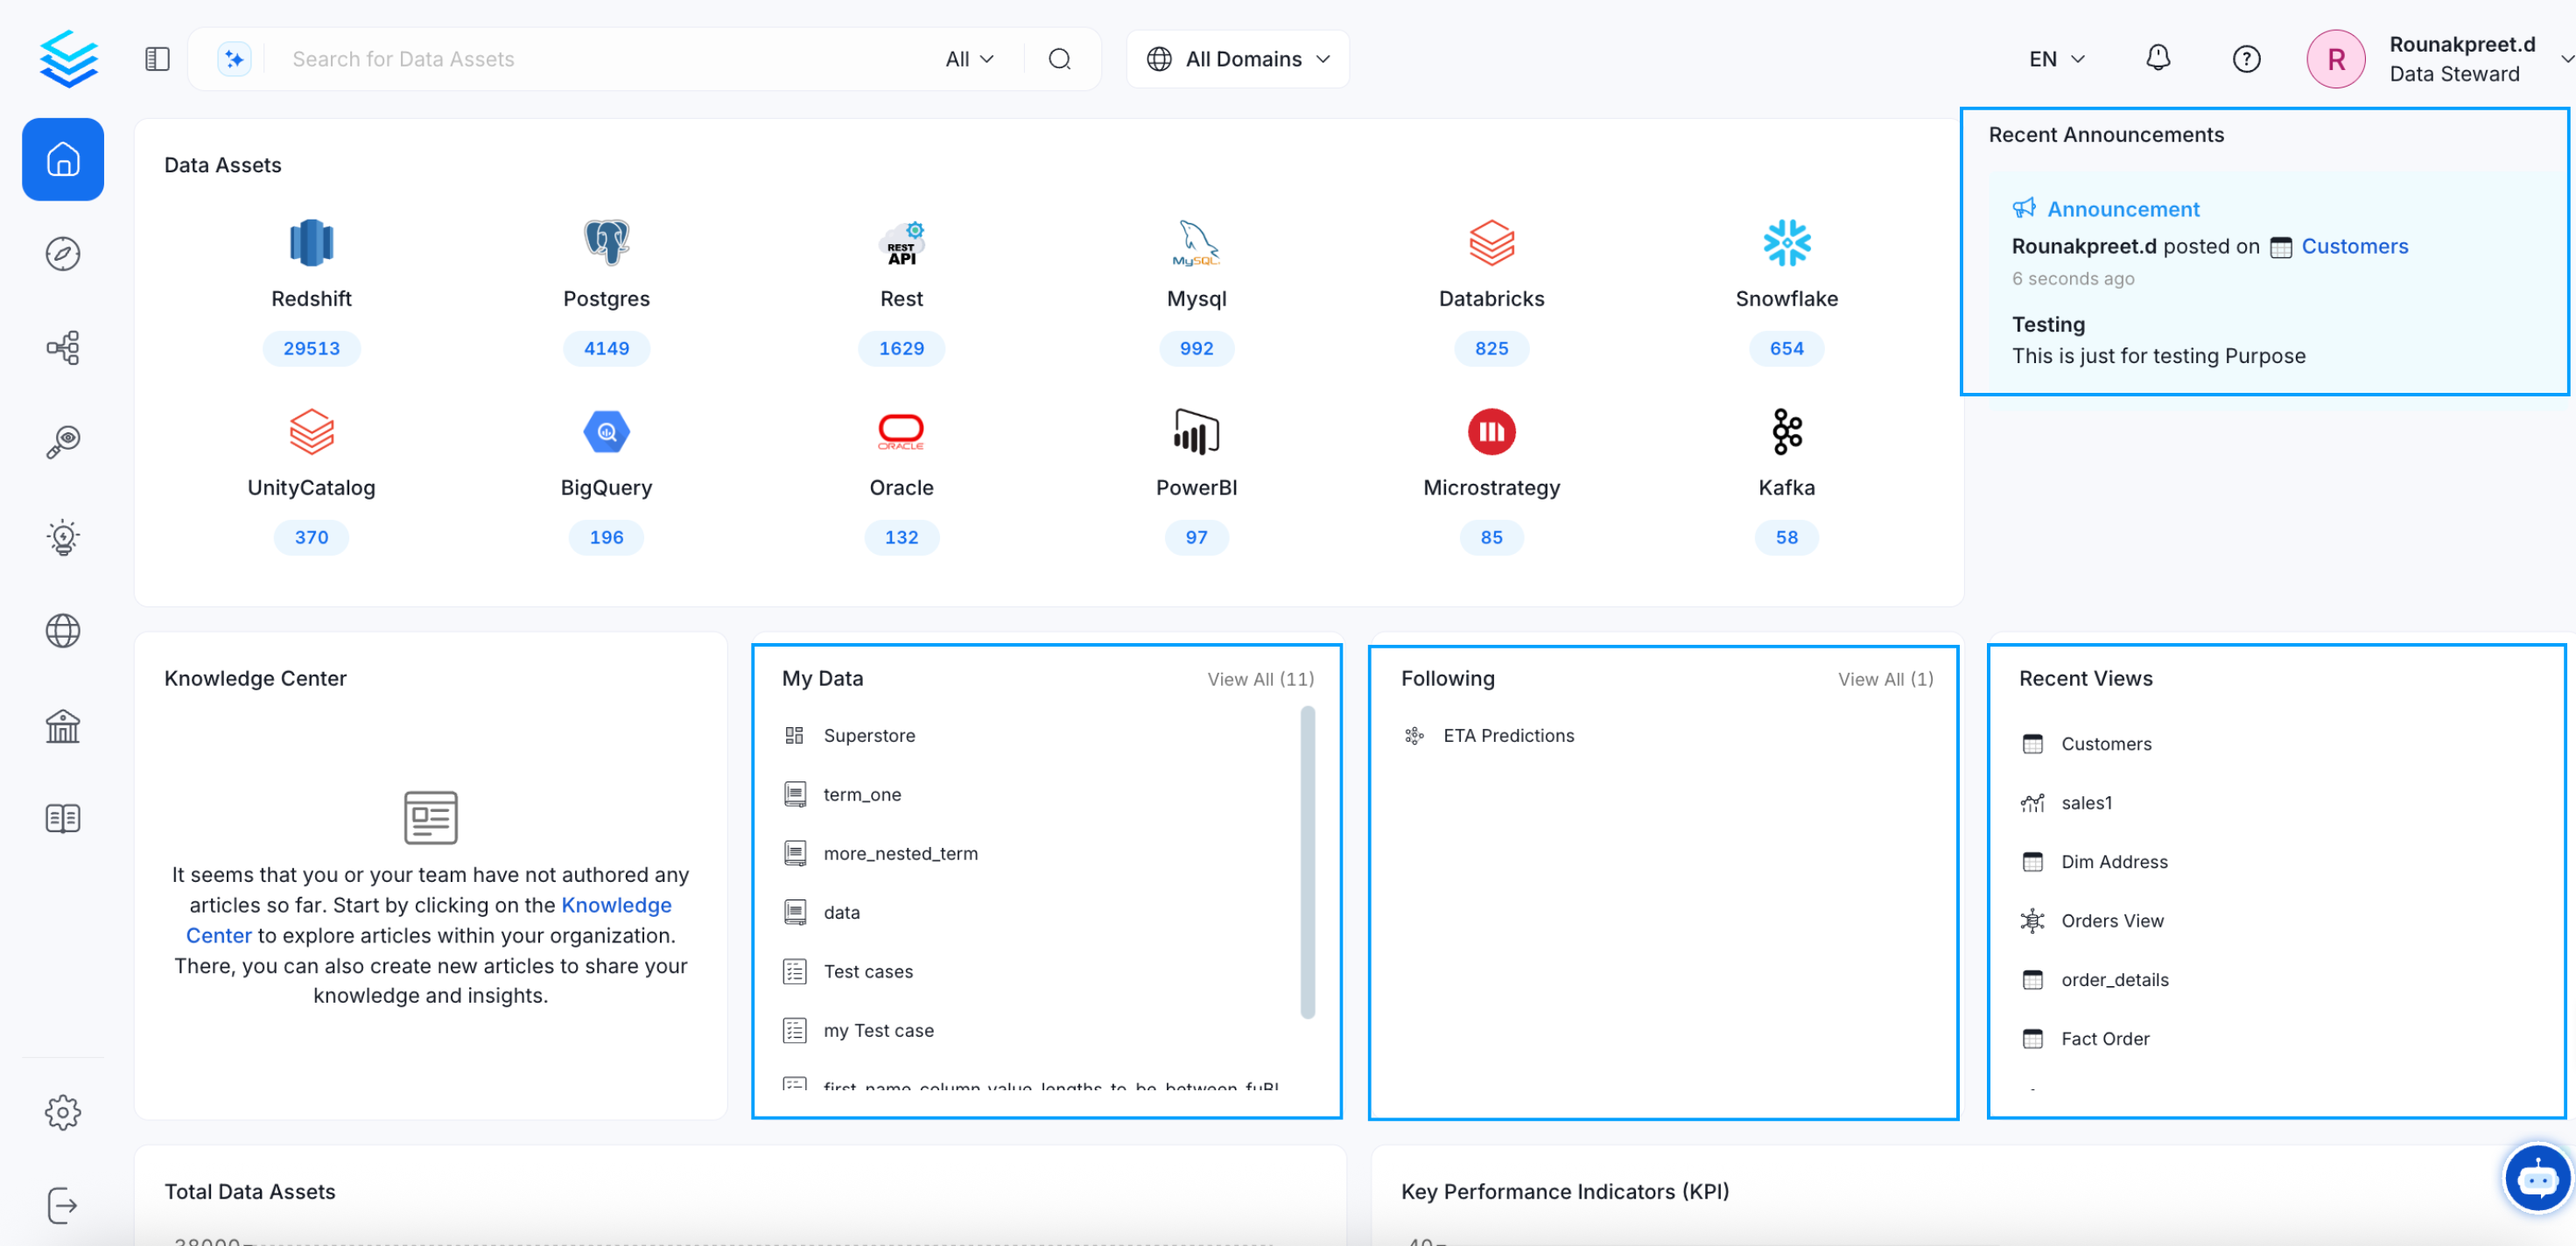
- Announcements: View all the recent announcements about the data assets you own or follow. Learn How to Add an Announcement.
- Following: View all the data assets that you are following. Learn How to Follow a Data Asset.
- Recent Views: Displays all the recently viewed data.
Overview of Data Assets
Know it all about data assets.