Data Observability Dashboards
The Data Quality page under Observability provides a platform-level view of your data health and test performance. It helps you monitor trends, identify issues, and track how your data quality evolves over time.Access the Dashboard
Navigate to Observability > Data Quality from the left navigation. The page opens on the Summary tab by default.Summary Dashboard
The Summary tab gives you a consolidated view of platform-wide data quality metrics.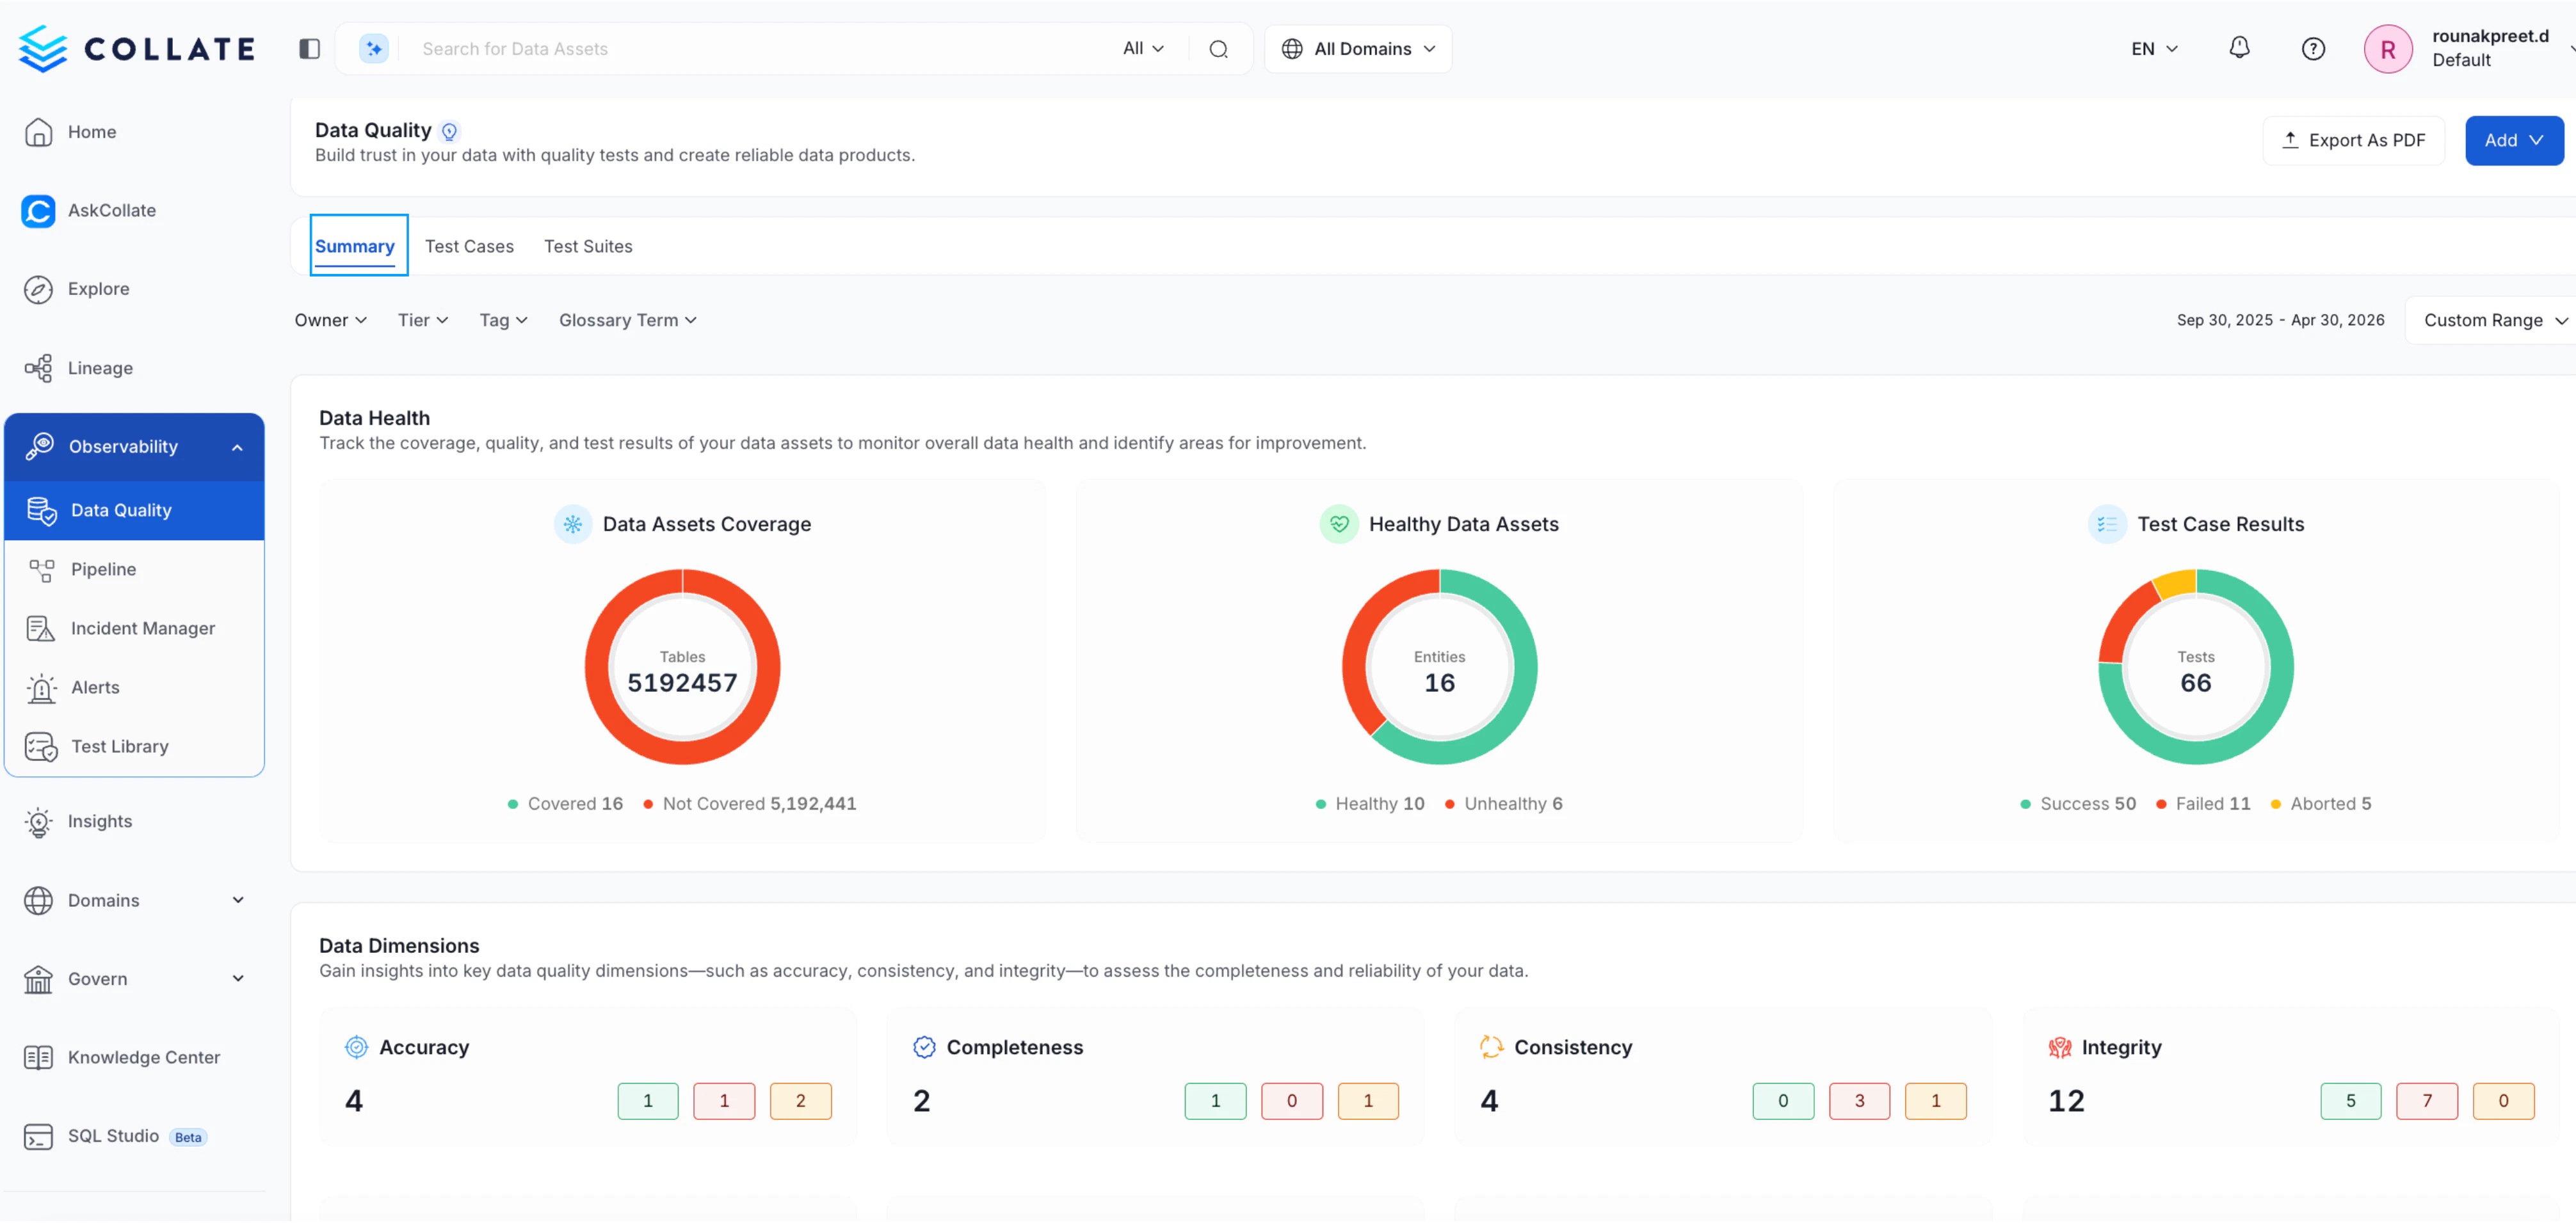
Data Health
Understand the overall state of your data assets, including:- Data Assets Coverage — Total assets tracked vs. those not yet covered
- Healthy Data Assets — Count of assets passing their quality checks
- Test Case Results — Breakdown of successful, failed, and aborted test cases
Data Dimensions
Analyze test results grouped by data quality dimensions such as Accuracy, Completeness, Consistency, and Integrity, helping you identify specific areas of concern.Test Cases Tab
Switch to the Test Cases tab for a consolidated view of individual test case health, including recent run results and asset-level insights.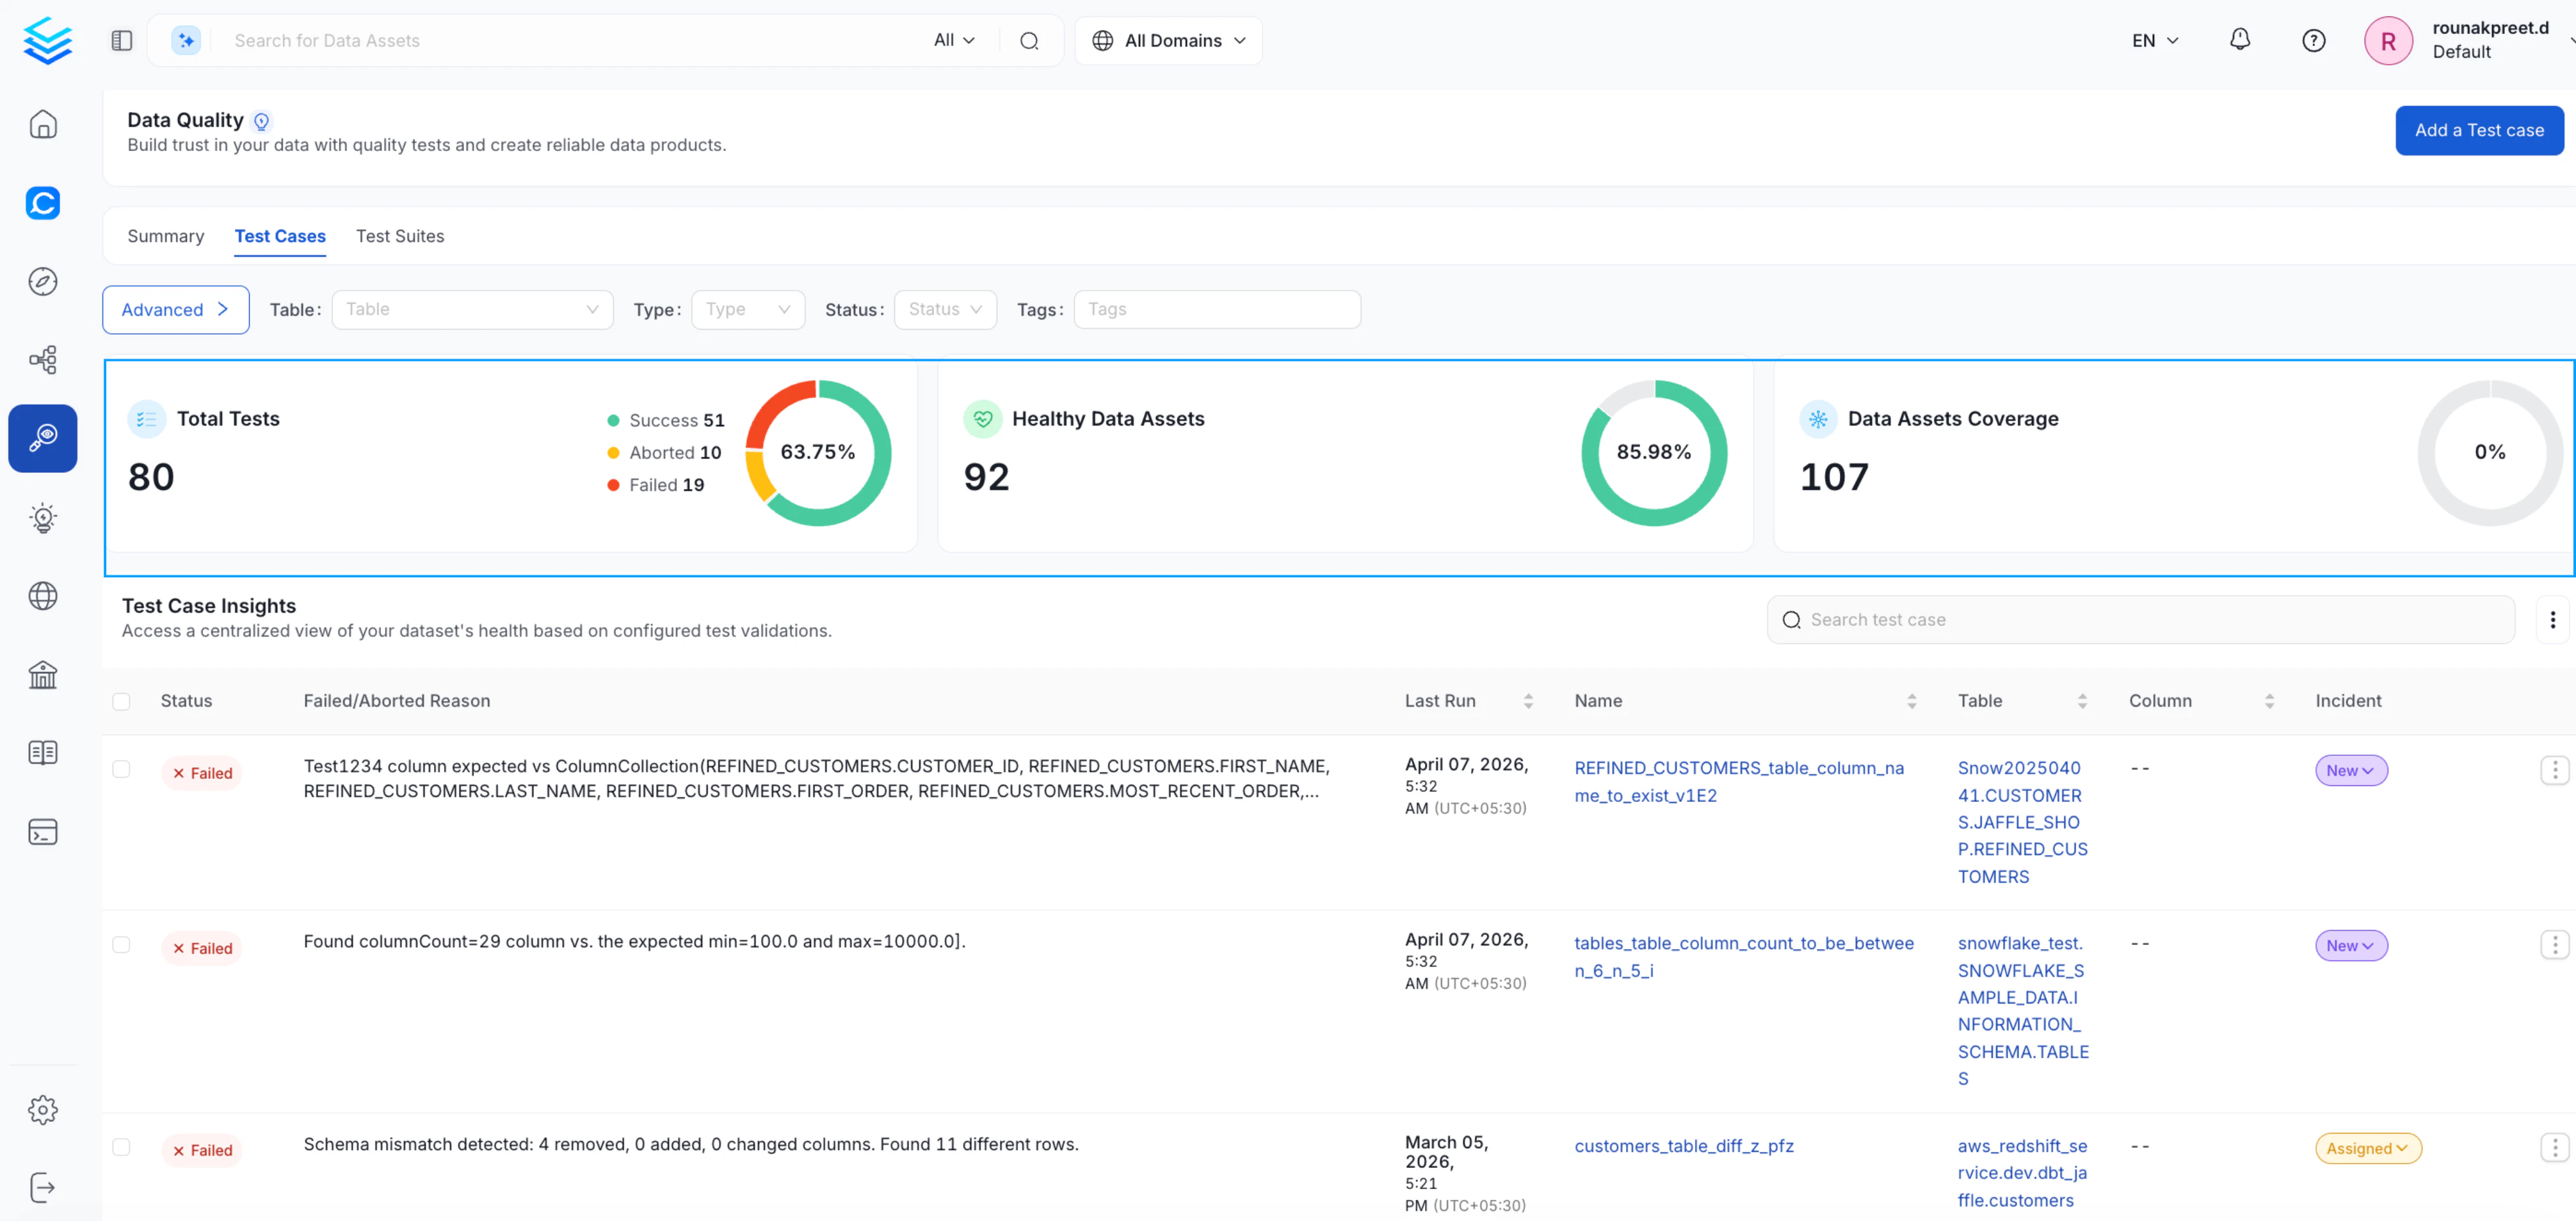
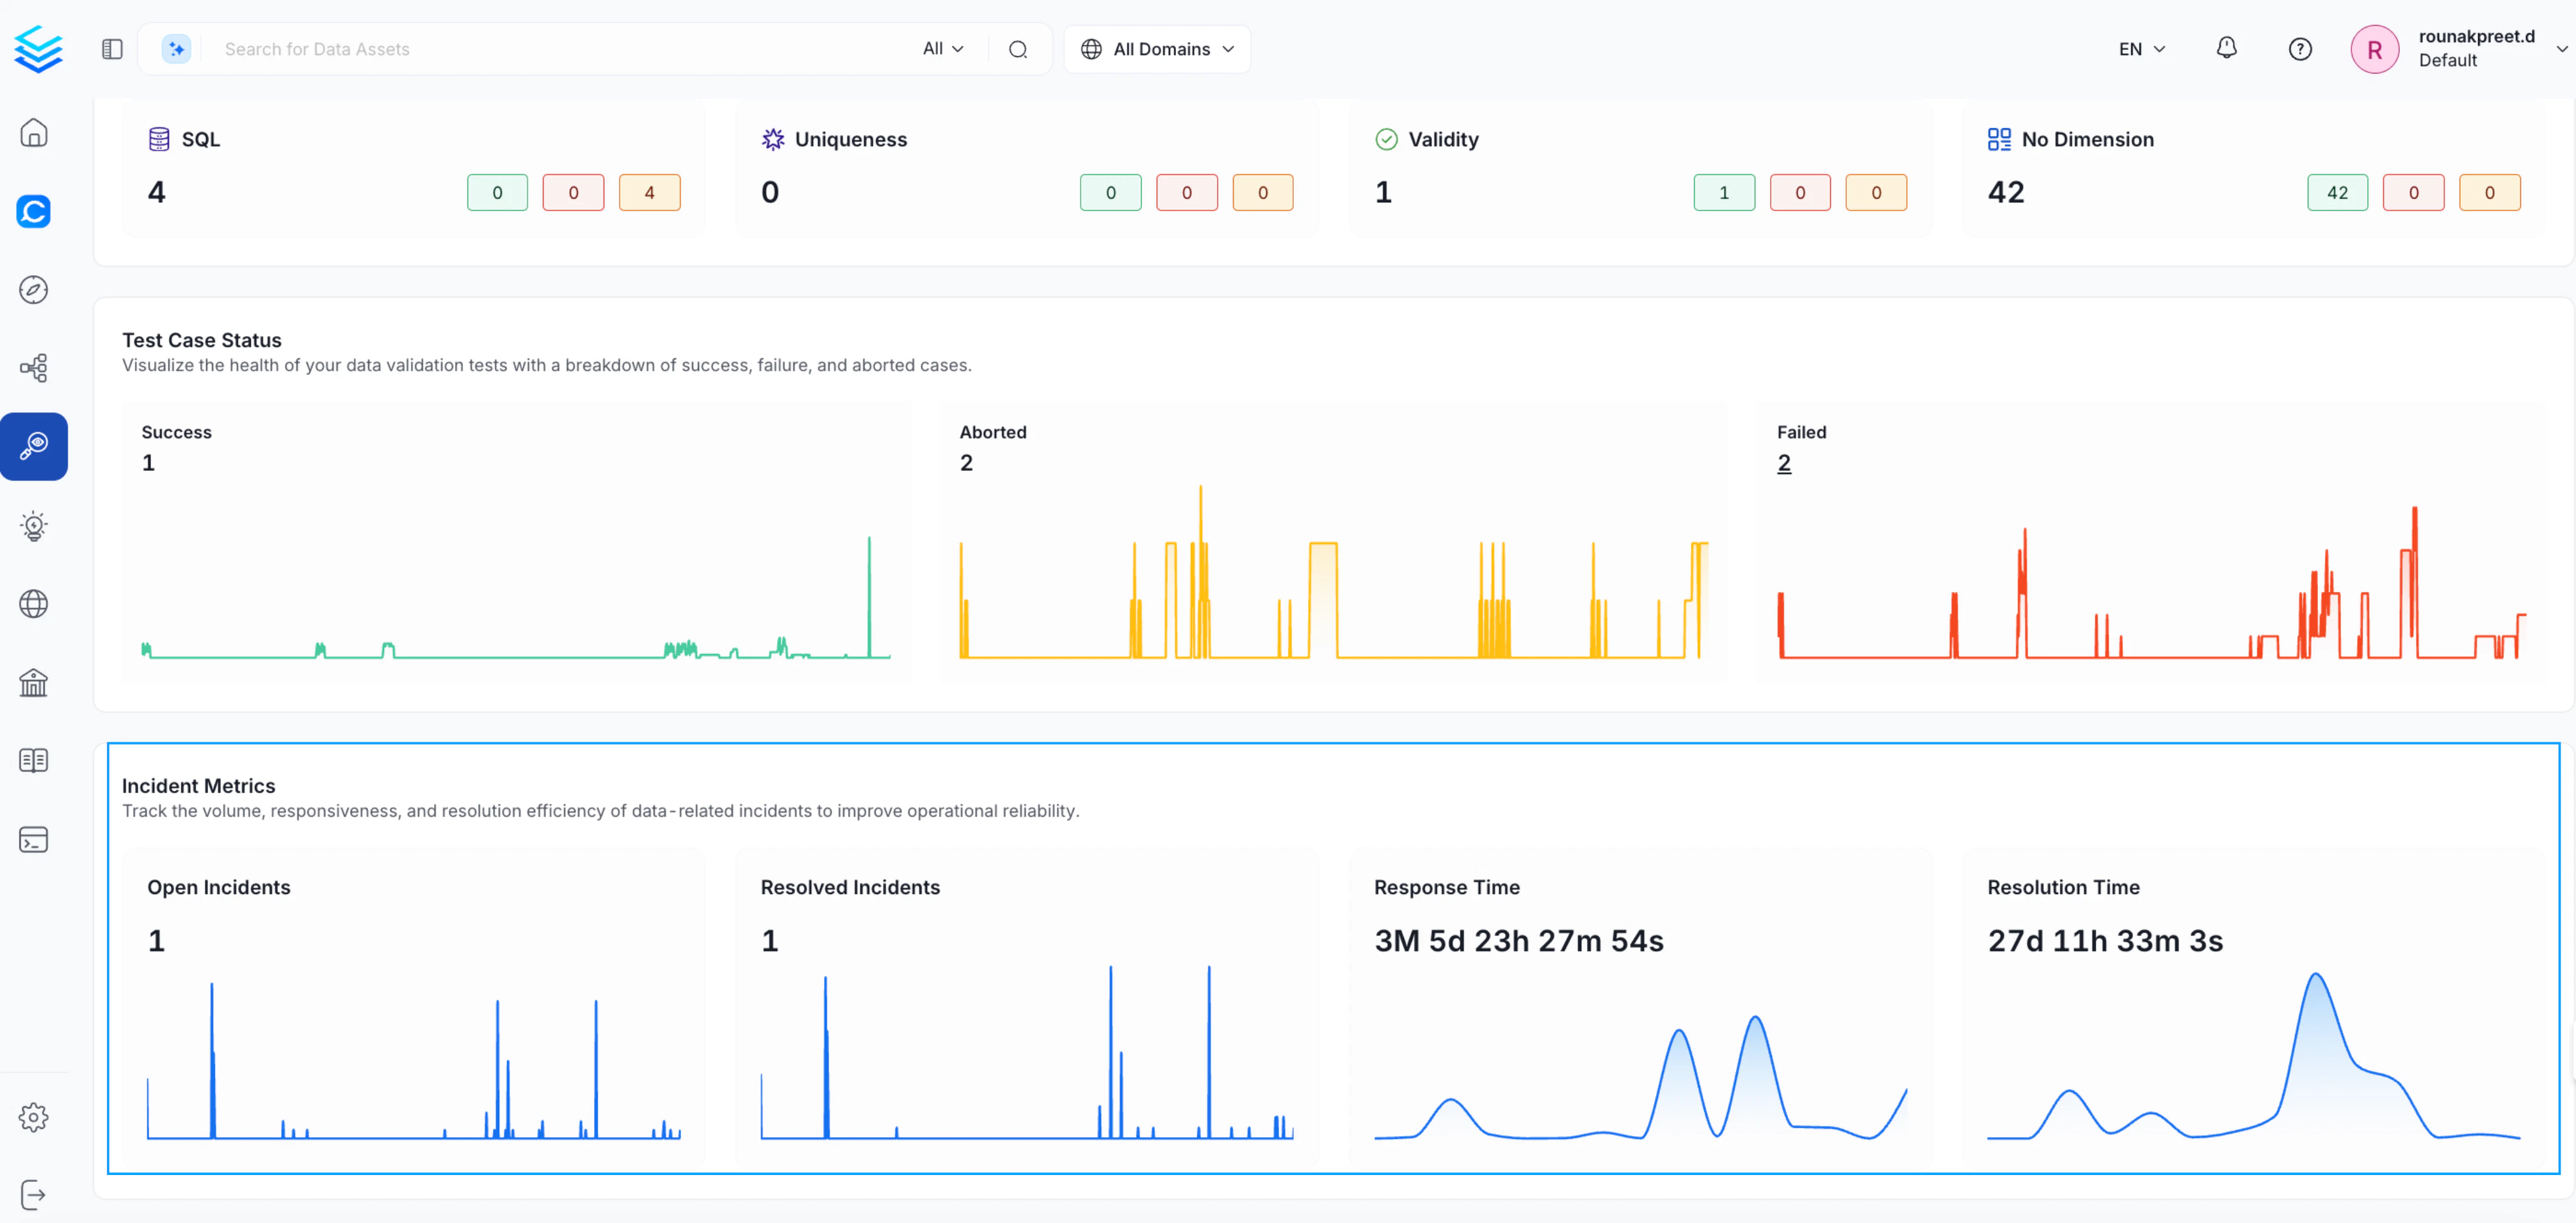
Test Case Status
Track how your test cases are performing over time with trend charts for:- Successful tests
- Aborted executions
- Failed tests
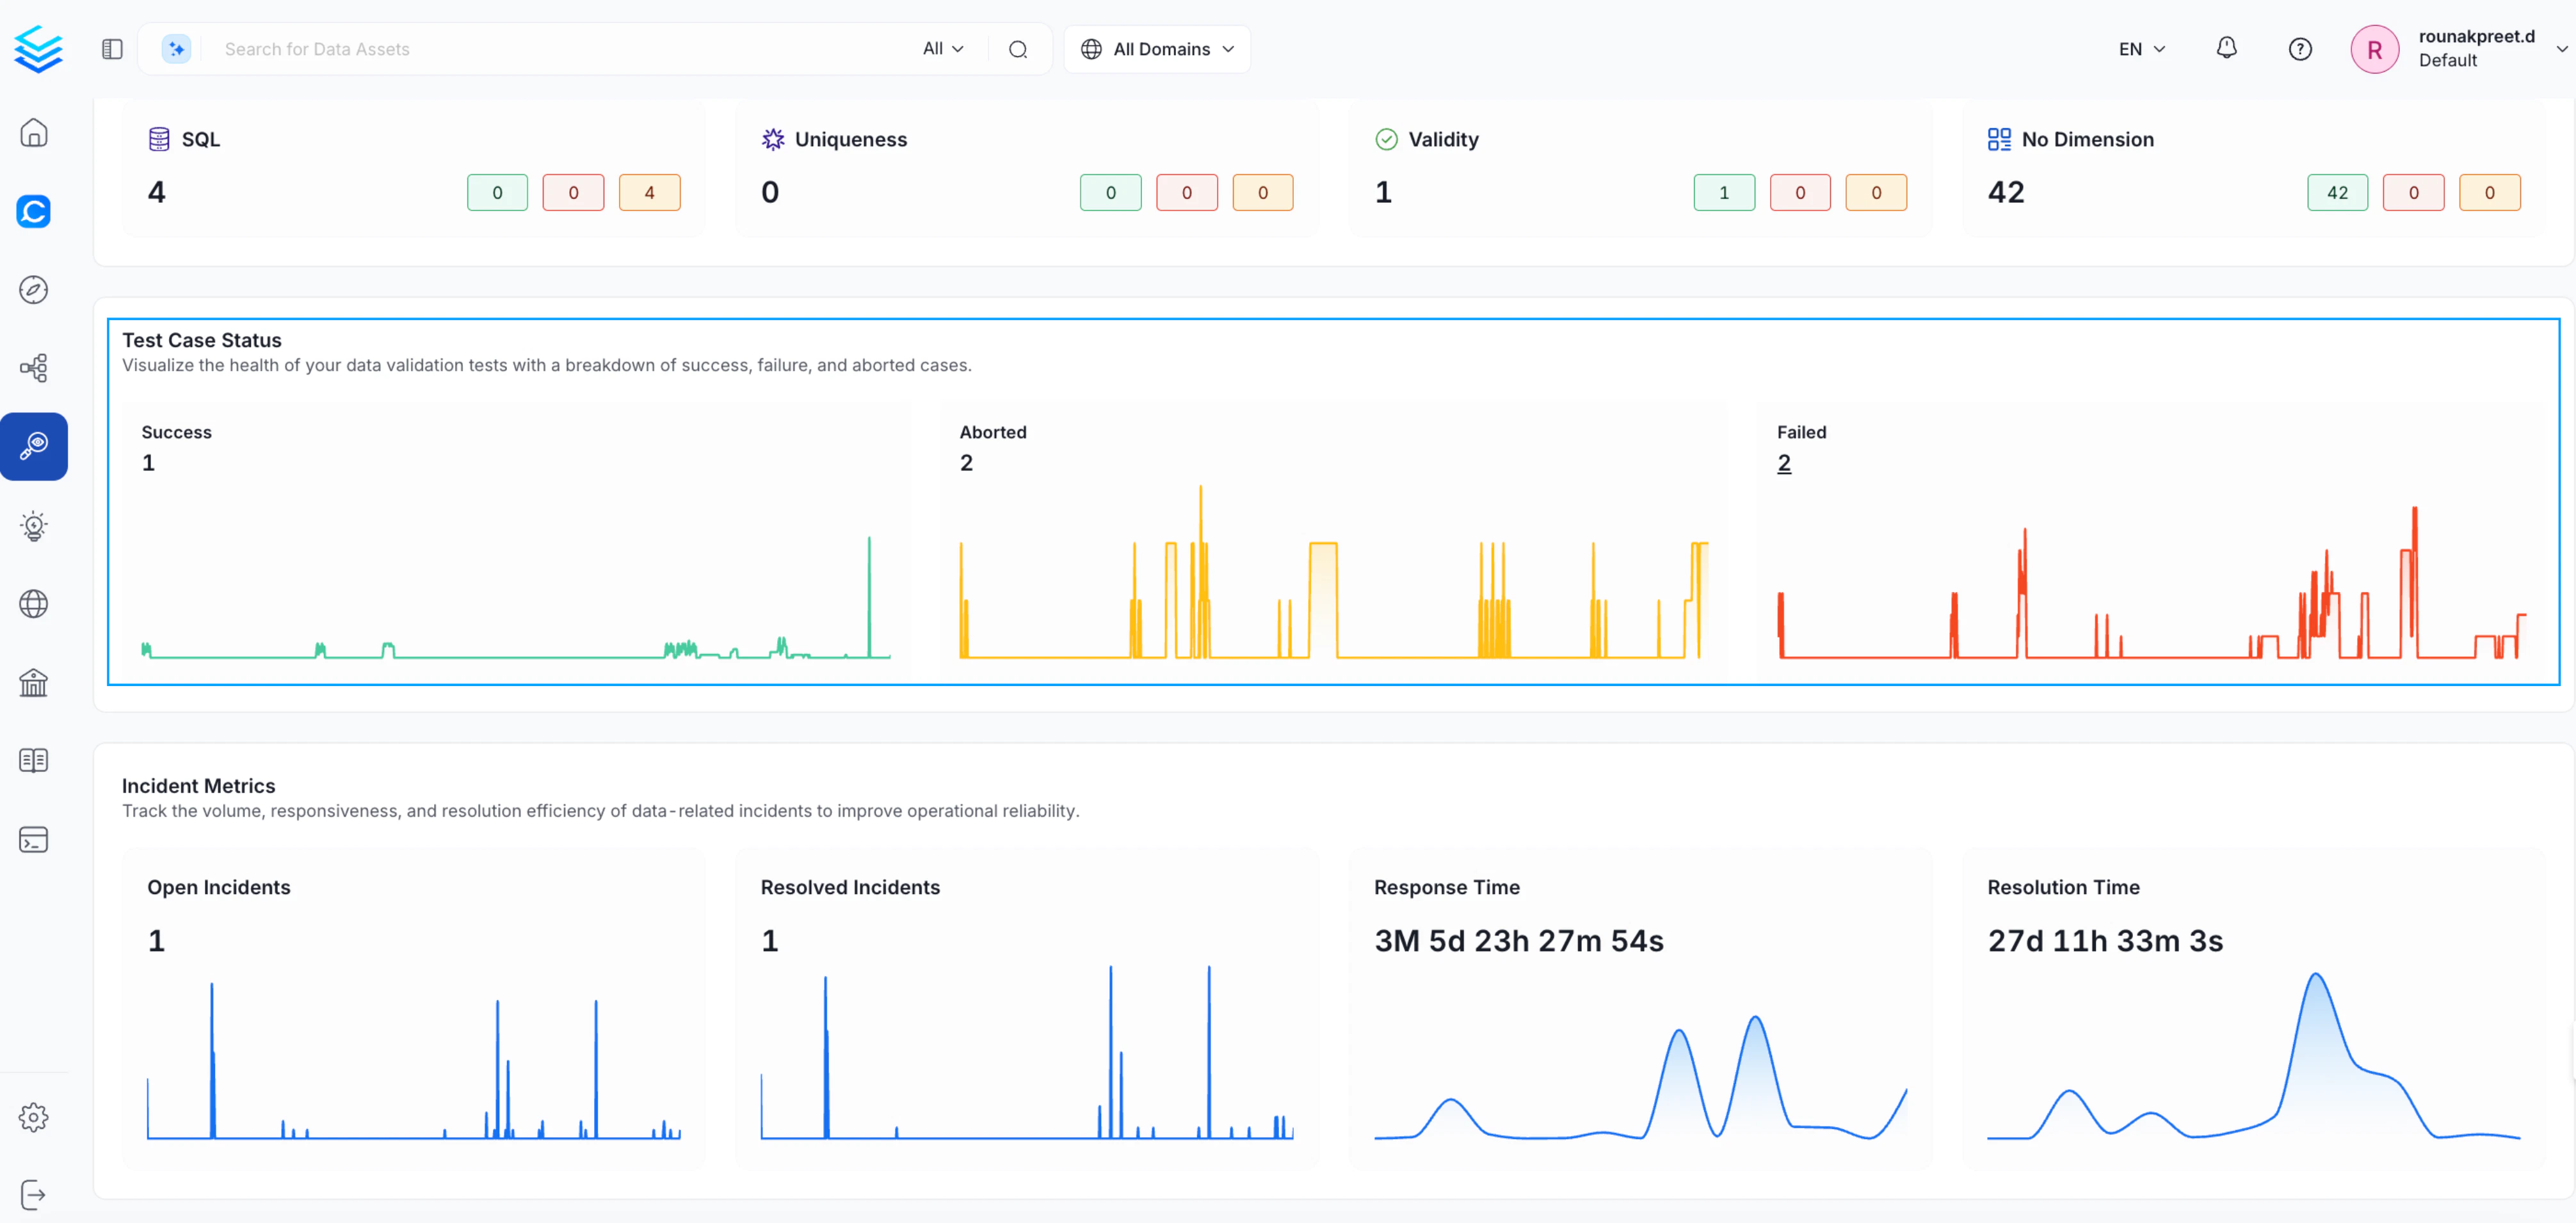
Incident Metrics
Monitor how data issues are being handled across the platform:- Open Incidents — Active unresolved data incidents
- Resolved Incidents — Issues that have been closed
- Response Time — How quickly incidents are acknowledged
- Resolution Time — How long incidents take to resolve
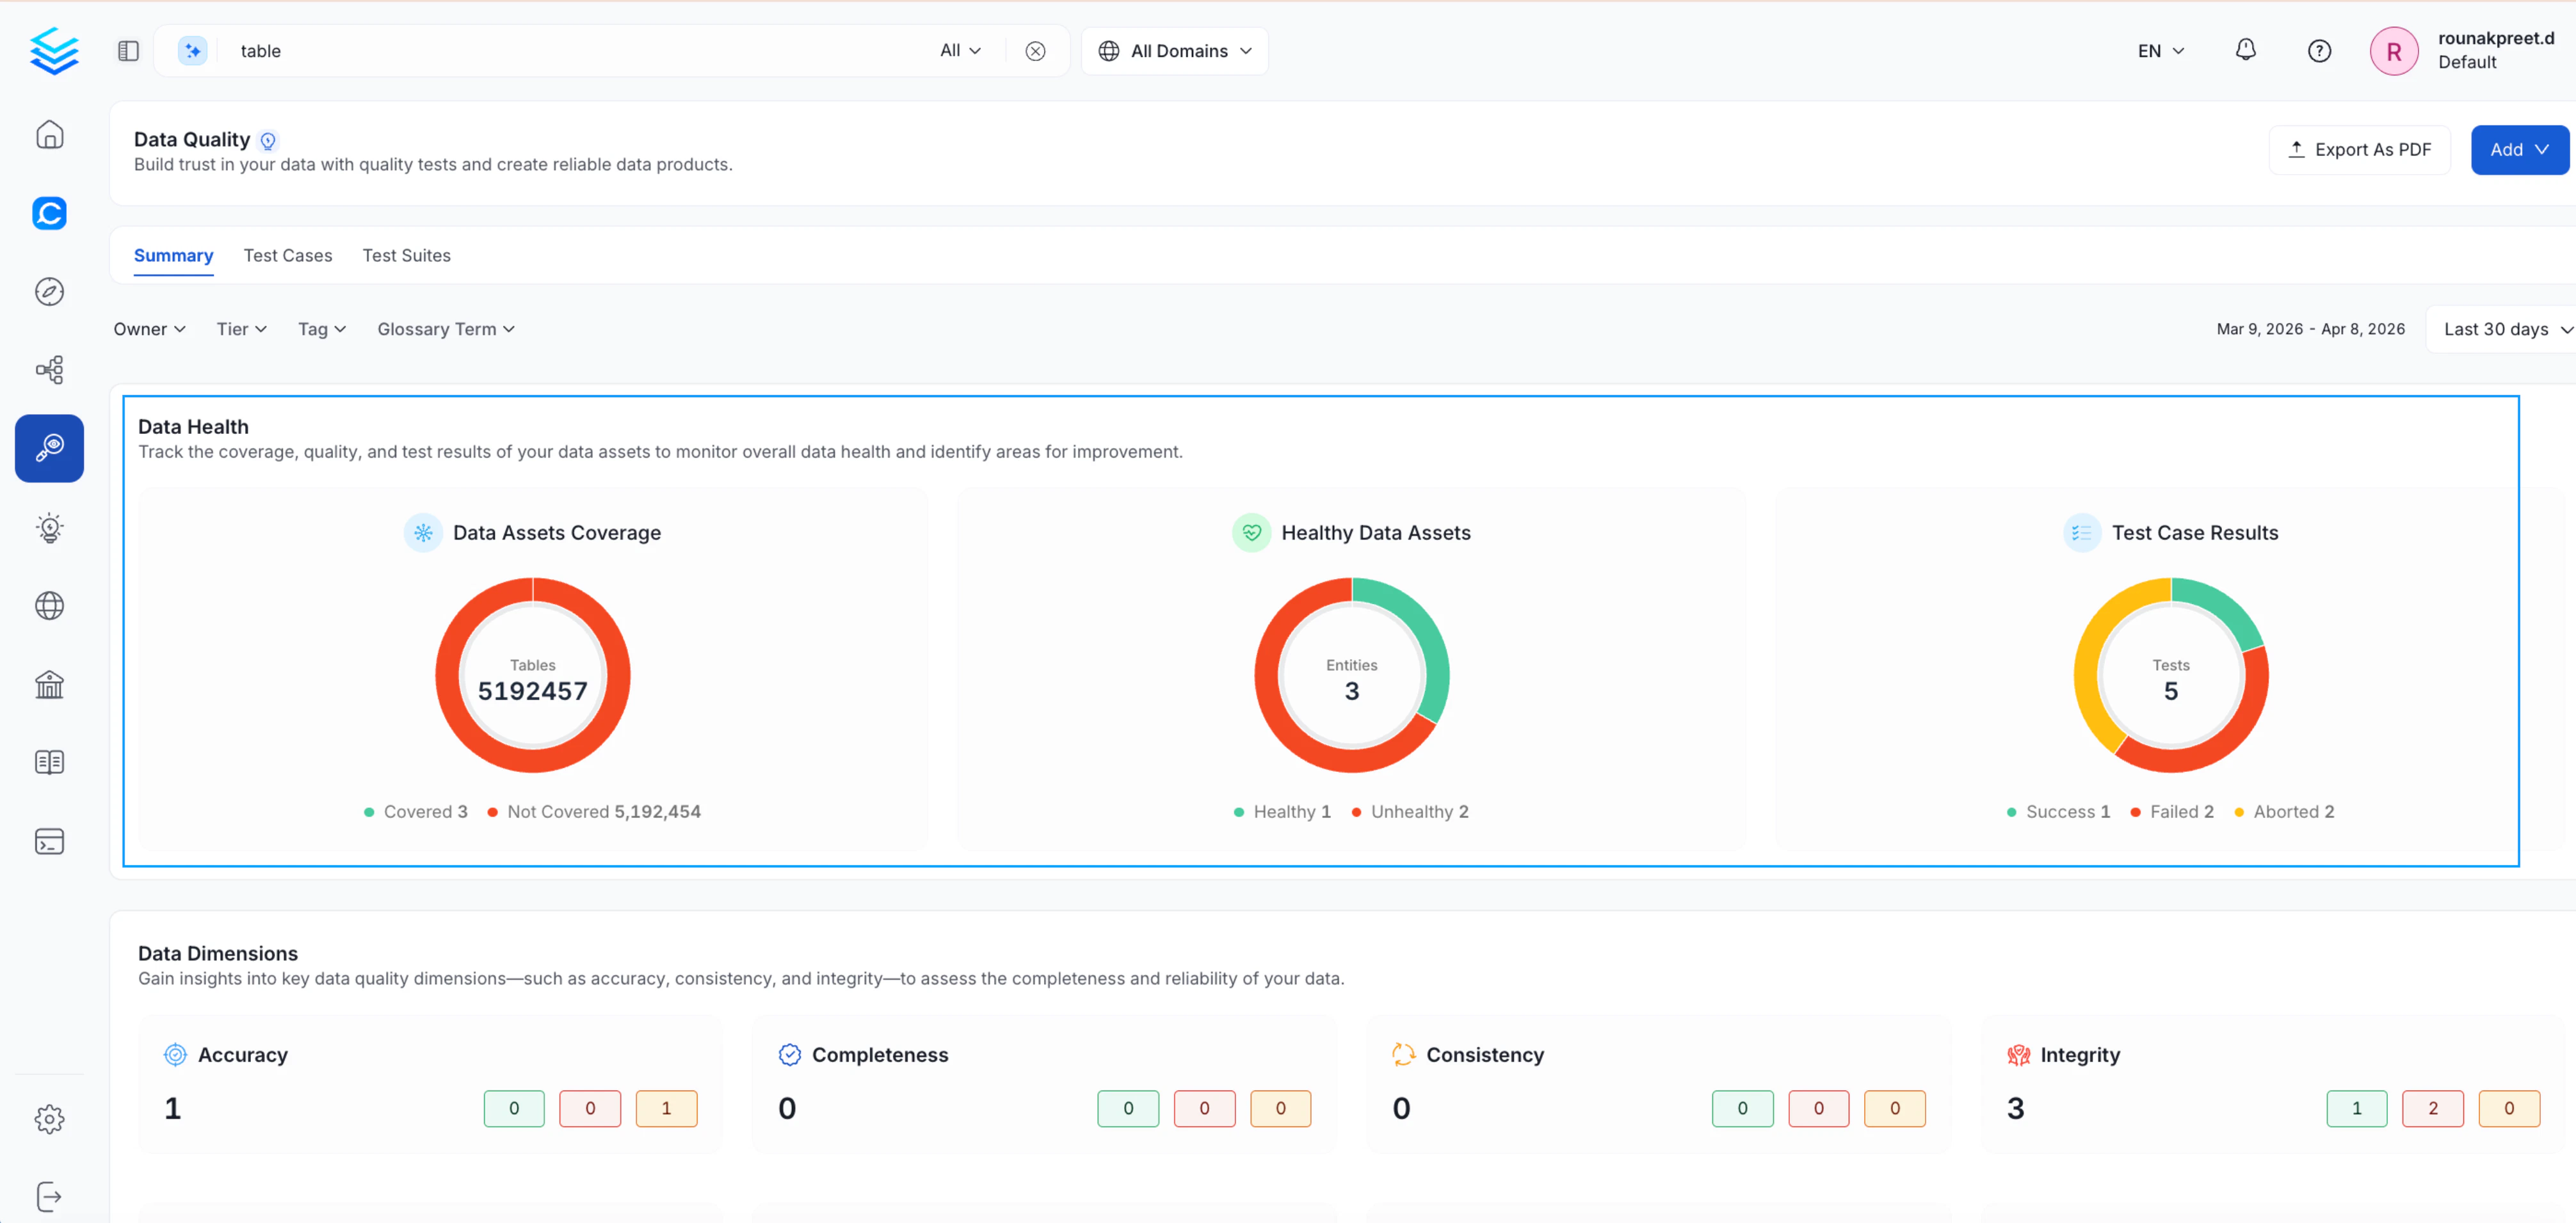
Apply Filters
Refine the dashboard view using the following filters to focus on the assets most relevant to you: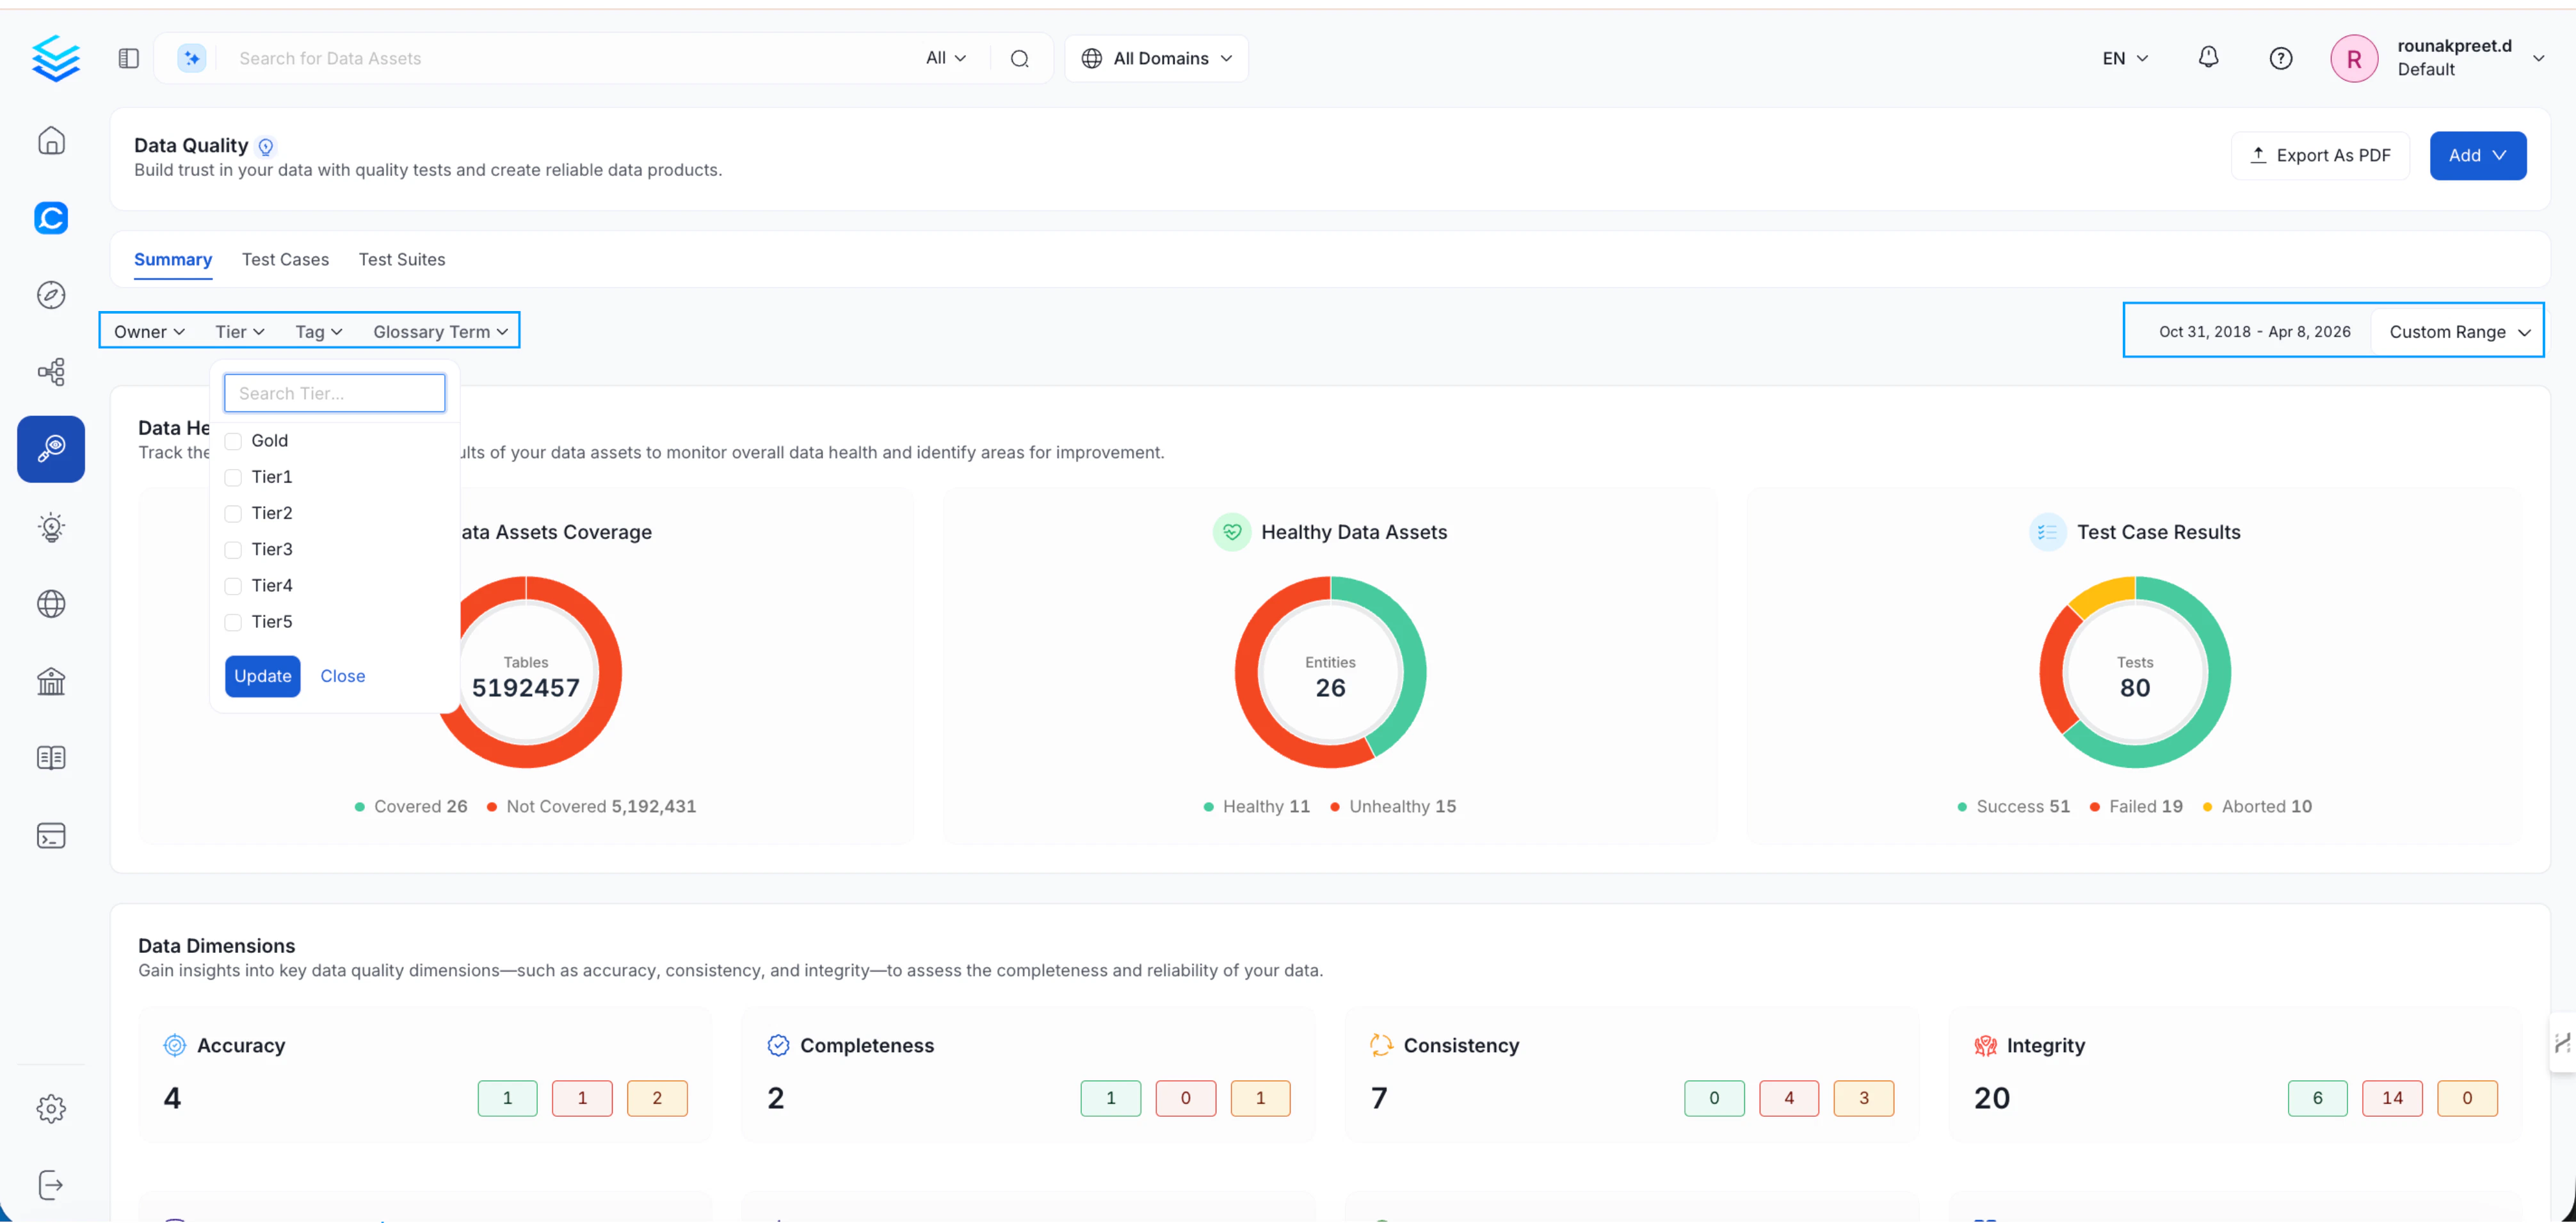
Data Observability Across Entities
In addition to the platform-level dashboard, Domain, Tag, and Glossary Term pages each include a Data Observability tab. This tab reuses the same dashboard with filters automatically applied to the selected entity, letting you analyze data quality in a specific context without manually setting filters.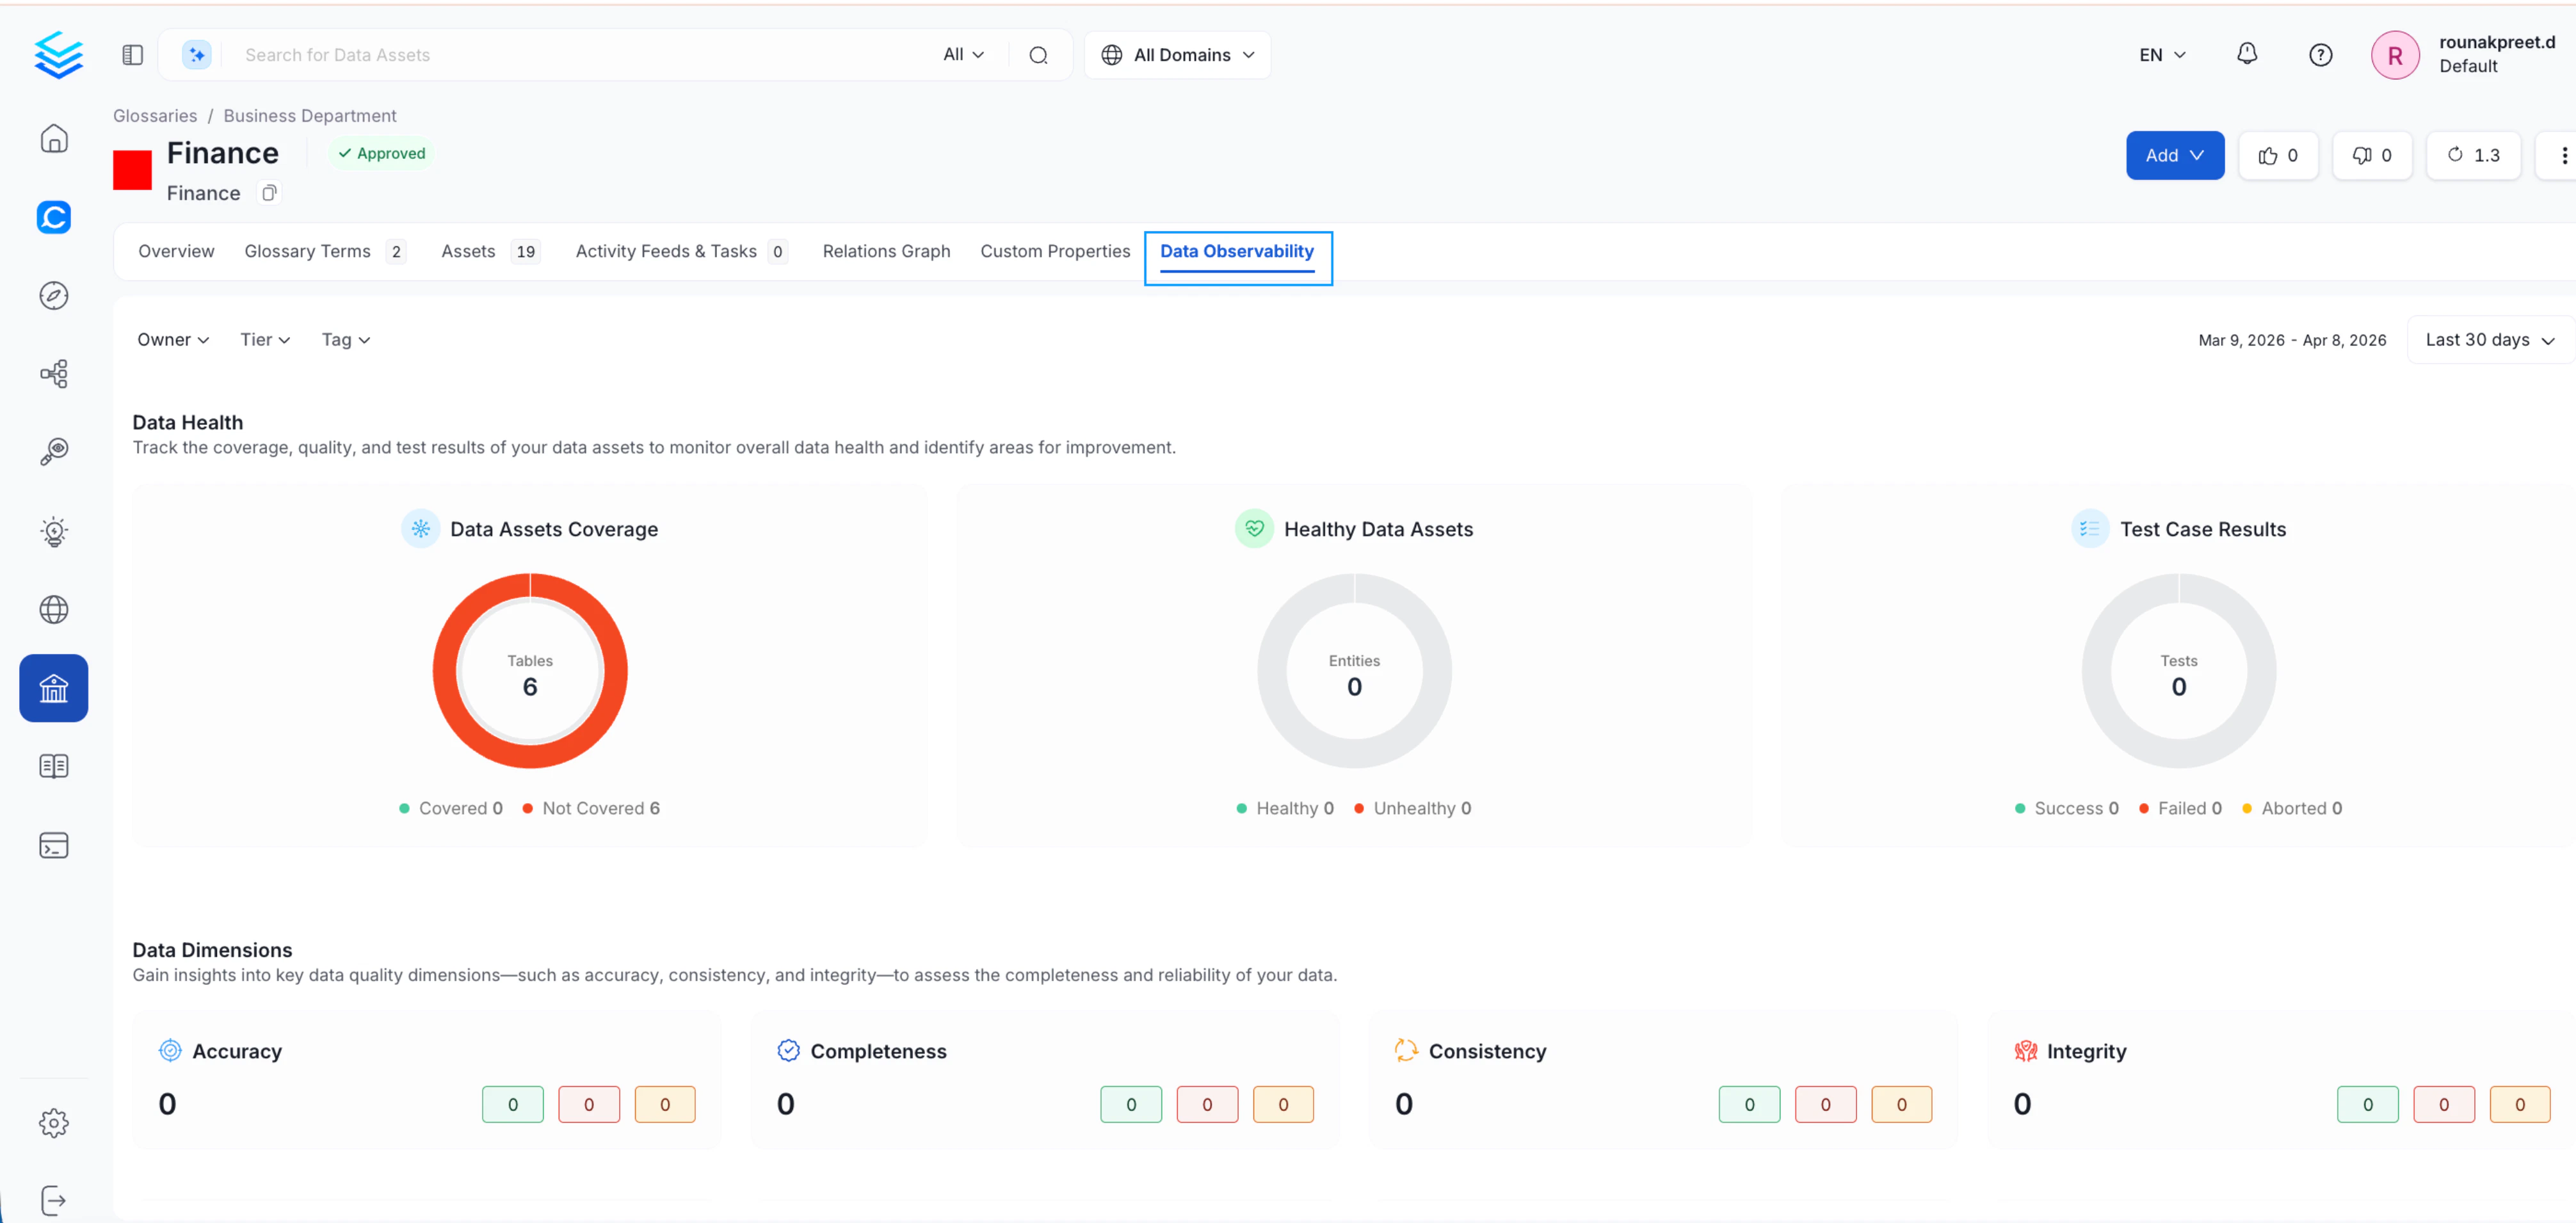
Table-Level Observability
For deeper analysis at the dataset level, Collate provides enhanced observability on individual tables:- A Data Observability section scoped to the table
- An Overview tab that includes:
- Open incidents
- Upstream failures
- Quick access to lineage
- Links to incident investigation