
Data Observability Alerts
Monitor the health of your data systems by setting up alerts for pipeline failures, data quality issues, and schema changes.Add an Alert
Follow these steps to create and configure a data observability alert in Collate.Step 1: Navigate to the Alerts Page
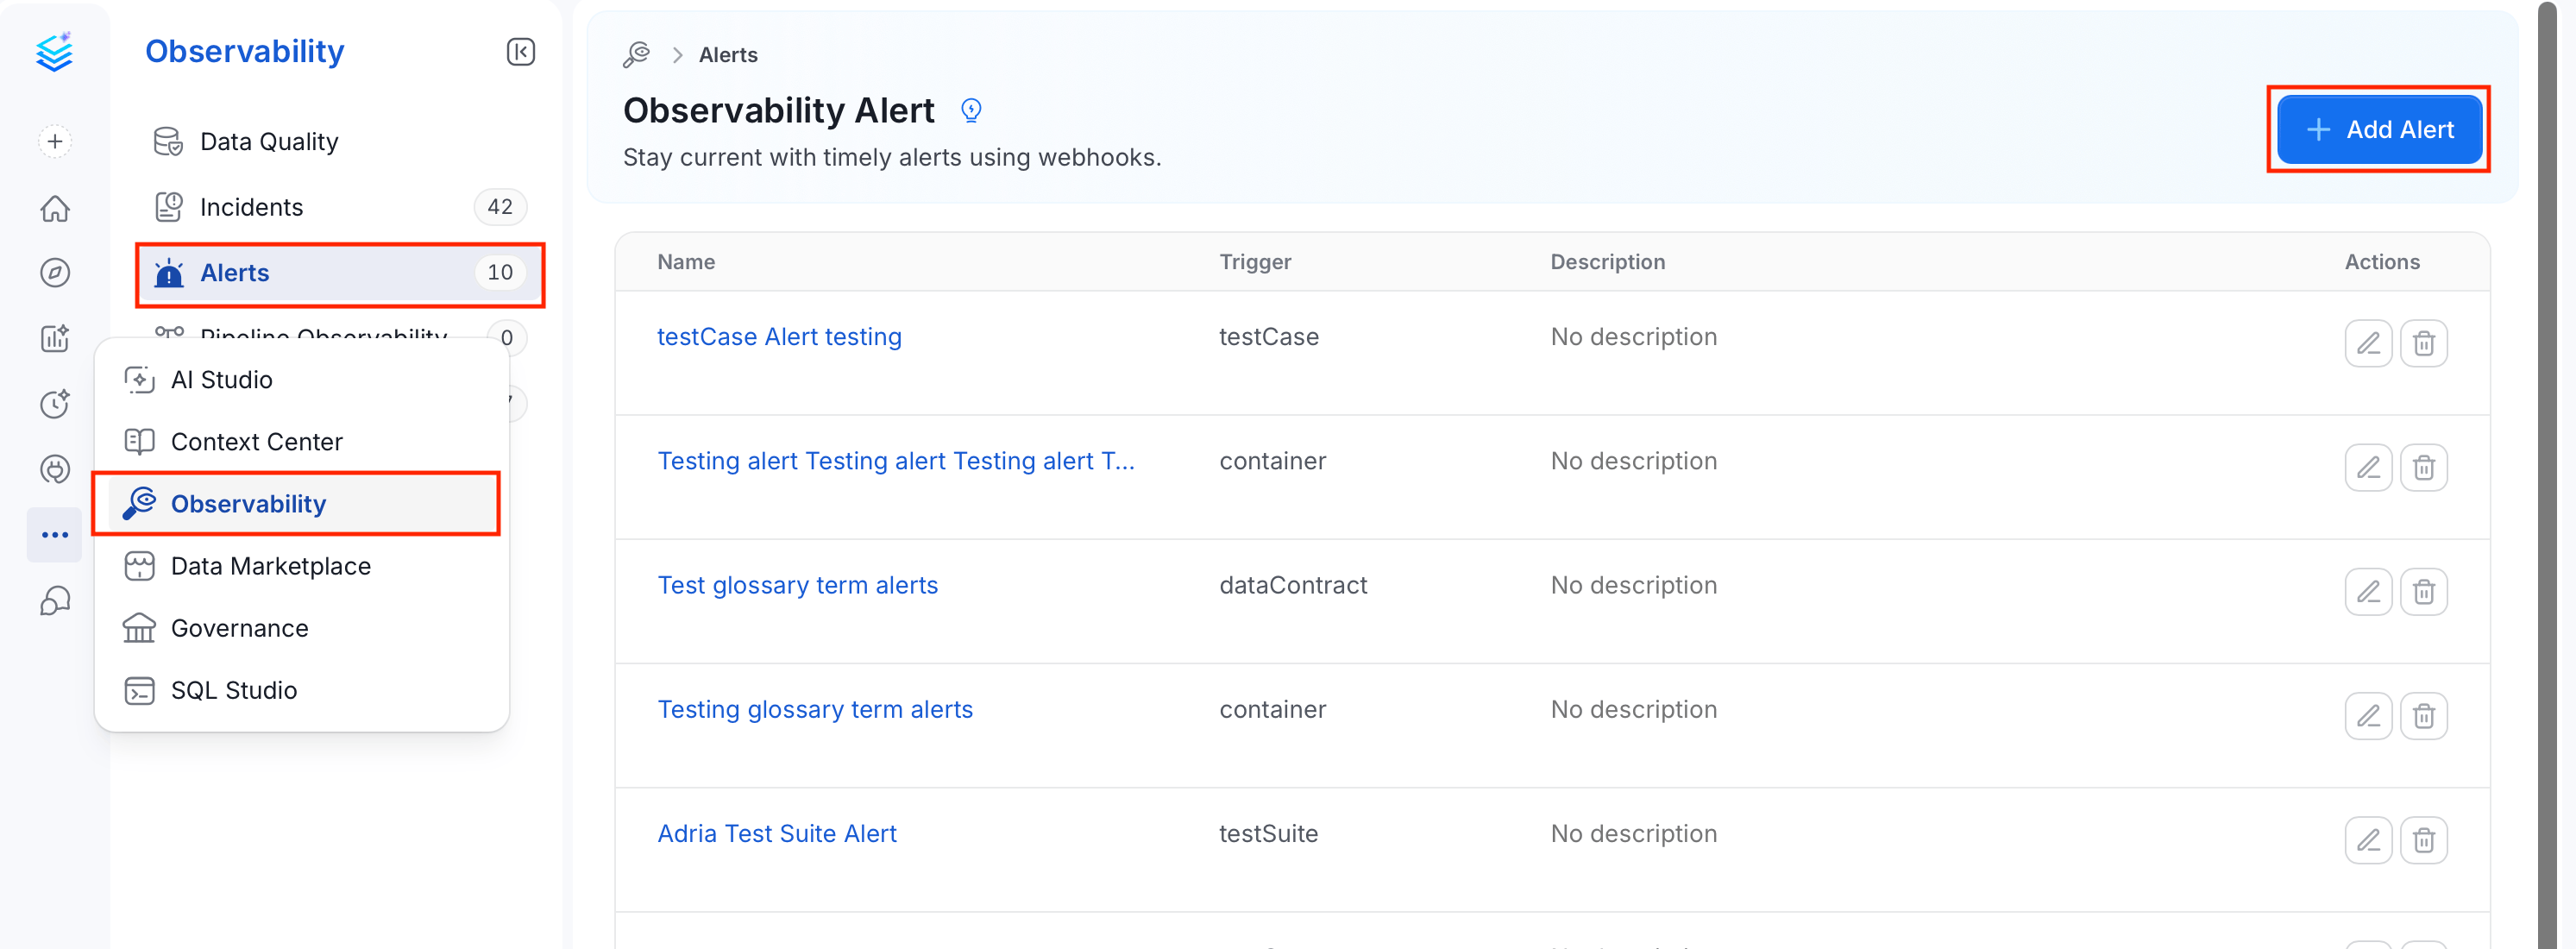
- From the left navigation bar, select Observability > Alerts.
-
Click Add Alert.
Step 2: Name the Alert and Add Context
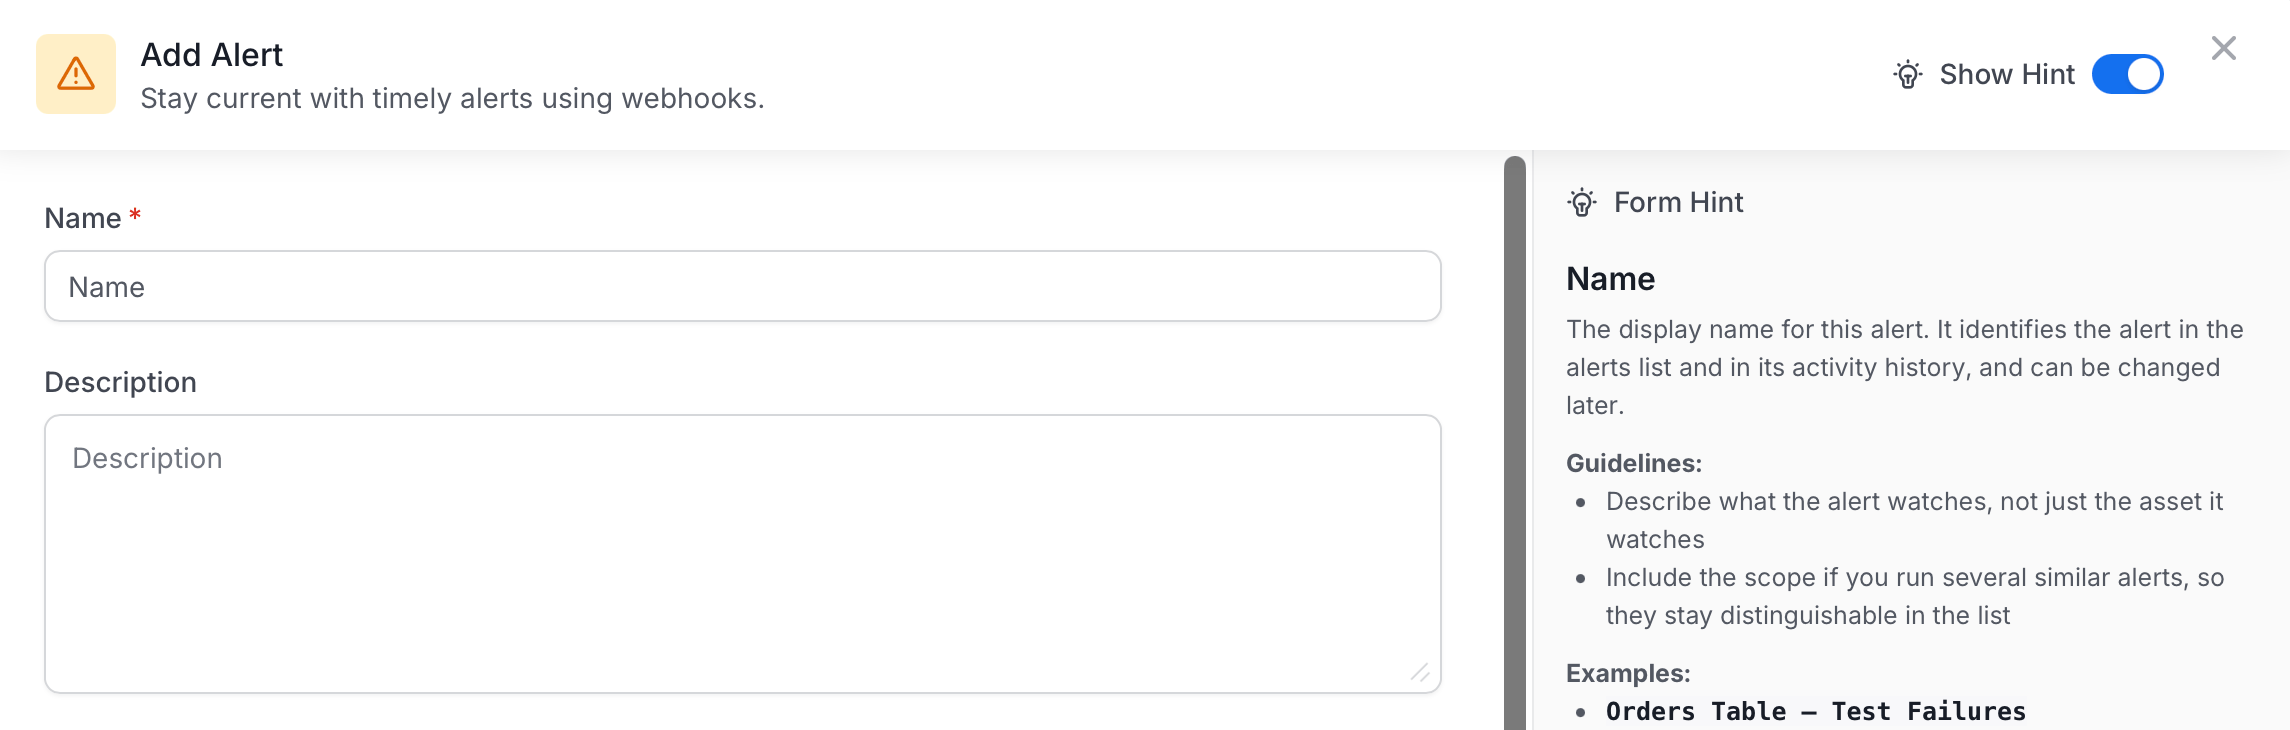
- Enter a unique, descriptive Name for your alert.
- (Optional) Add Description to provide further context and clarity regarding the alert’s intent.
Step 3: Select Sources
Choose one or more operational entities to monitor:- Container - Monitors schema changes for the container asset
- Data Contract - Triggers an alert when a data contract status changes
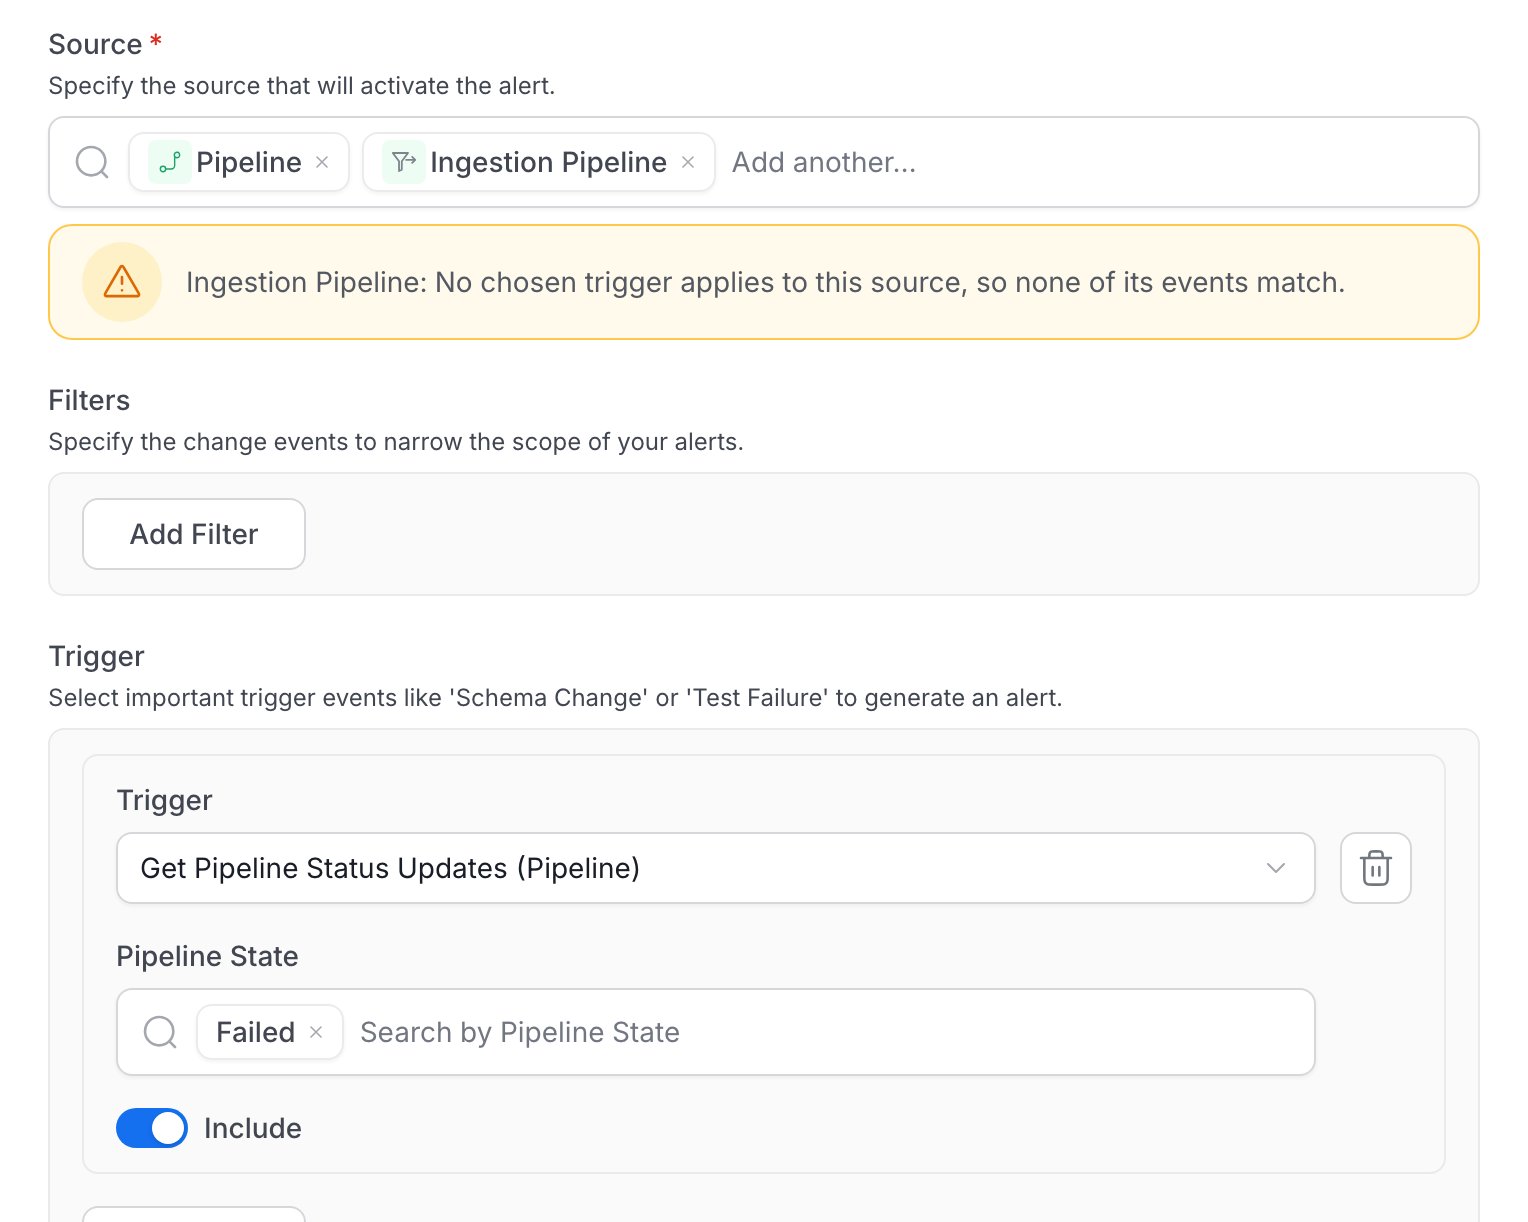
- Ingestion Pipeline - Monitors status changes to your Collate ingestion pipelines
- Pipeline - Monitors updates to pipeline assets that you have ingested
- Table - Monitors schema changes and table metrics changes
- Test Case - Triggers an alert for the specific test case selected
- Test Suite - Triggers an alert once for each completed run of the test suite, based on the summary of its test case results. This is a great way to group alerts and reduce notification fatigue
- Topic - Monitors schema changes for the topic asset
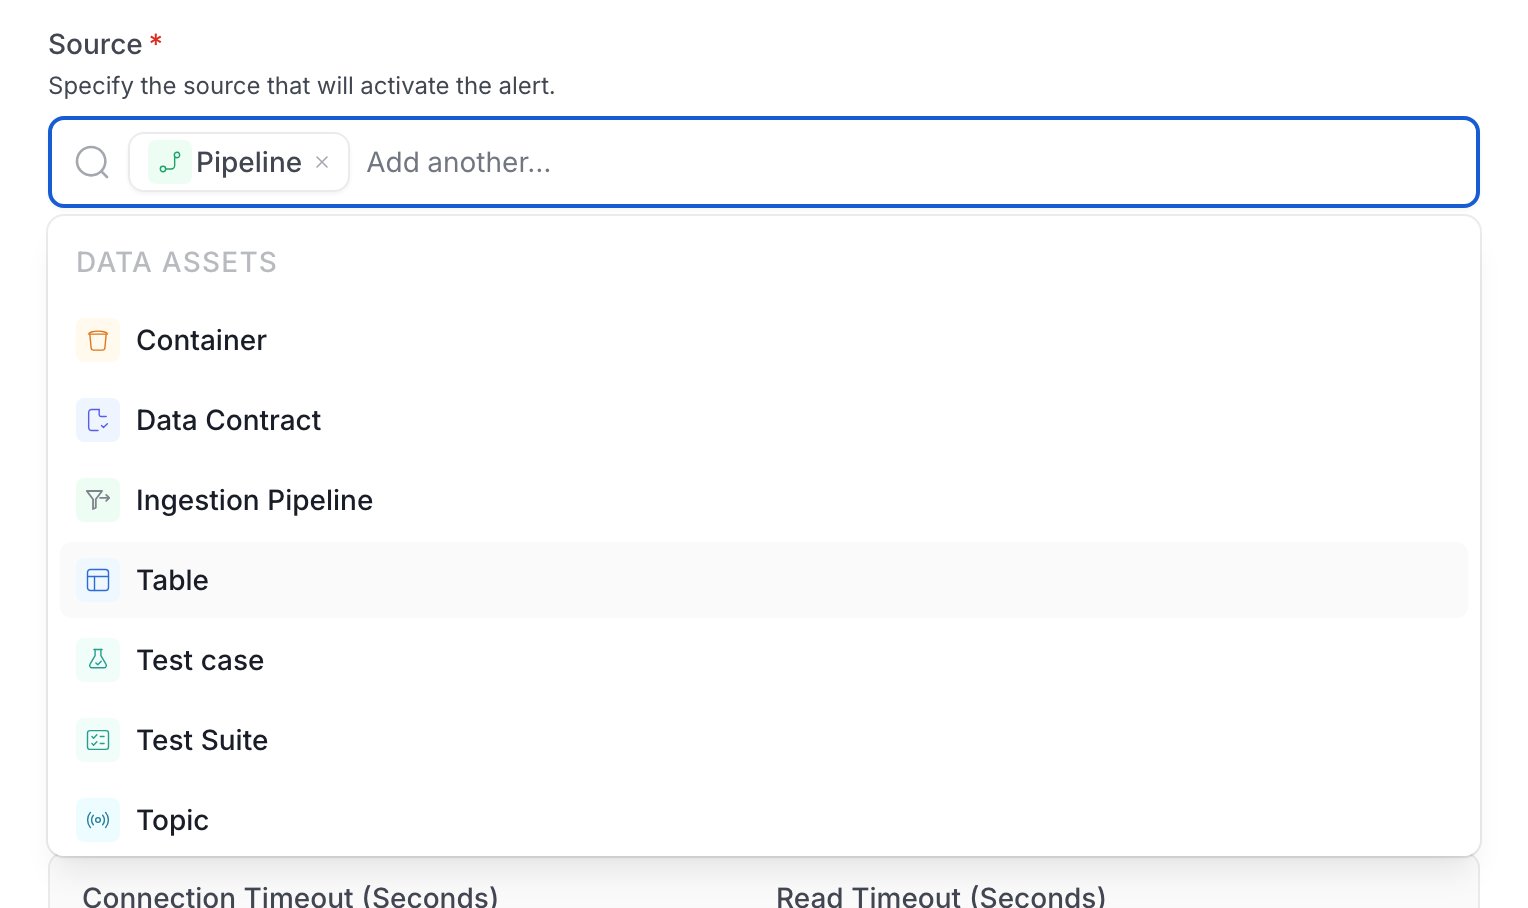
Note: Changing the sources clears the filters and triggers you chose. Removing a source also clears the destinations.
Step 4: Configure Filters (Optional)
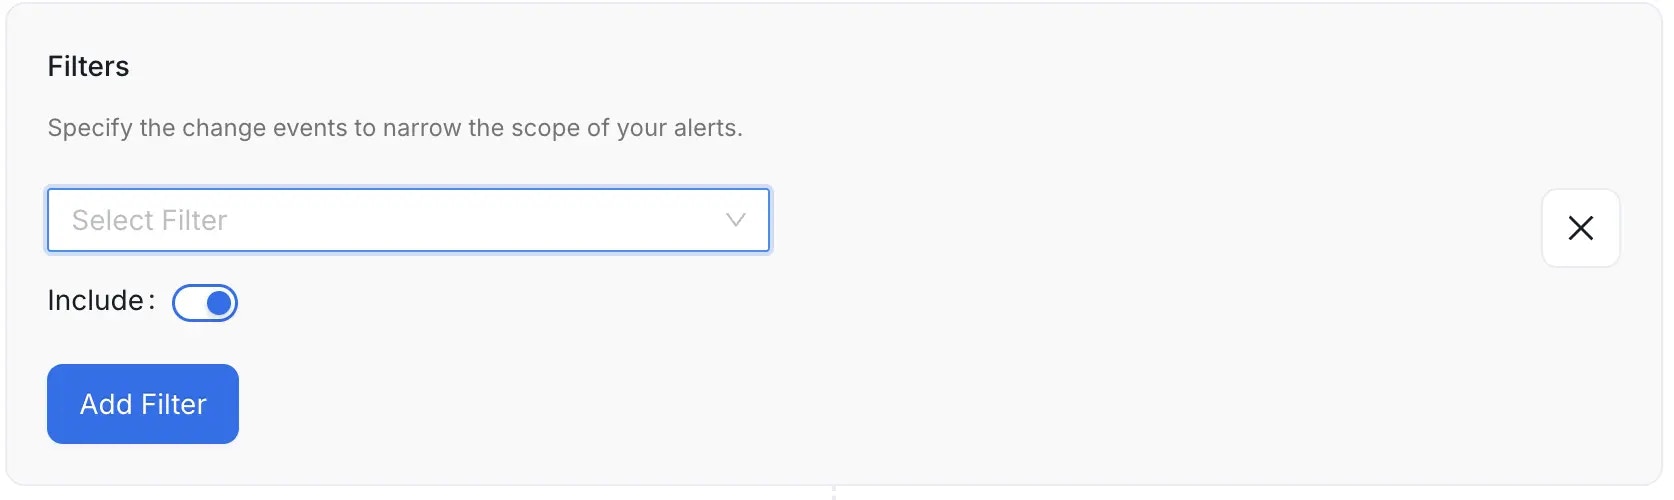
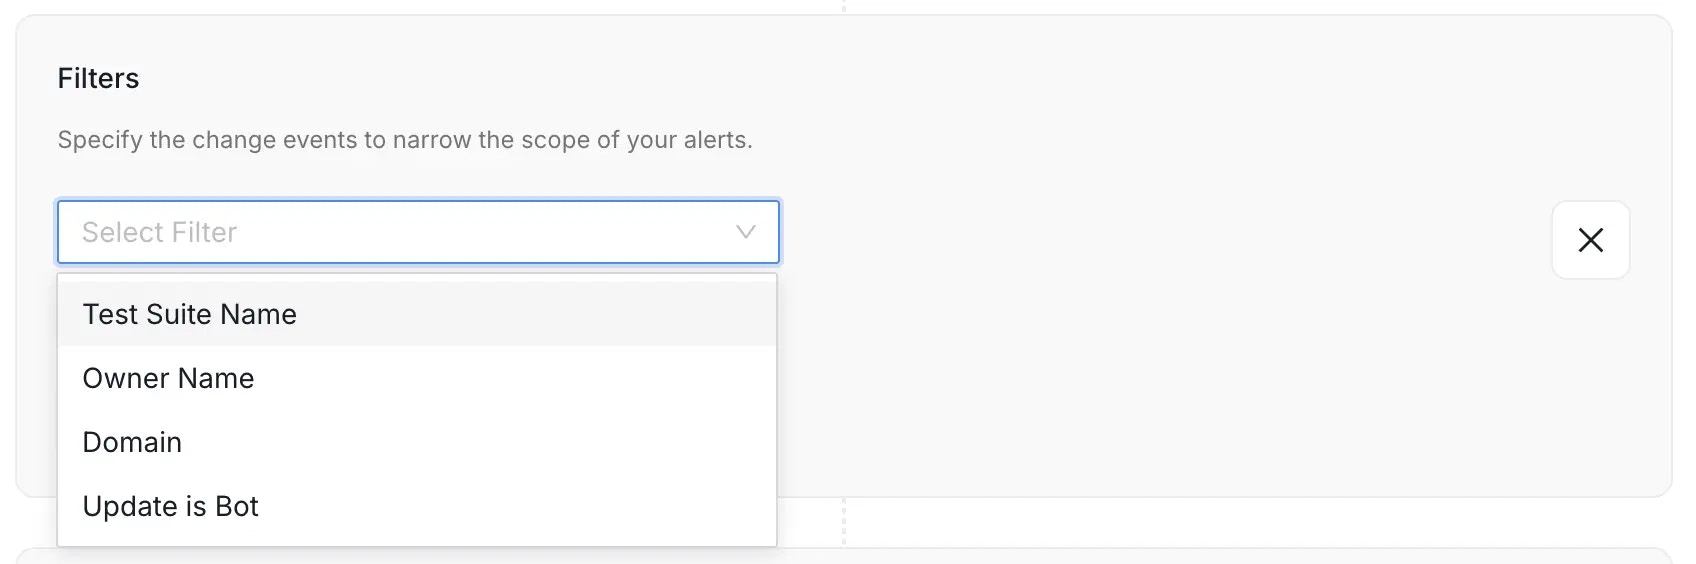
Filters let you refine the scope of the alert to focus only on relevant changes, significantly improving the signal-to-noise ratio. With several sources, Add Filter offers only the filters that every chosen source supports. Narrow down events based on a variety of criteria, including:- Entity Specific Name: Filter by the defined specific name of the entity.
- Owner Name: Filter events based on the designated owner of the asset.
- Domain: Filter events based on the Data Domain the entity belongs to.
- Filter By Updater Is Bot: Filter to include or exclude changes made by automated ingestion or system processes.
- Include (Toggle ON): If the event meets the filter condition, the alert is sent.
- Exclude (Toggle OFF): If the event meets the filter condition, the alert is silenced (not sent).
Note: If you do not set any filter, the alert will apply to all relevant events over the selected source entity type, which may lead to excessive notifications.
Step 5: Select Trigger Conditions (Optional)
Define the specific conditions that will trigger the alert:- Schema Changes - Alert on added, deleted, or updated columns
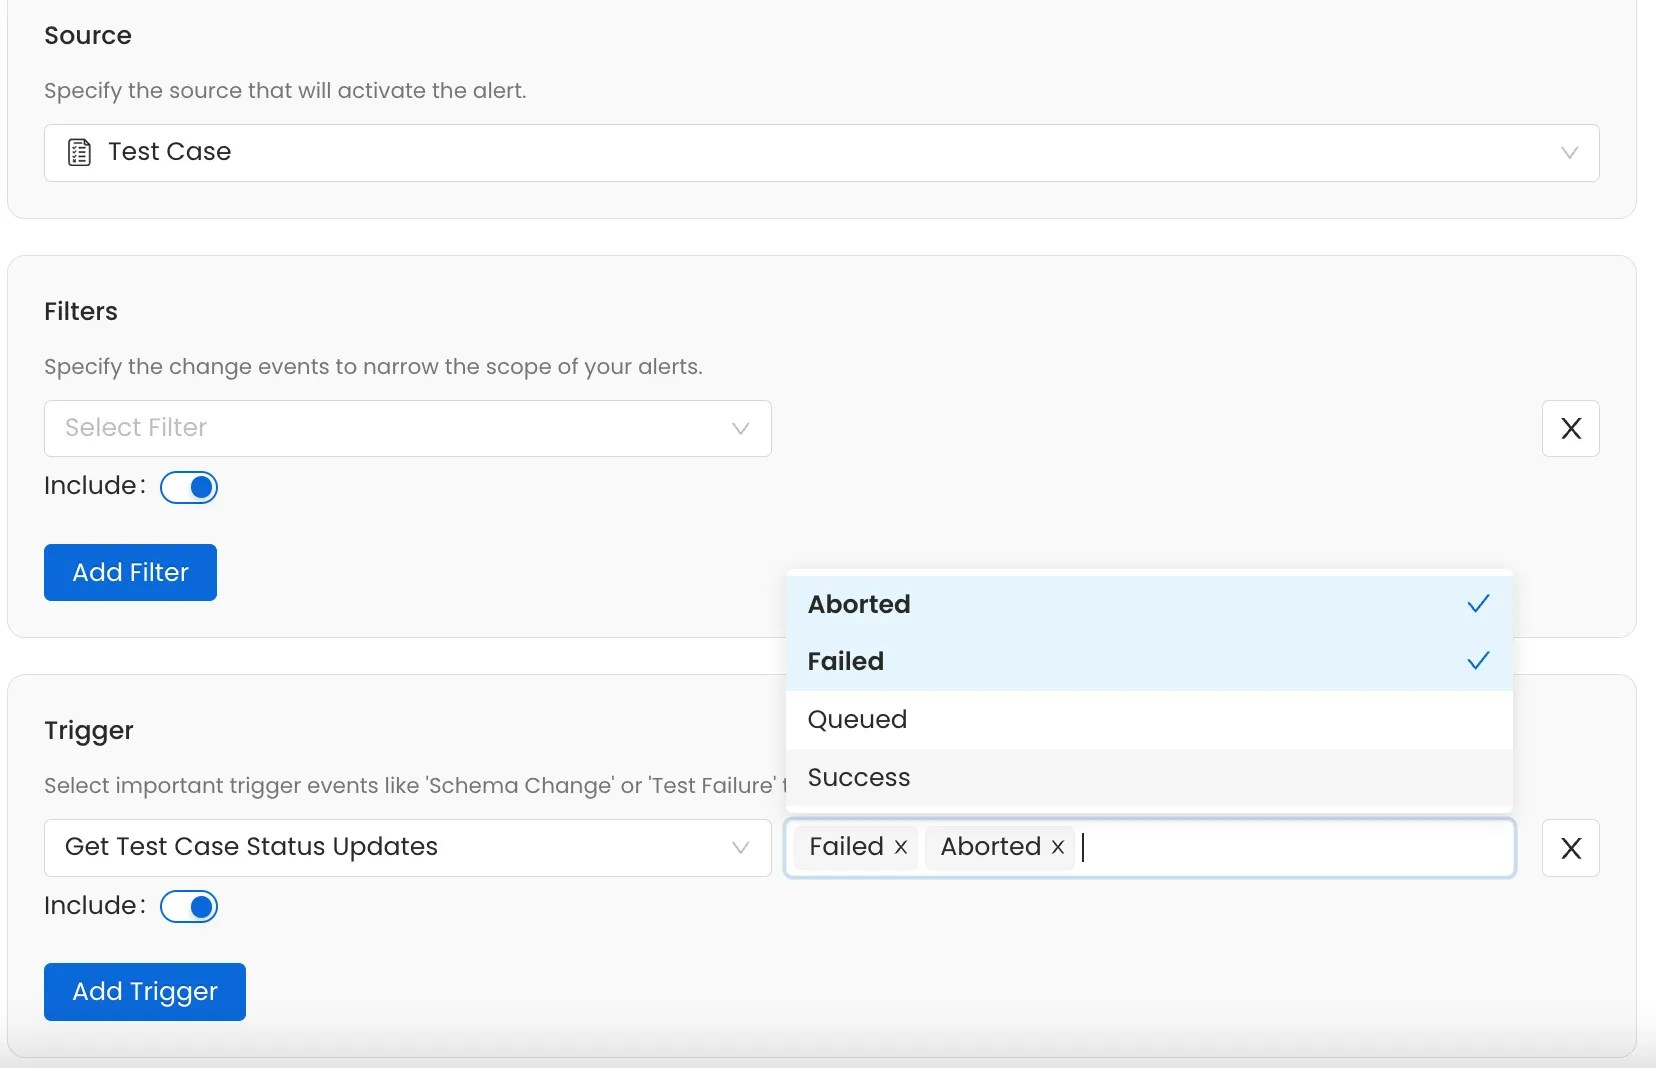
- Test Case Status - Trigger when a test result has a status you select:
Success,Failed,Aborted, orQueued. The alert fires on every matching result, not only when the status changes - Pipeline Status - Alert when pipeline execution has a status you select:
Successful,Failed,Pending, orSkipped - Metric Updates - Notify when table metrics are updated
Step 6: Select Destination
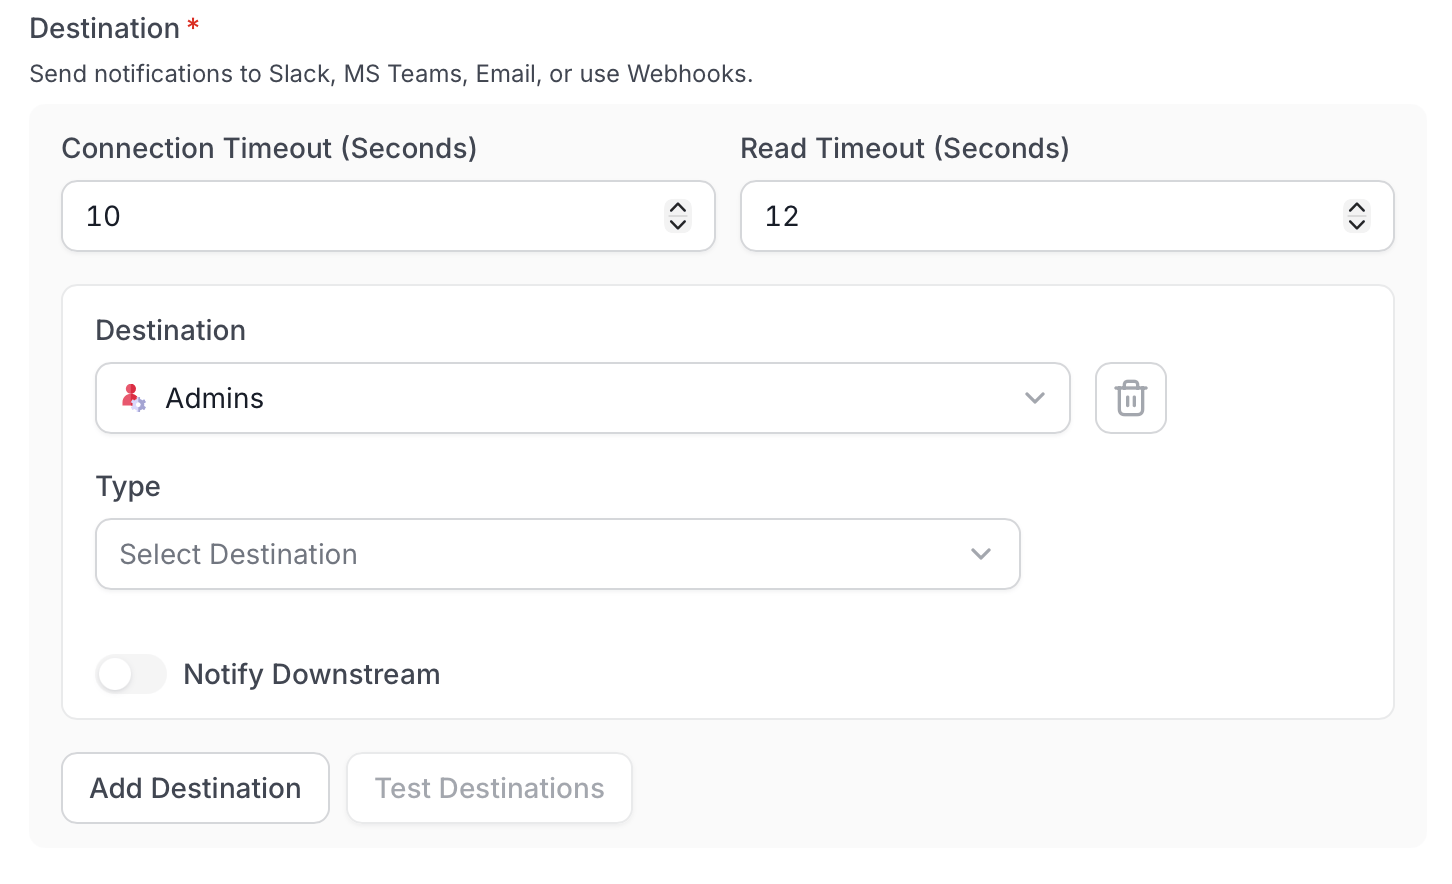
- Set the Connection Timeout (Seconds) (default: 10) and Read Timeout (Seconds) (default: 12) to control how long Collate waits when connecting to external endpoints.
- Select Add Destination to add one or more notification targets.
-
Select from Internal or external notification channels. The Internal options depend on the sources you chose:
-
Internal:
- Admins - Notify all platform administrators
- Assignees - Notify users assigned to the asset
- Followers - Notify users following the asset
- Mentions - Notify users mentioned on the asset
- Owners - Notify the owners of the asset
- Teams or Specific Users - Target specific teams or individual users
-
External — select a Type:
- G Chat
- Ms Teams
- Slack
- Webhook
-
Internal:
- (Optional) Enable Notify Downstream to also notify the stakeholders of assets downstream of the monitored entity. Notify Downstream works with the internal destinations only. For depth, recipients, and examples, see Notify Downstream.
Step 7: Select a Notification Template
The Notification Template controls the wording of the message this alert sends — its subject line and body. The alert fires on exactly the same events regardless of which template is chosen; only the text changes.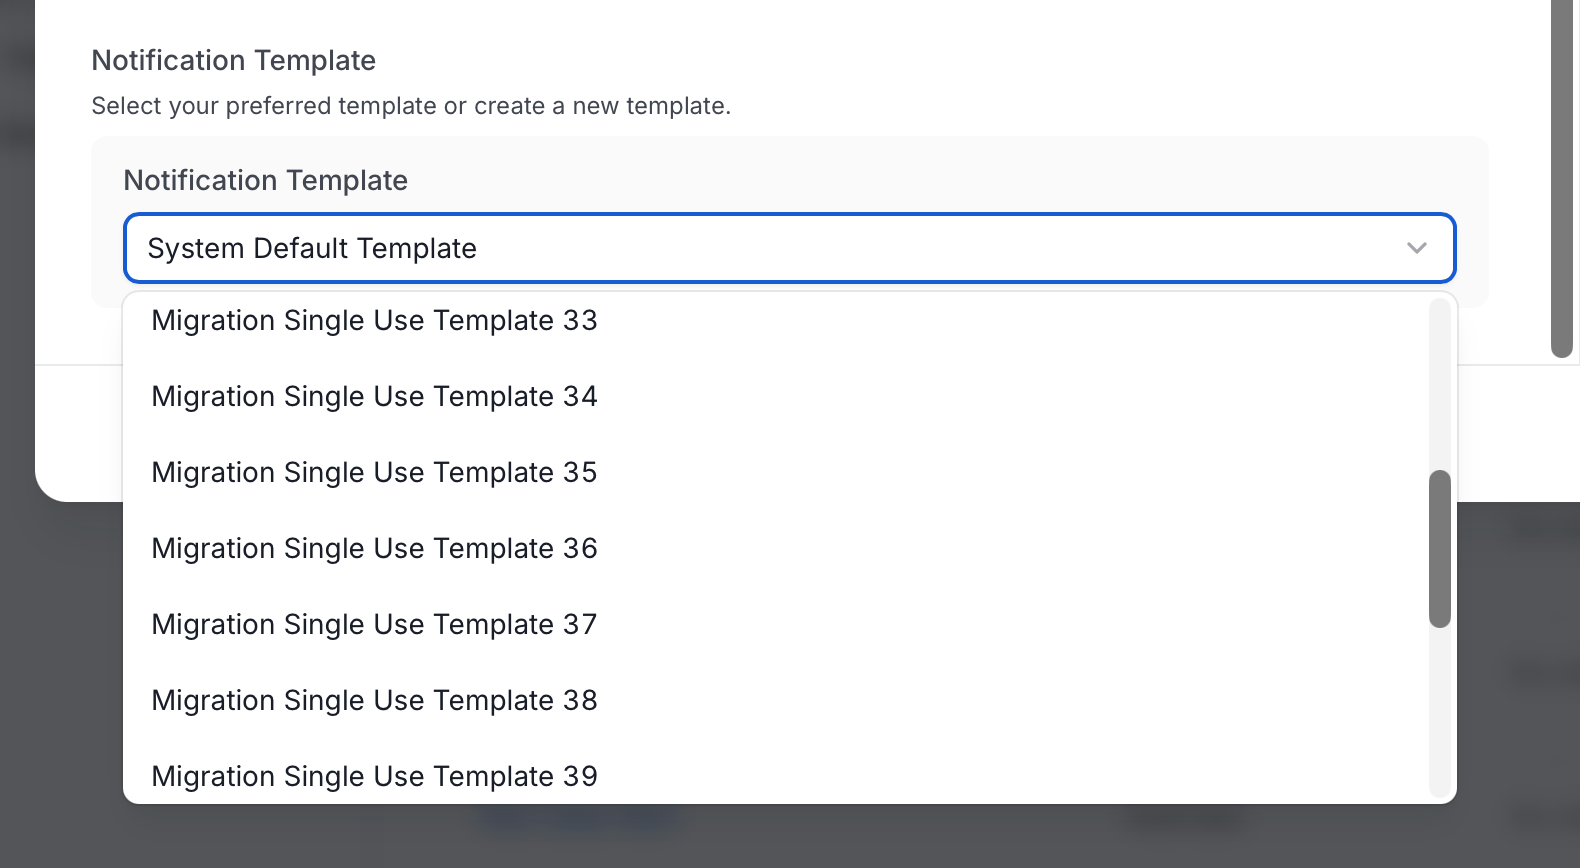
- System Default Template — the built-in wording, used when nothing else is selected. Suitable for most alerts and requires no upkeep.
- A saved template — a template already created in Notification Templates and reusable across alerts. Its name, subject, and body appear below the picker for reference (read-only). Edit it from Notification Templates to update it everywhere it is used.
- Create Custom Template — wording written here and belonging to this alert alone. Editing it affects no other alert.
Writing a Custom Template
Subject and body support Handlebars placeholders, so one template adapts to whatever event fired it. Values are nested under two objects:entity— the asset the event happened to:{{entity.name}},{{entity.displayName}},{{entity.fullyQualifiedName}},{{entity.updatedBy}}event— the event itself:{{event.eventType}},{{event.entityType}},{{event.userName}},{{event.timestamp}}
{{publisherName}} (the alert’s own name) and {{emailingEntity}} are also available at the top level.
Three helpers are available for values a plain placeholder cannot produce:
{{buildEntityUrl entity}}— a link back to the asset{{formatDate event.timestamp}}— a human-readable timestamp{{camelCaseToTitle name}}— converts a field name into a readable label
{{ in either field to browse the full set of available helpers.
Example:
Native Pipeline Alert Boundaries
Native pipeline alerts react to status events reported to Collate. They do not evaluate whether an expected event is missing or whether a run took longer than a threshold.
The same boundary applies to Automations jobs: their reported failure and partial-success states can trigger native alerts, but missed schedules and duration thresholds require an external check.
For an external check on Collate ingestion pipelines and Automations jobs, query
GET /api/v1/services/ingestionPipelines/{fqn}/pipelineStatus. Use startTs and endTs to select a time window. The response includes pipelineState, startDate, and endDate for each run.
For an ingested pipeline asset, such as an Airflow, Dagster, or Fivetran pipeline, query GET /api/v1/pipelines/{fqn}/status with the same startTs and endTs parameters. The response includes executionStatus, timestamp, endTime, and taskStatus for each run. The timestamp field identifies the run and is not a reliable wall-clock time, so use endTime and the task start and end times to measure duration.
A monitoring script can compare these values with the expected schedule or duration threshold before sending a notification.
Related Reference
These pages cover alert behavior, webhook delivery, and the API.- Alert Behavior Reference: every source, trigger, and filter, and exactly when each alert fires.
- Webhook Payloads and Delivery: payloads, authentication, failures, and duplicates.
- Alerts API: create and manage alerts with the REST API and Python SDK.