Users can view insights for individual services using the Service Insights tab. This guide provides an overview of the available charts and outlines troubleshooting steps when no data is displayed.
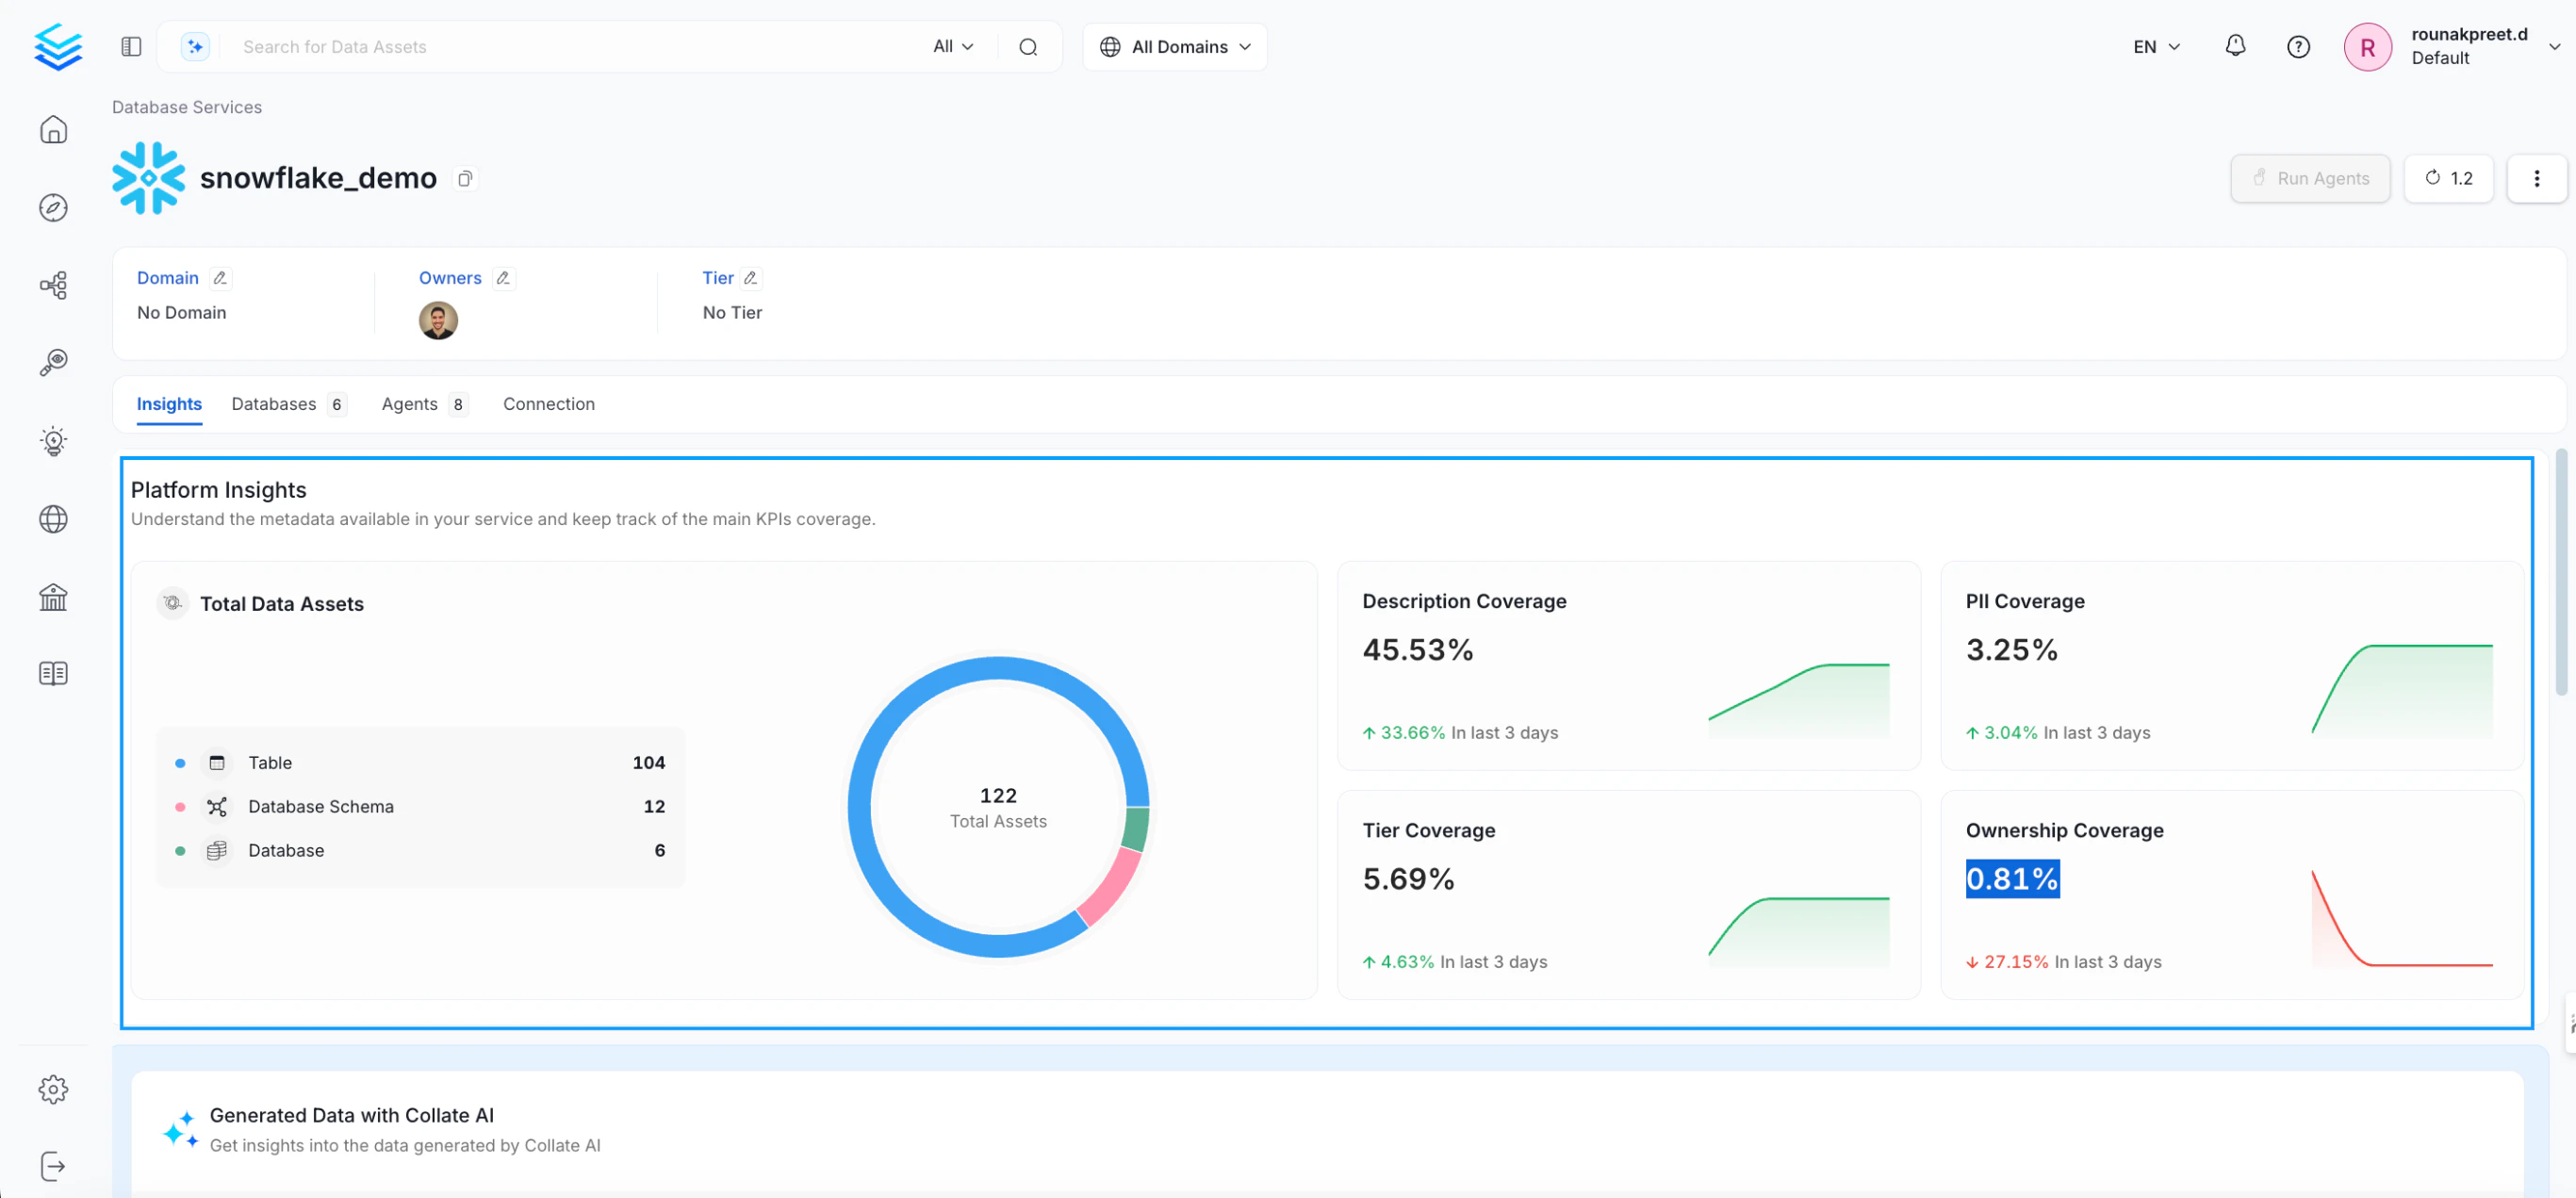
This chart displays the total number of data assets within a service, categorized by asset type. For example, in a database service, it shows the count of tables, databases, database schemas, and stored procedures.
Tip: If no data is displayed, ensure that the metadata ingestion pipeline has been executed successfully.
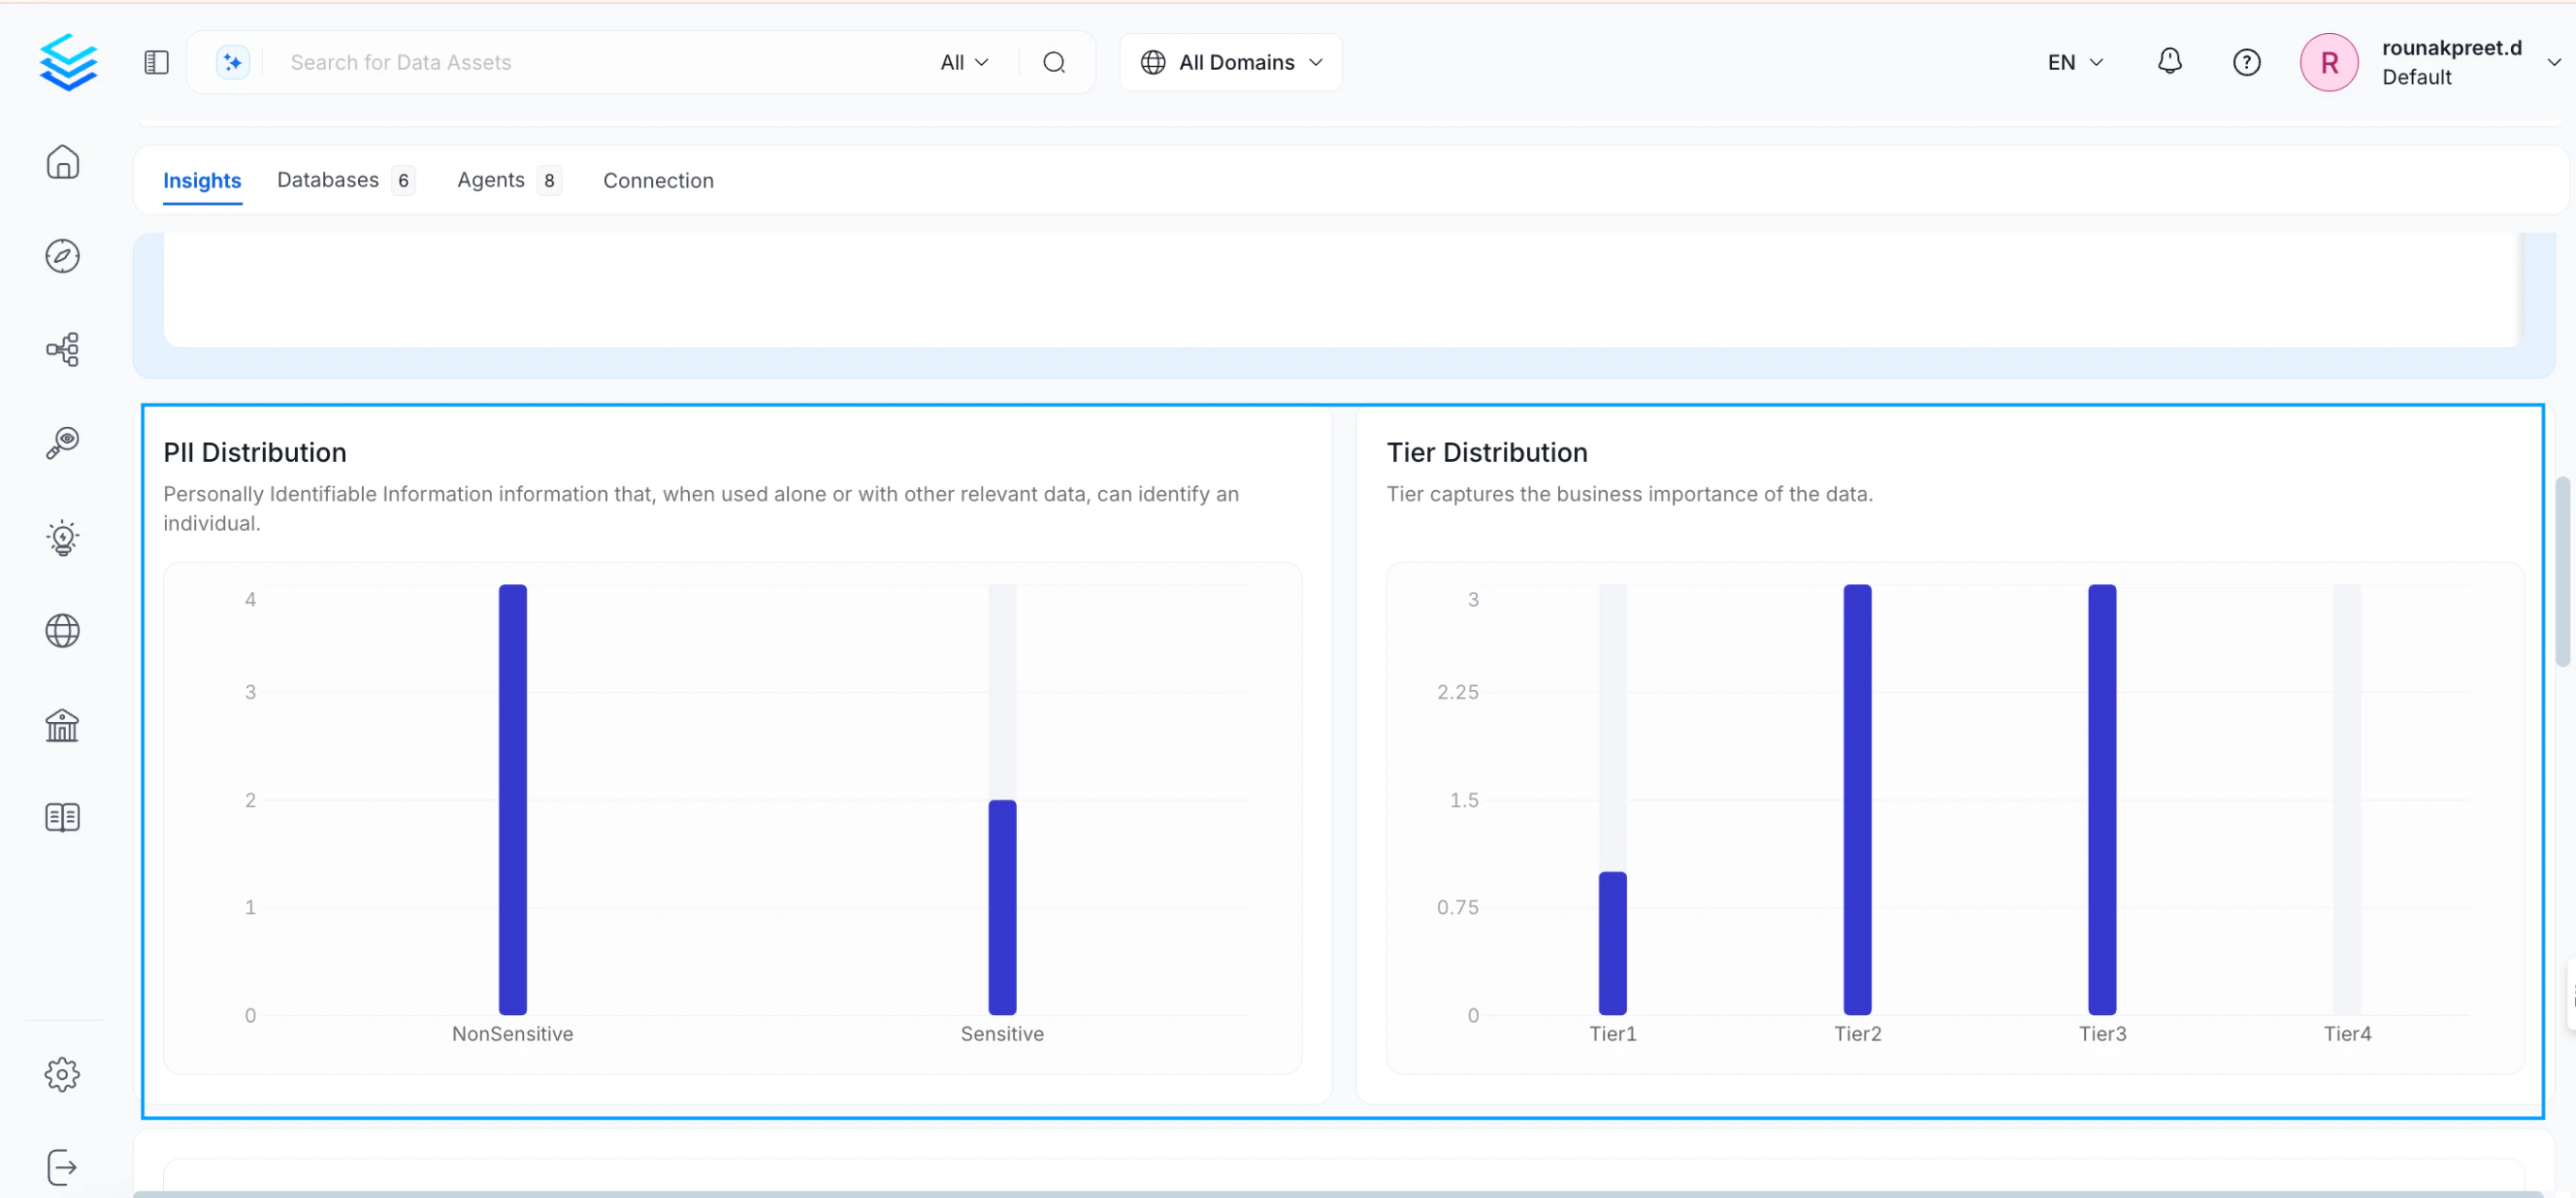
This chart displays the percentage of data assets containing columns tagged with Personally Identifiable Information (PII) tags.
Tip: If the chart does not show any data, ensure that both the Auto Classification pipeline and the Data Insights pipeline have been successfully executed.
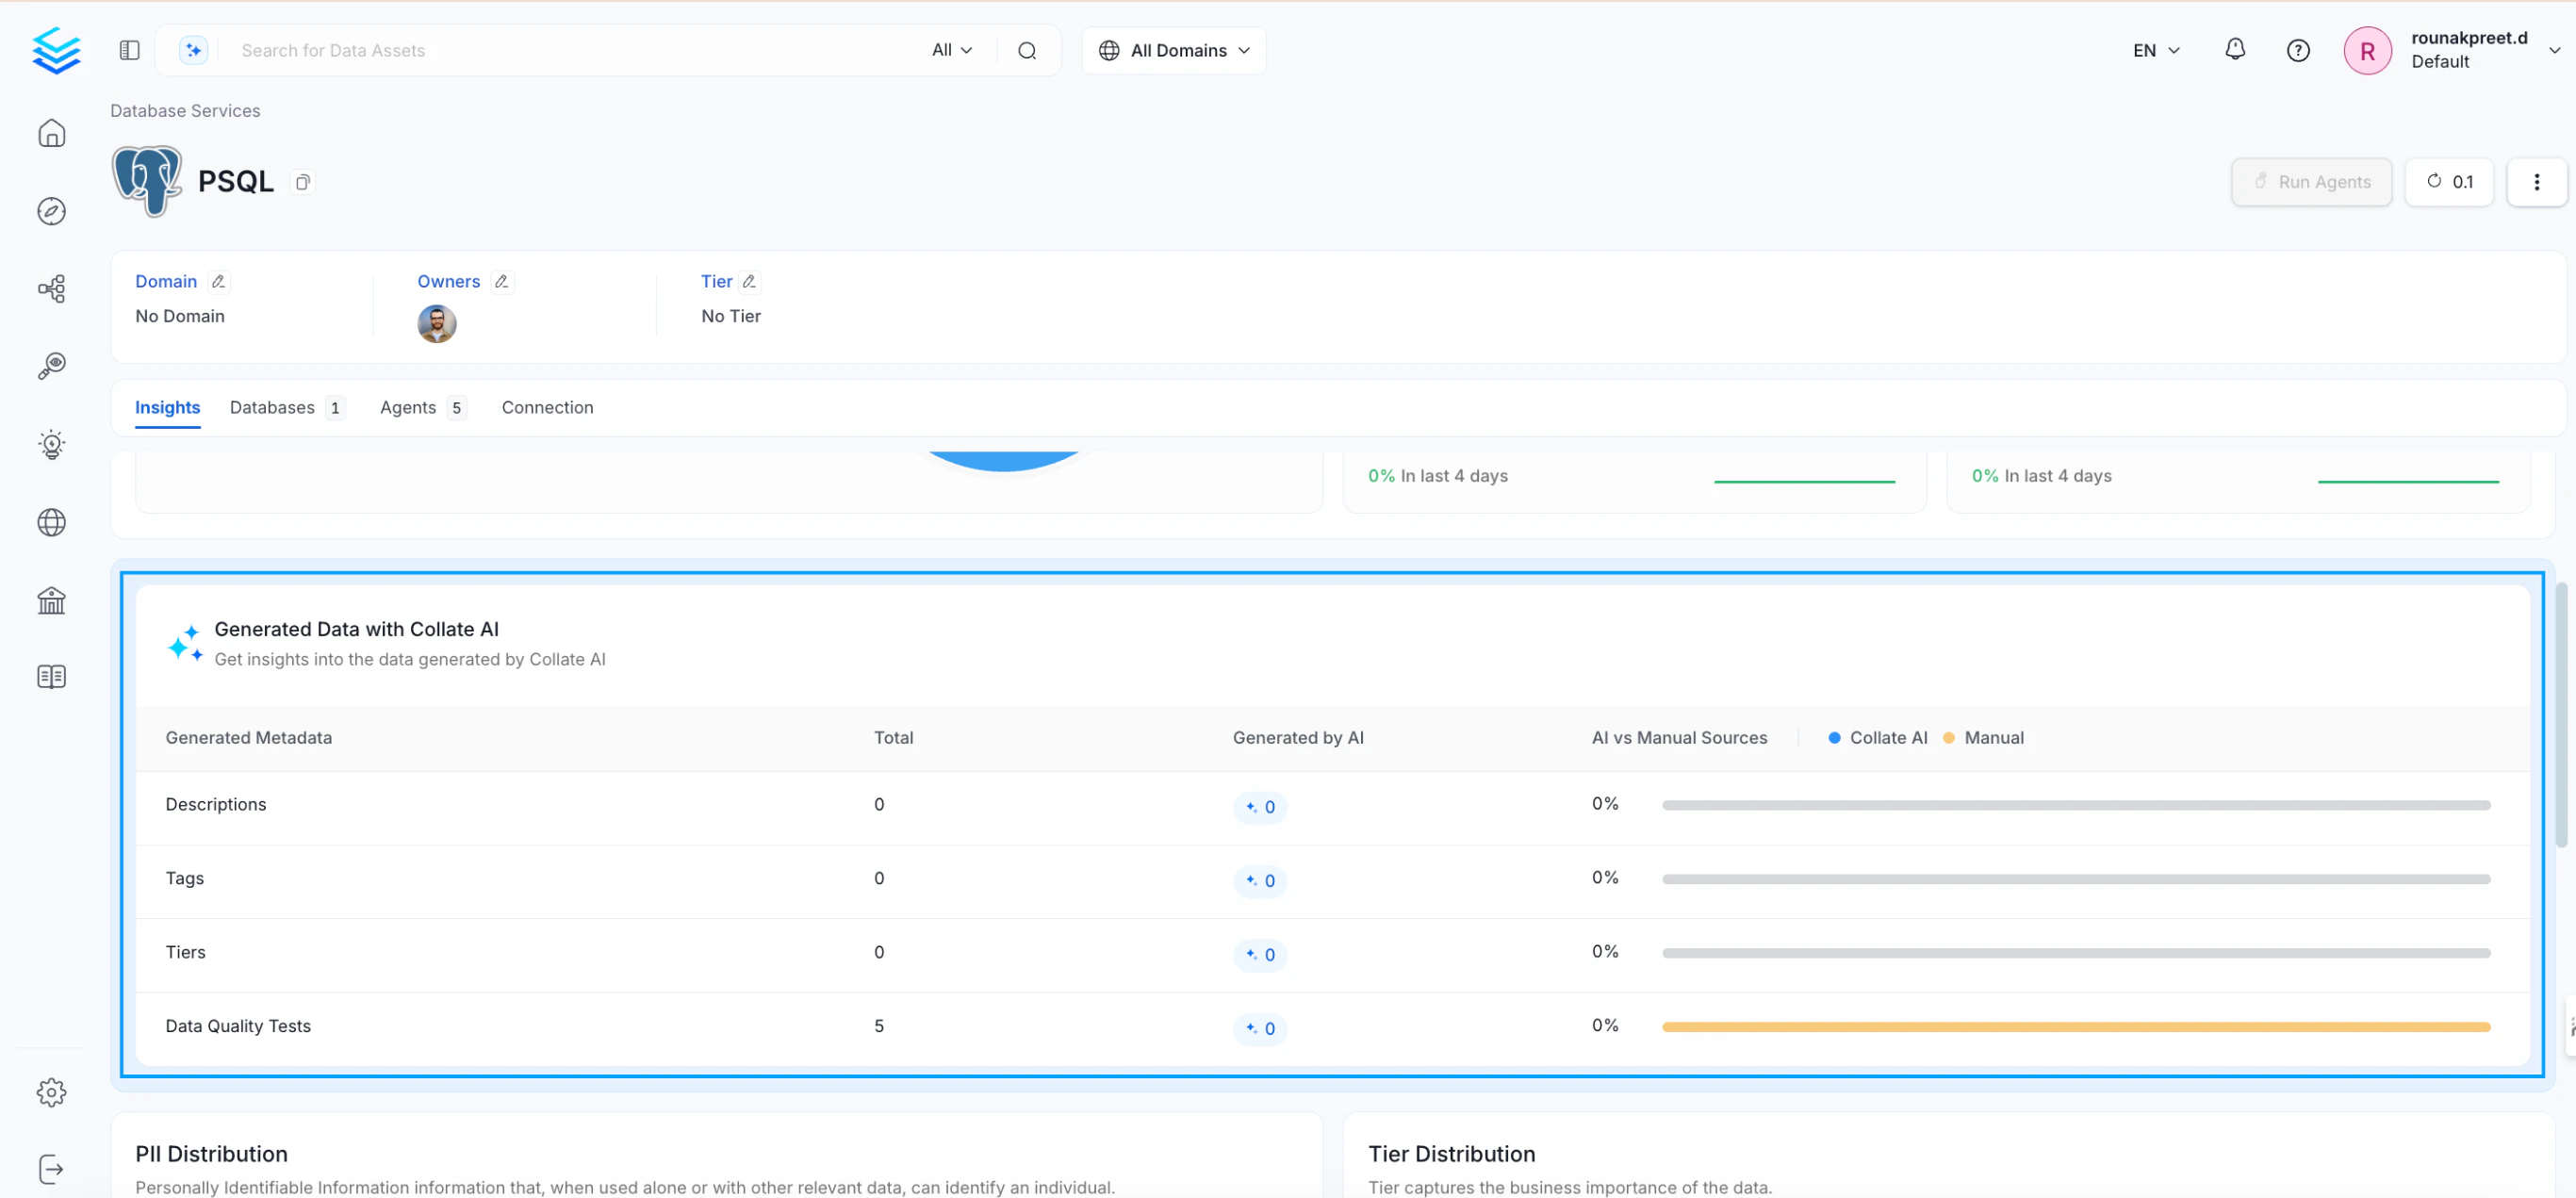
This table displays a breakdown of metadata populated by the Collate AI agent versus metadata populated manually.
Tip: If the table shows no data, ensure that the Auto Classification pipeline, Auto Data Quality (DQ) pipeline, Auto Tiering pipeline, Collate AI application, and Data Insights application have been executed successfully.
This table provides a breakdown of data assets based on their assigned Tier classification.
Tip: If the table displays no data, ensure that the Auto Tiering pipeline (Collate only) and the Data Insights application have been executed successfully.
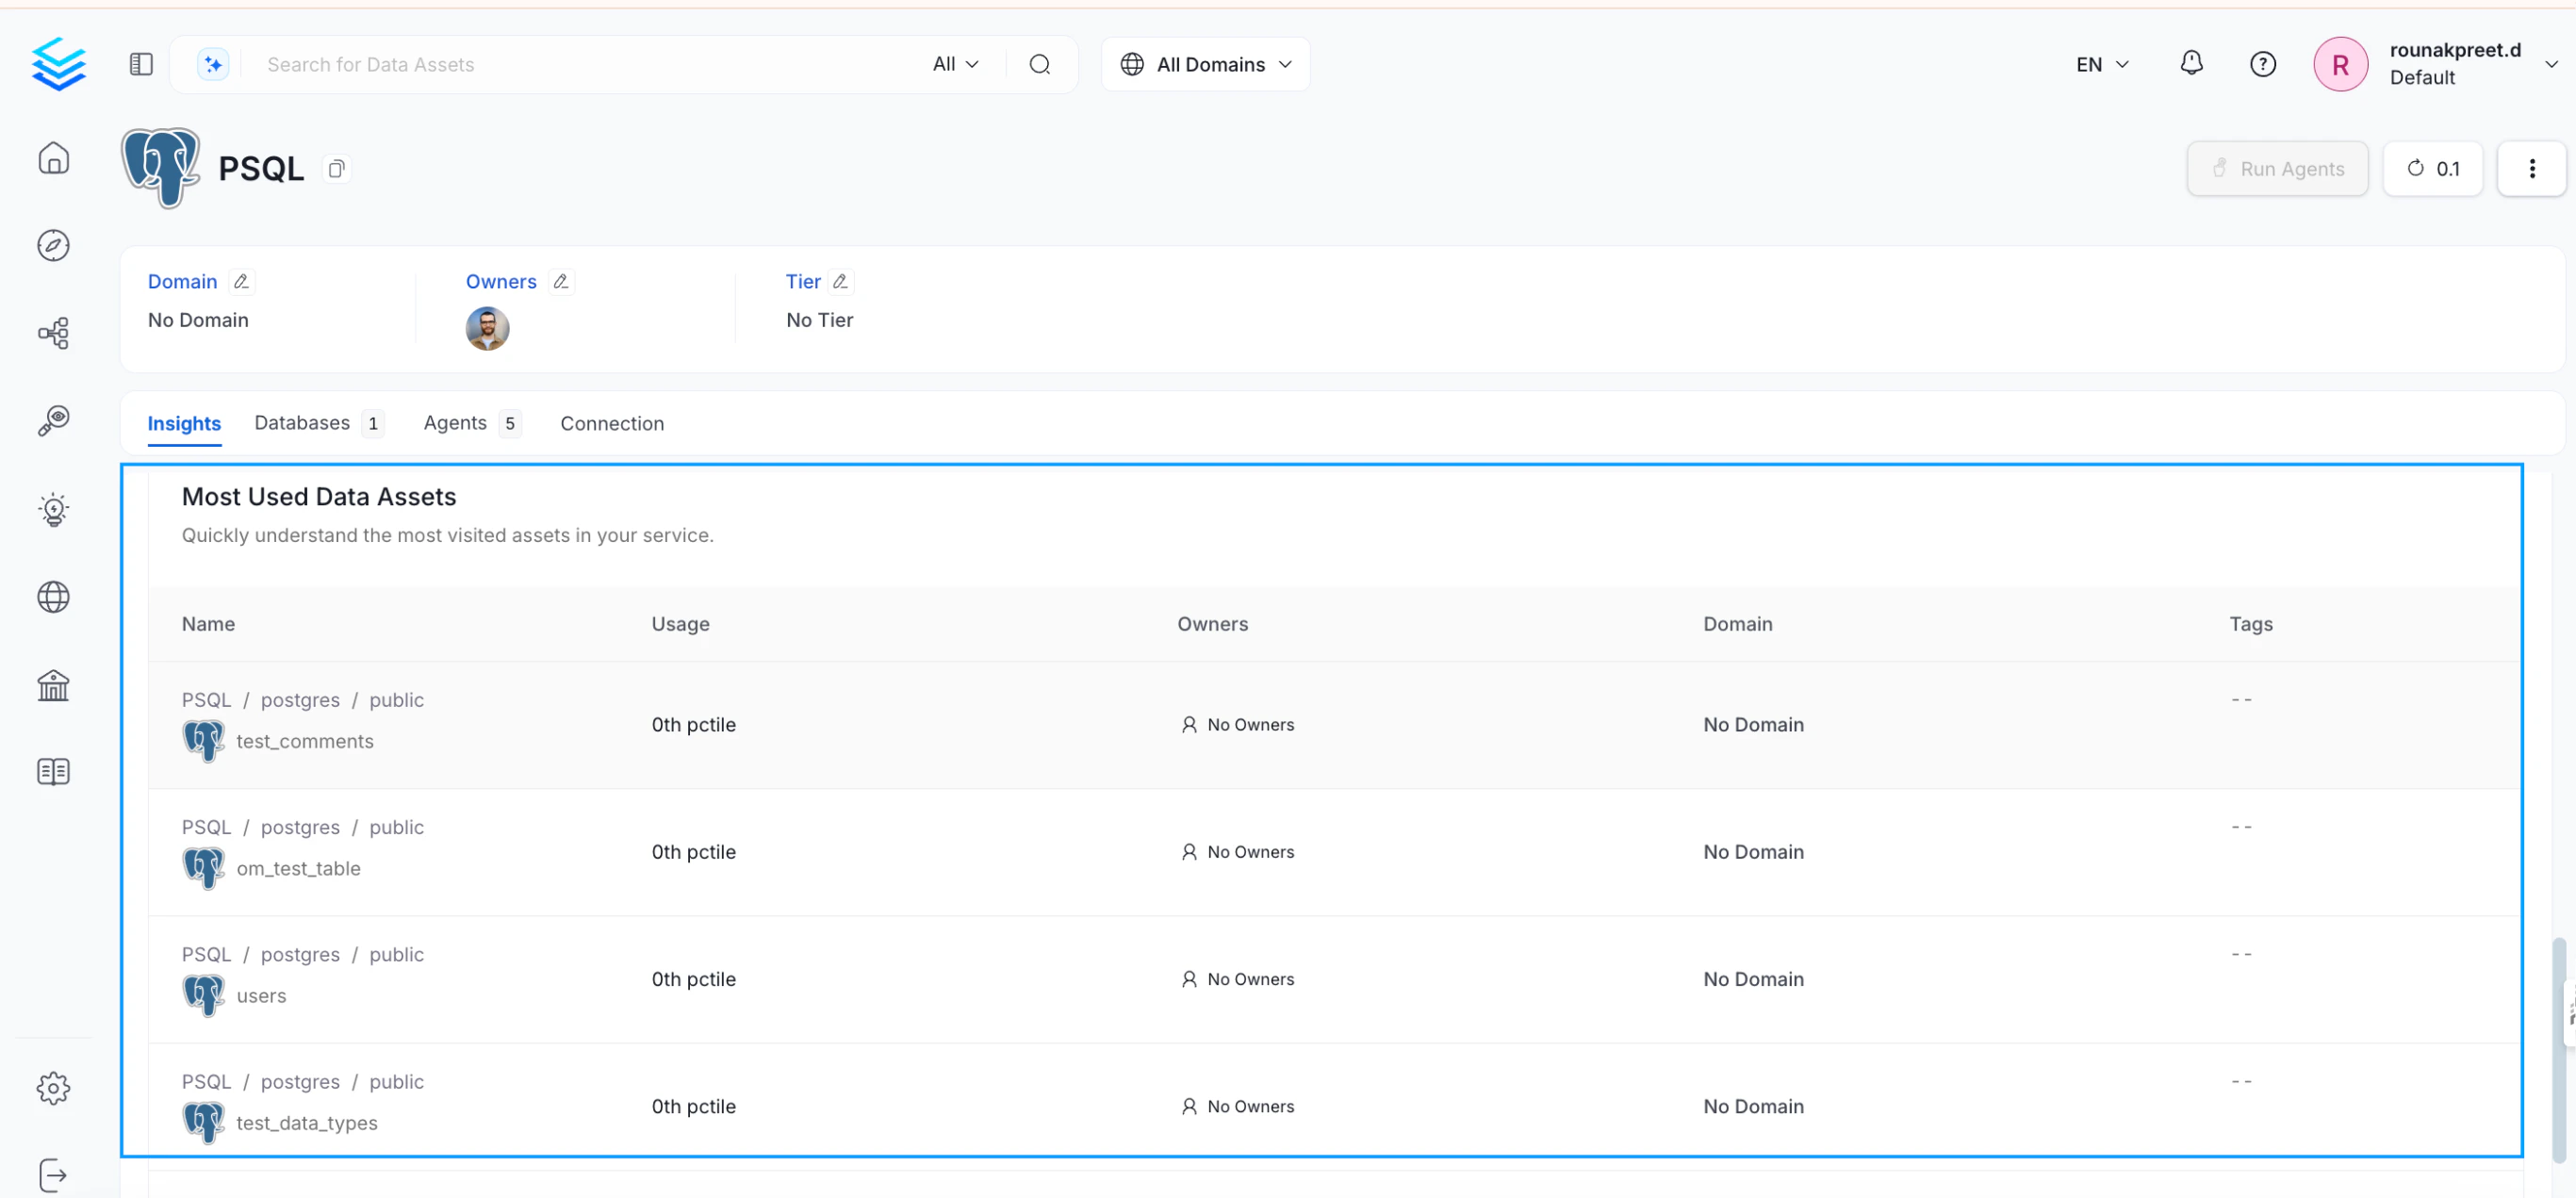
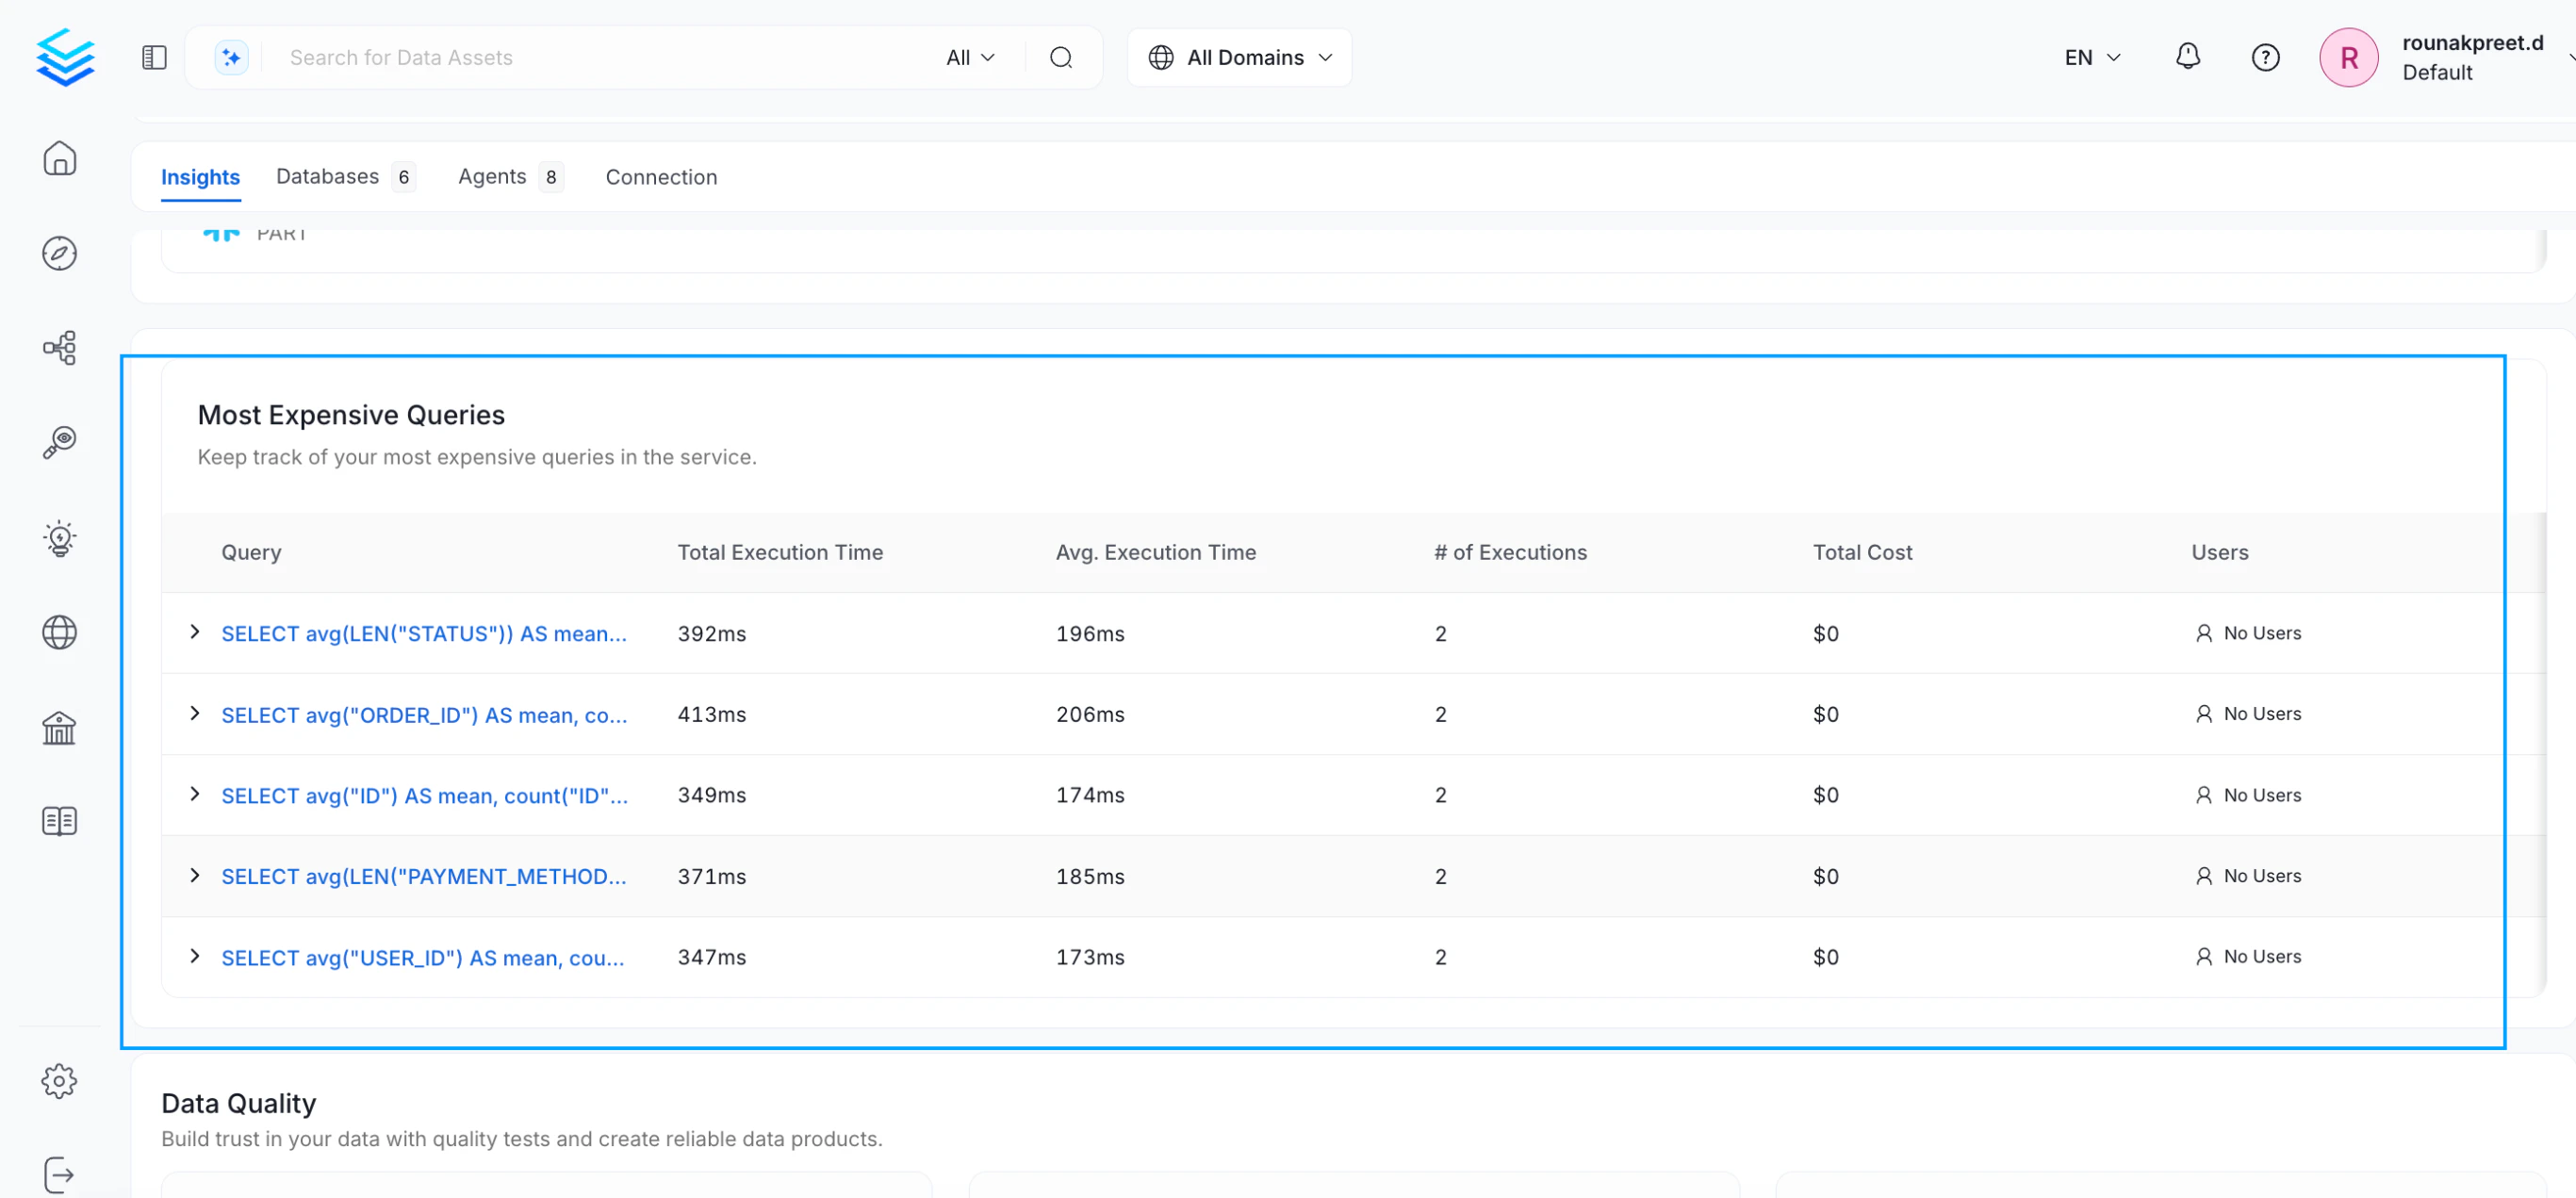
This table displays the top queries based on the cost of query execution.
Tip: If the table shows no data, verify that the usage pipeline has been executed successfully. Additionally, not all connectors support extracting query cost—ensure that your connector supports this feature.