How to Visualize Test Results
Collate gives you two main entry points for reviewing test results: the Data Quality page and the table page.From the Data Quality Page
Navigate to Observability > Data Quality. The page has three tabs:- Summary: Data health, data dimensions, and overall test results.
- Test Cases: Every test case, with filters.
- Test Suites: Test results grouped by test suite.
View Results by Test Suite
To look at your tests grouped by test suite, select the Test Suites tab. Use Table Suites and Bundle Suites to switch between the two kinds of suites. Each row shows the suite Name, the number of Tests, the Success %, and the Owners. To find a suite, enter its name in Search Table Suites.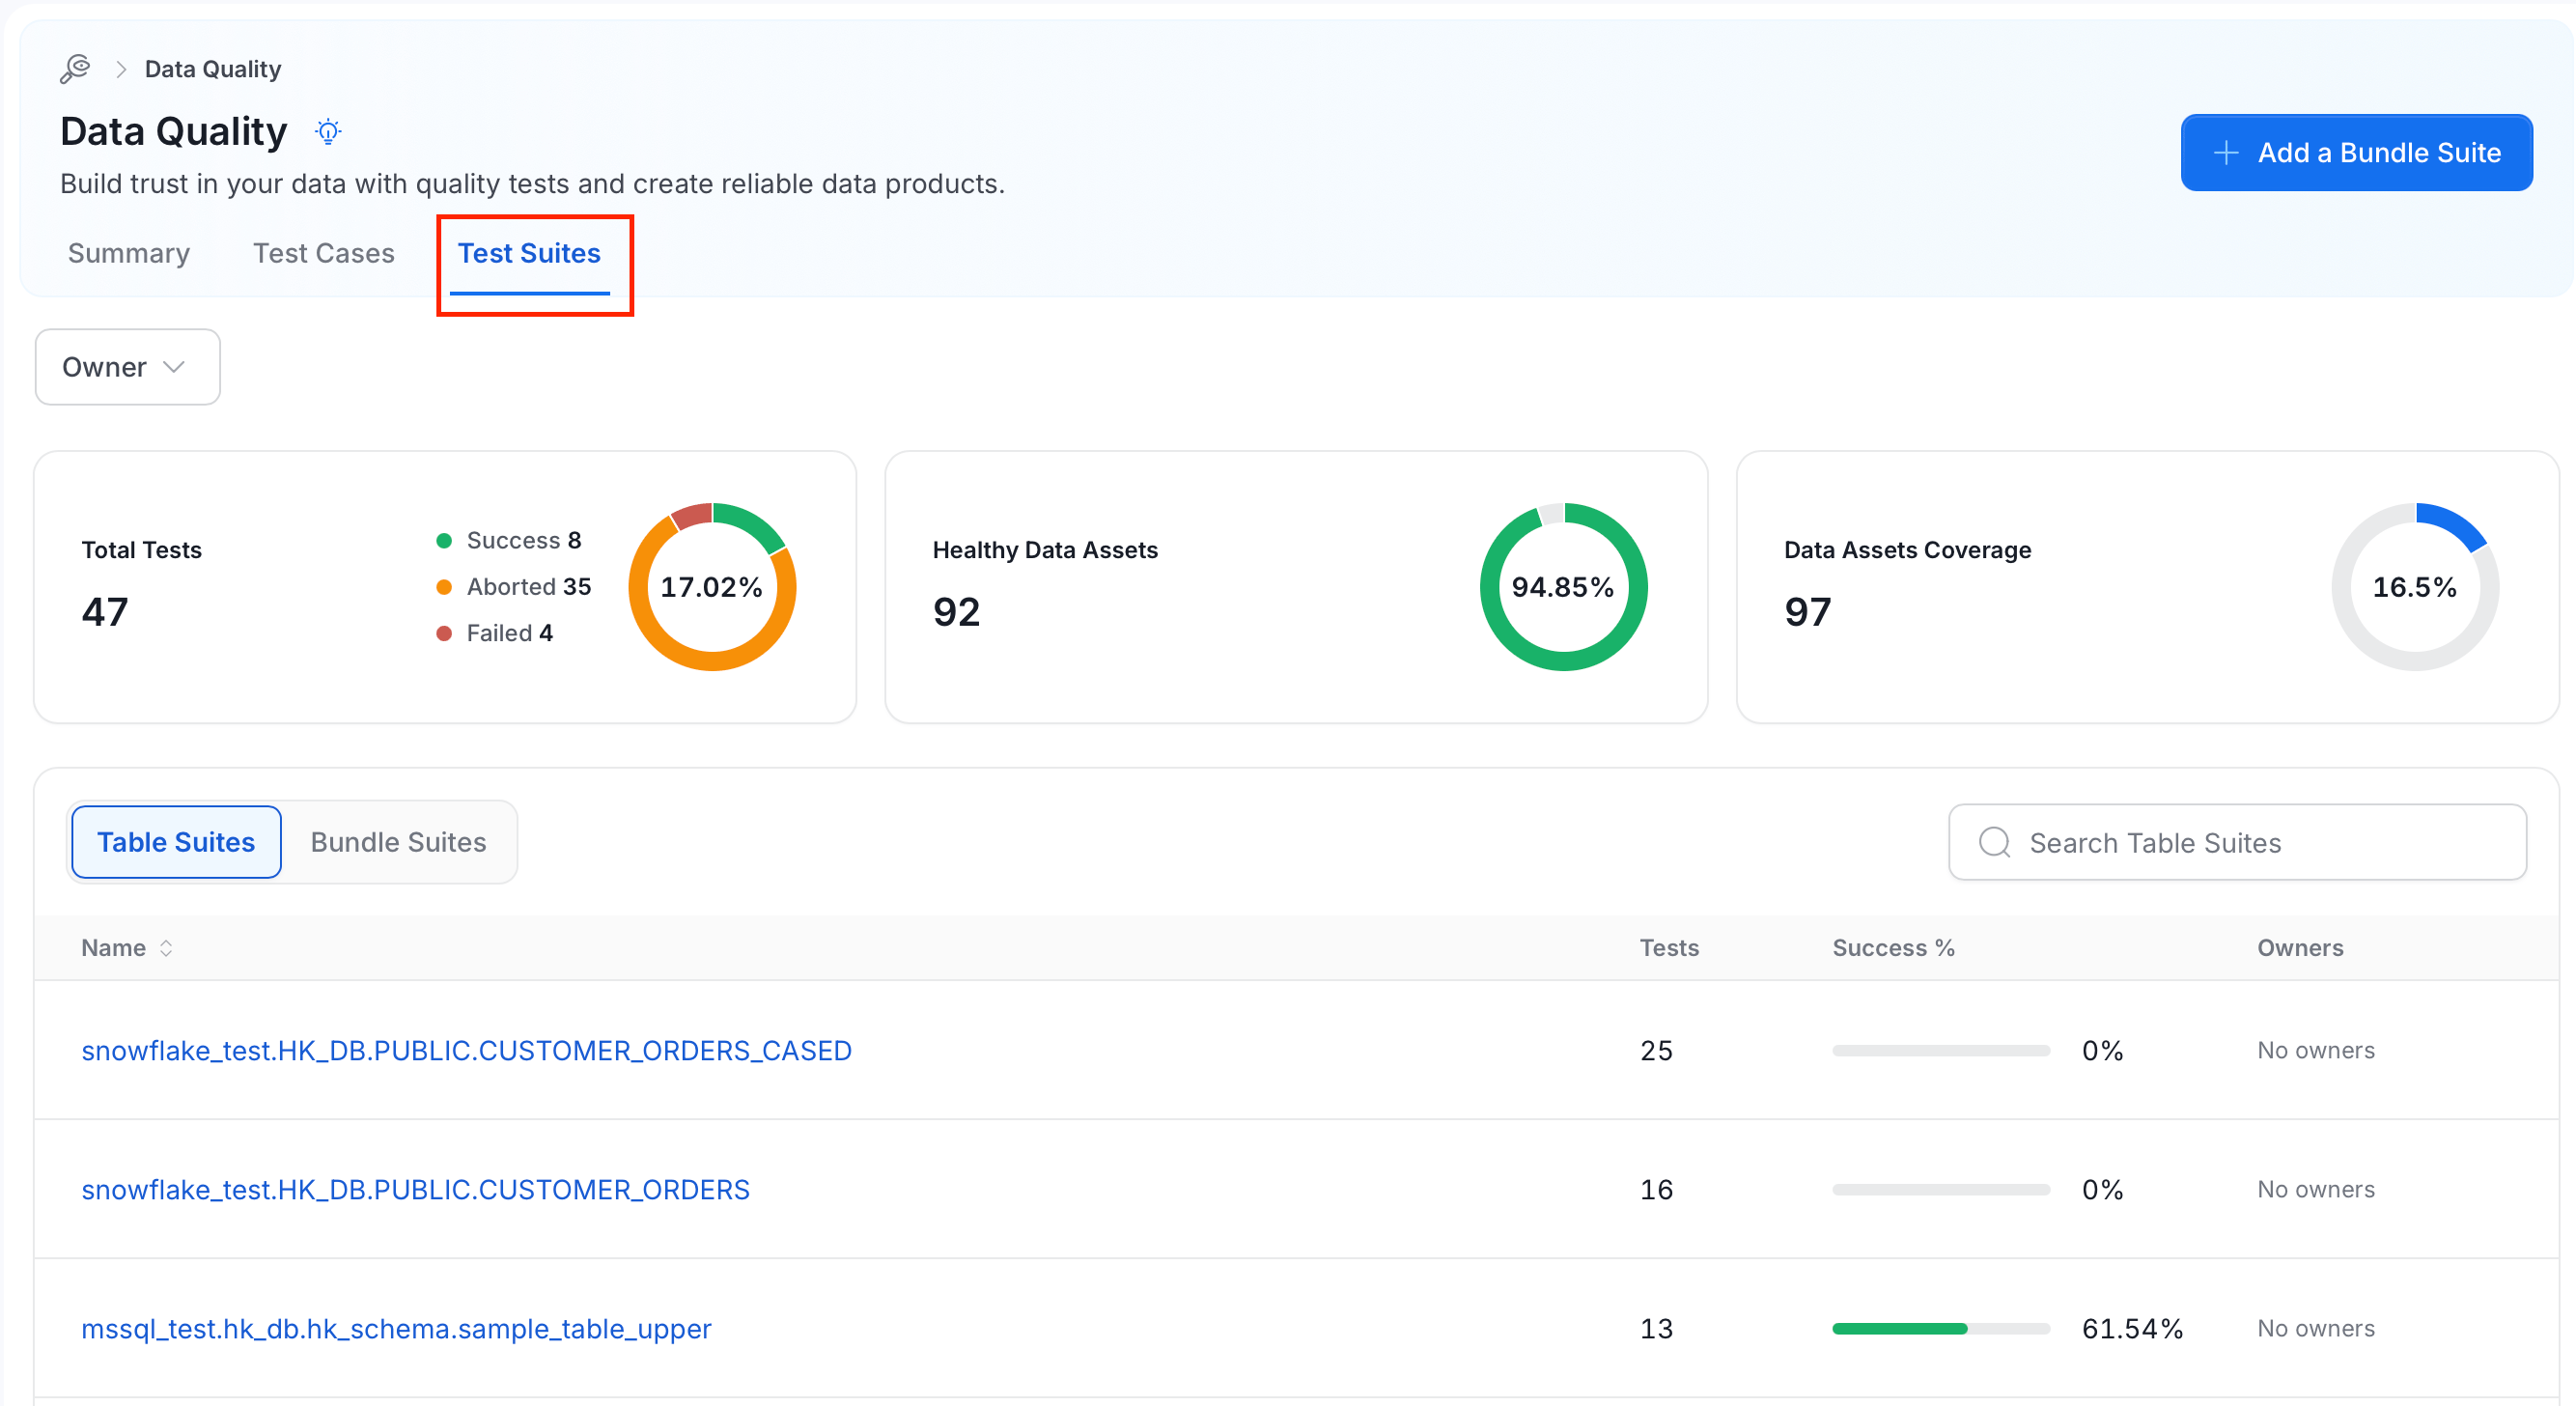
Filter Test Cases by Status
On the Test Cases tab, the filter bar has Advanced, Table, Type, Status, and Tags filters. Select Clear all to reset them.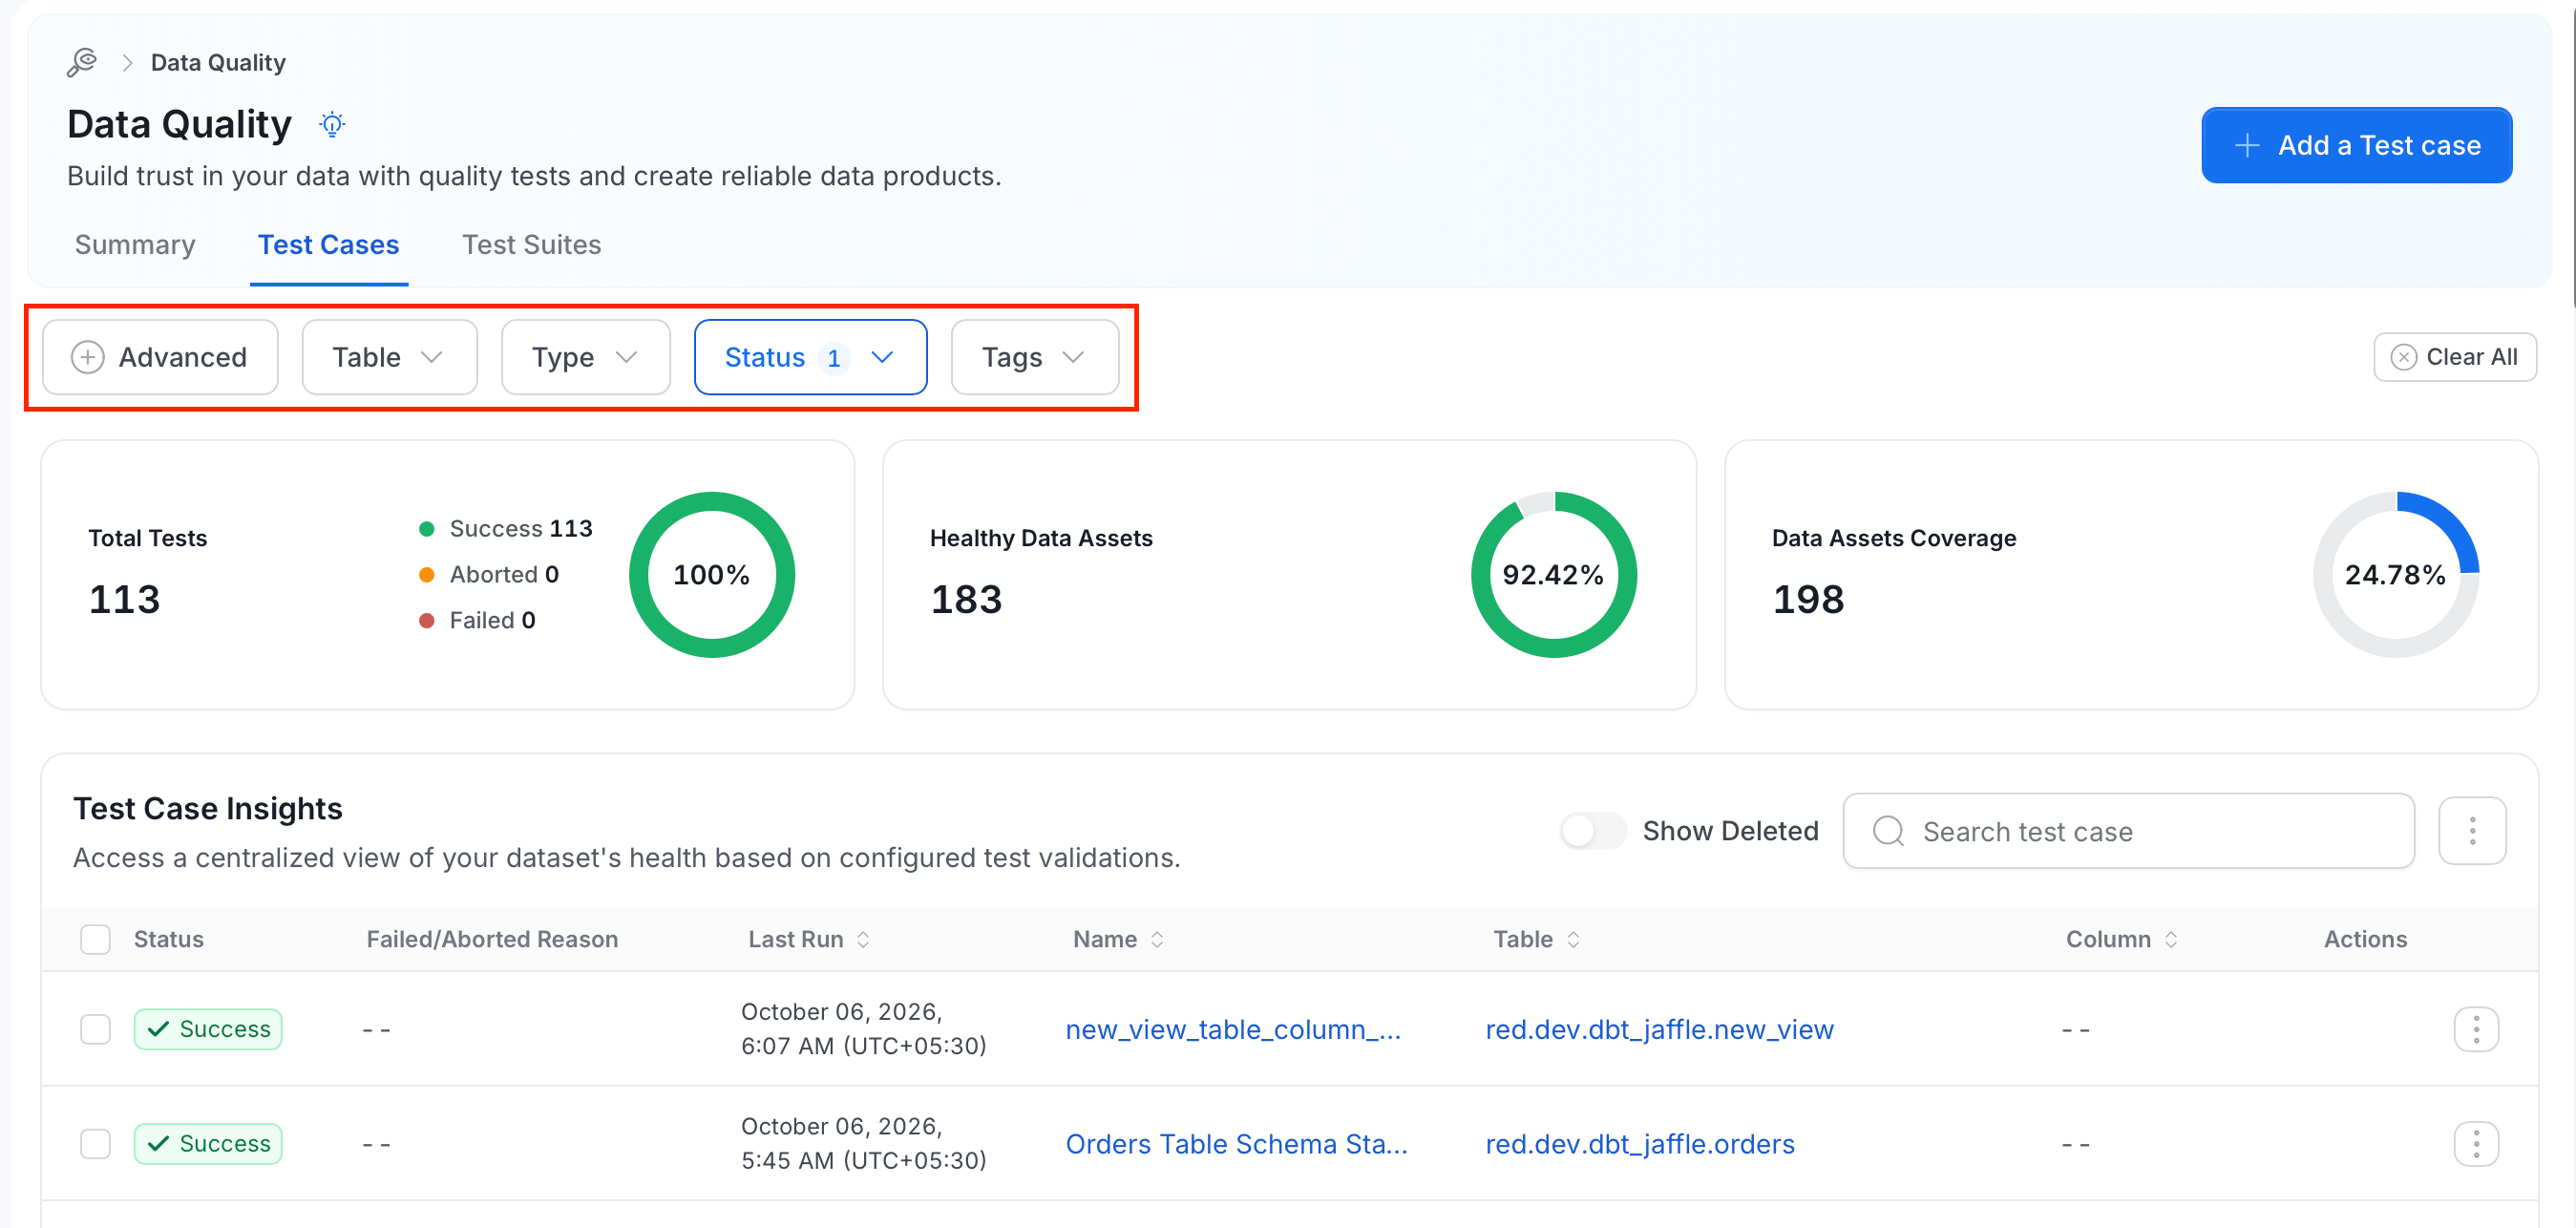
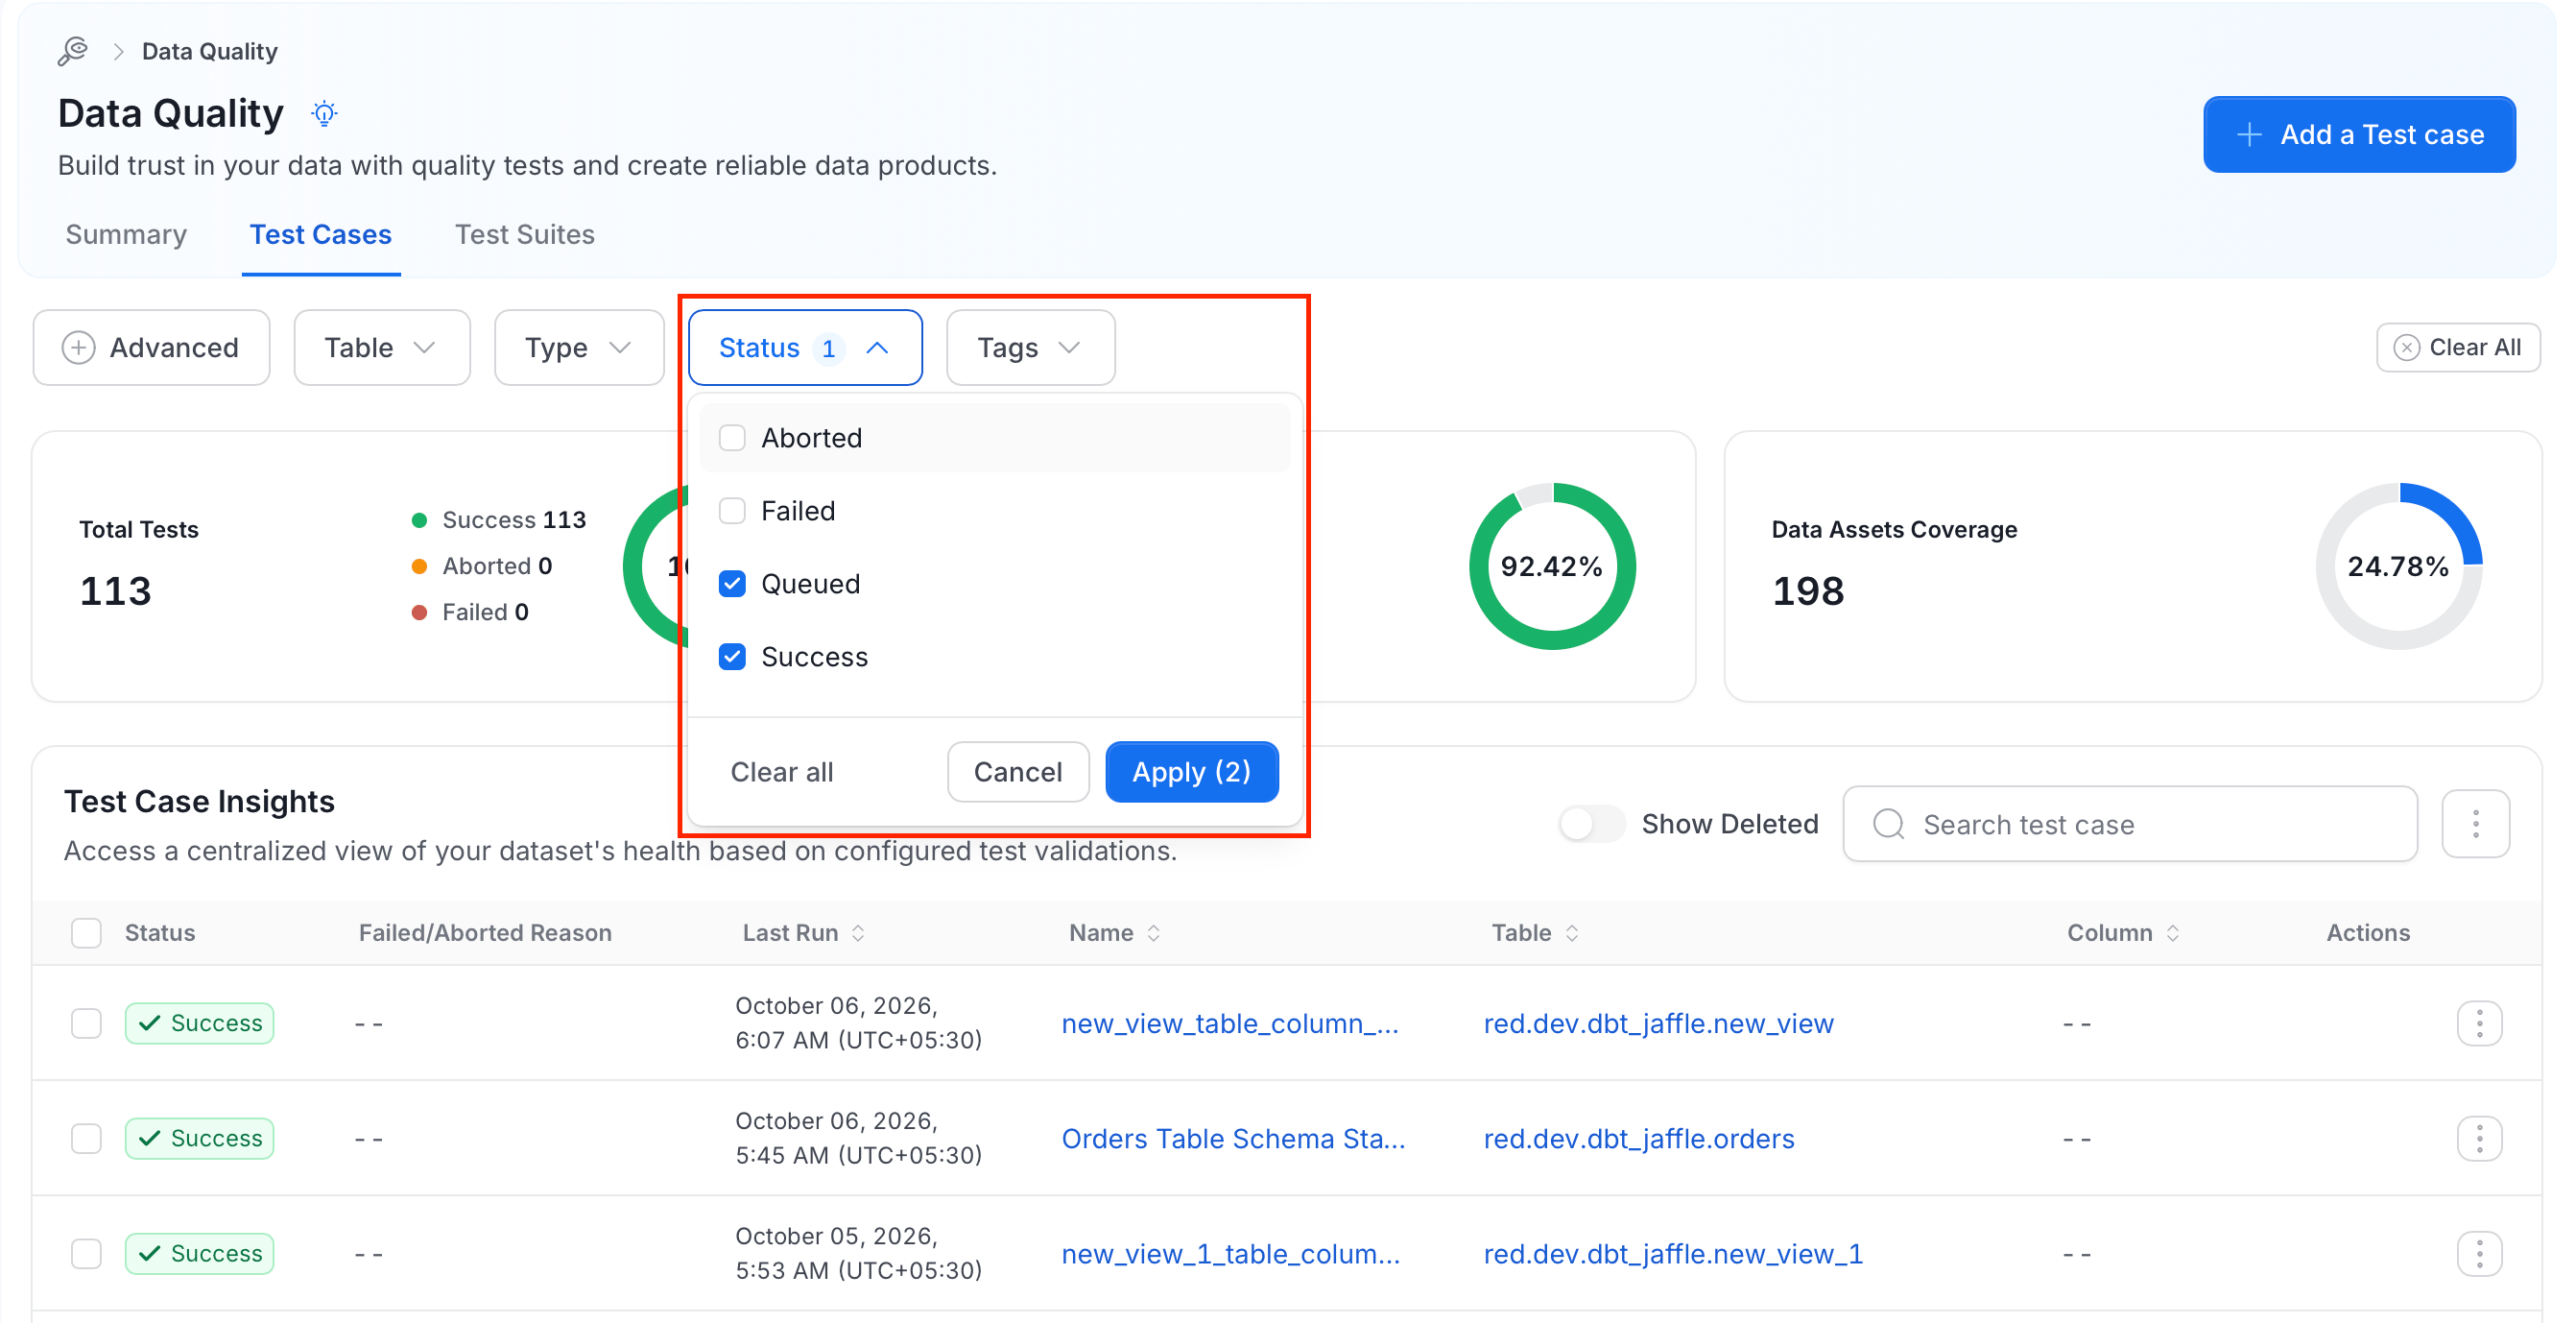
- Select Status.
- Select one or more of Aborted, Failed, Queued, and Success.
-
Select Apply. The button shows how many statuses you selected, for example Apply (2).
Open Test Cases From the Summary Tab
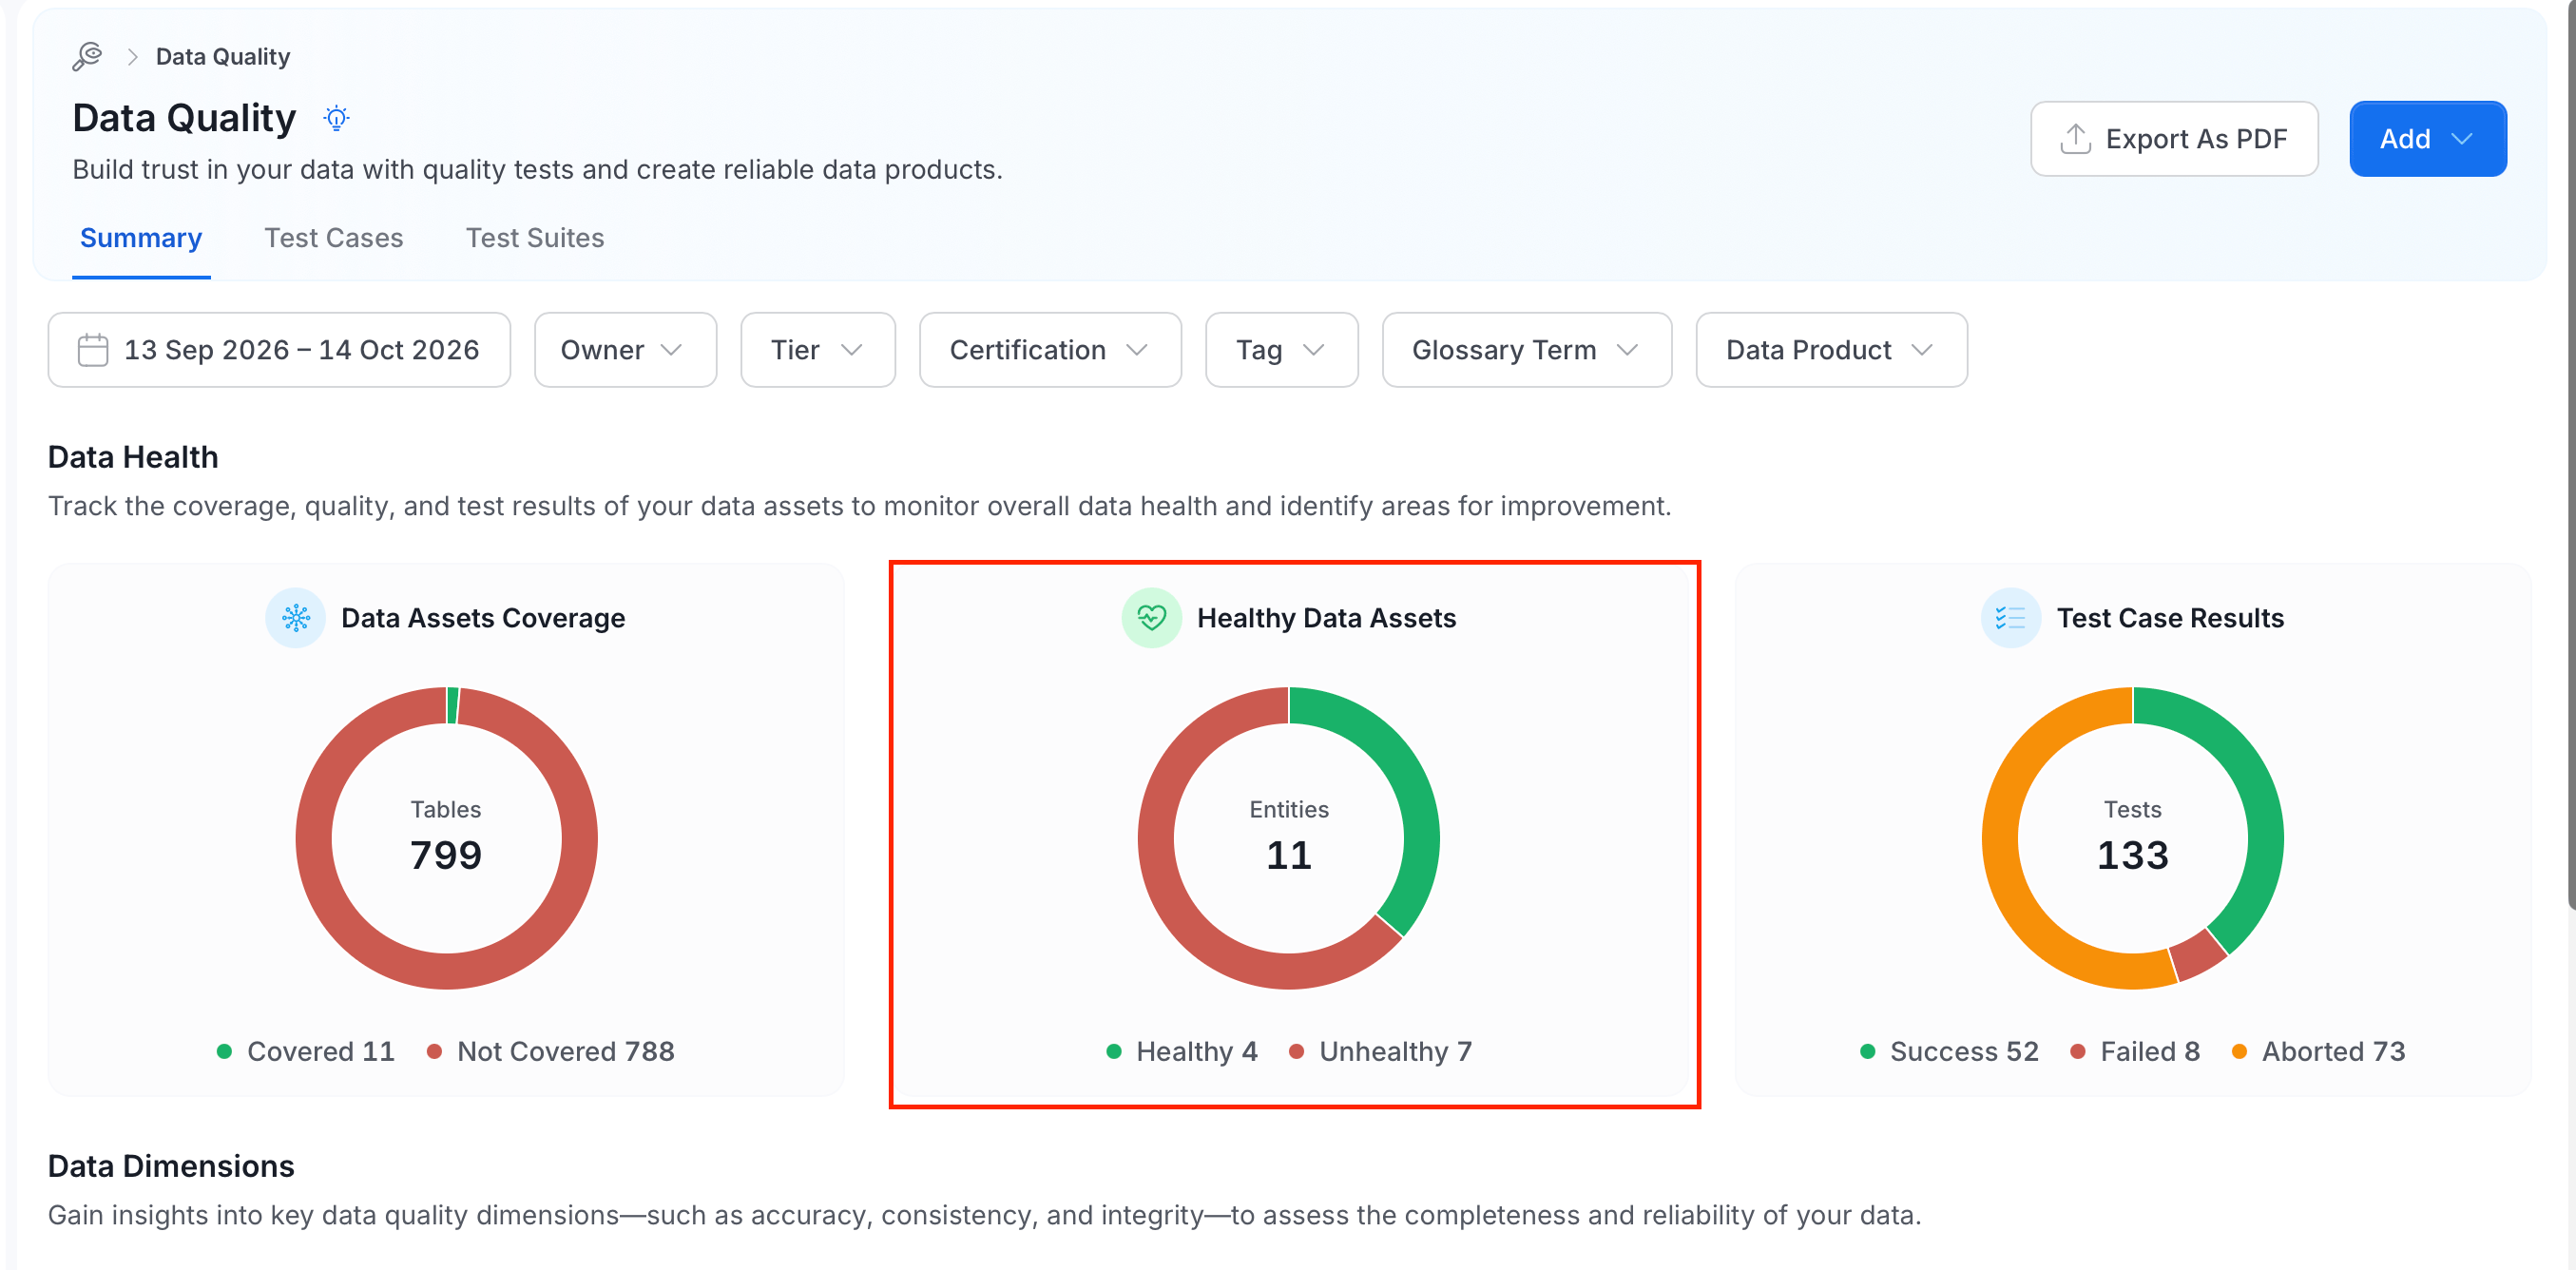
In Data Health on the Summary tab, the Healthy Data Assets card has a Healthy segment and an Unhealthy segment. Select a segment to open the Test Cases tab with the matching statuses already applied:- Healthy:
SuccessandQueued. - Unhealthy:
FailedandAborted.
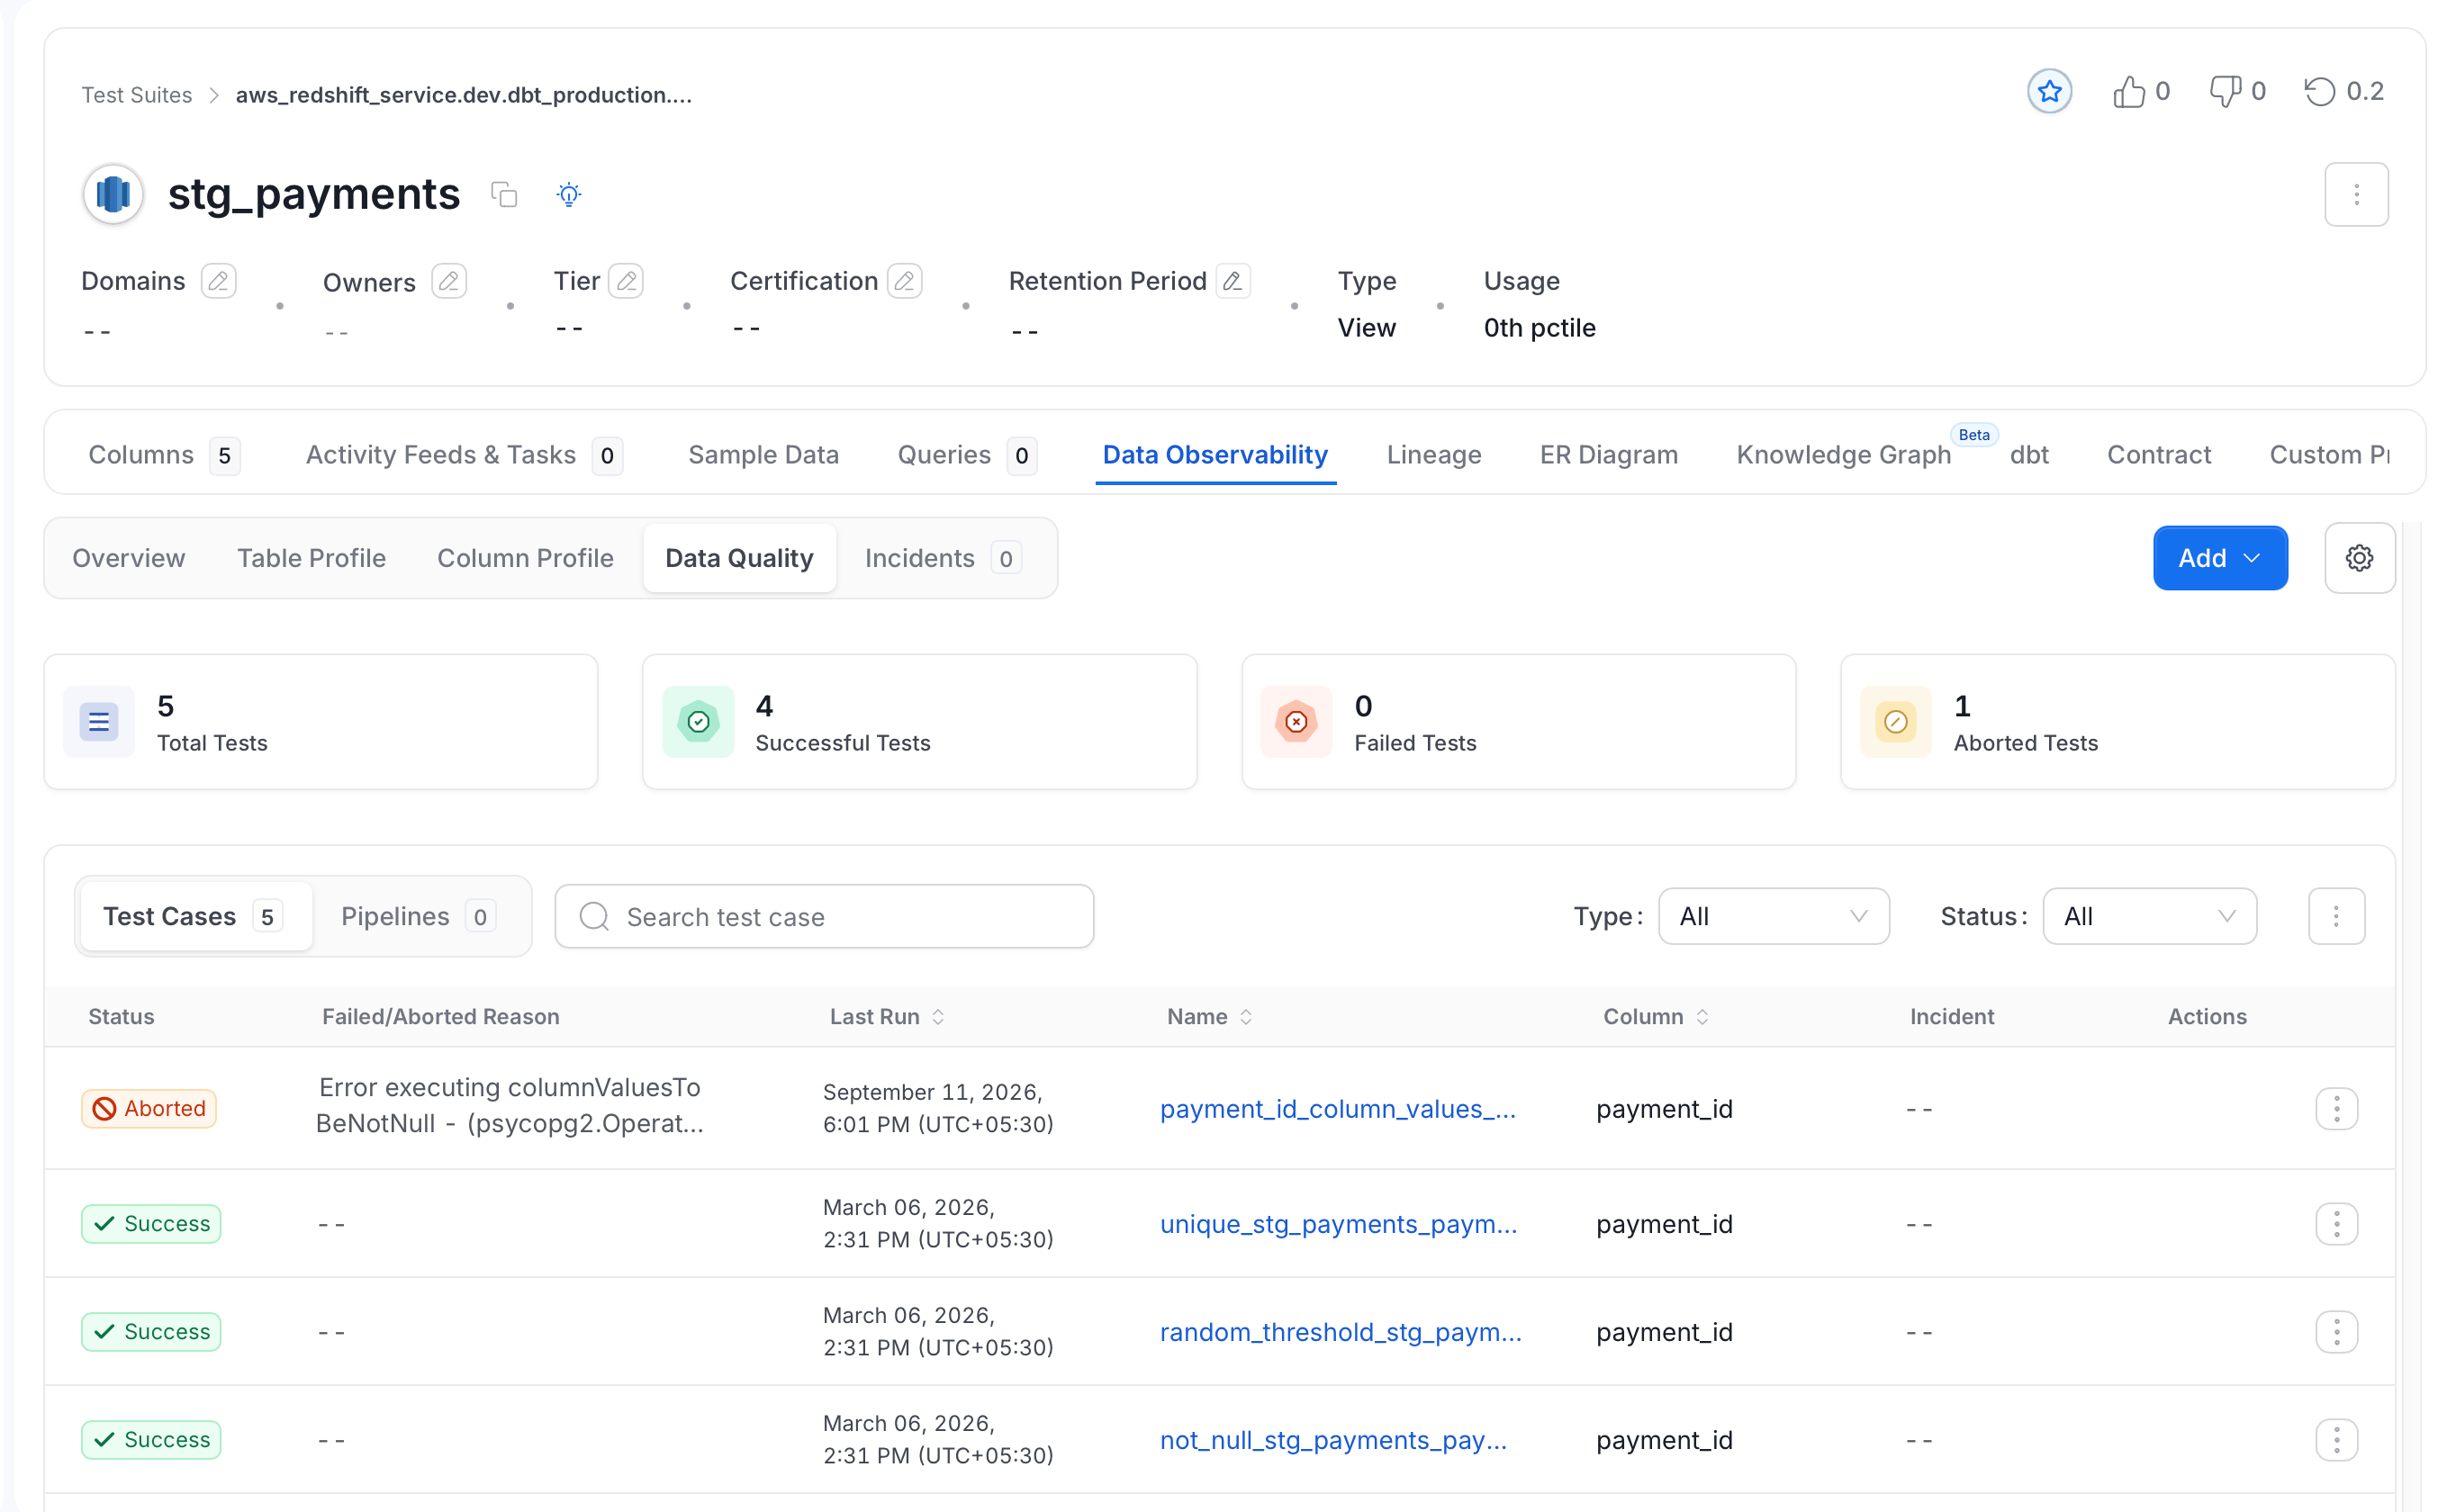
From a Table Page
Open the table page and select the Data Observability tab. The sub-tabs are Overview, Table Profile, Column Profile, Data Quality, and Incidents. Select Data Quality to see the test results at the table level and the column level. The page shows the number of total, successful, failed, and aborted tests. Below the numbers, the Test Cases list shows the Status, the Failed/Aborted Reason, the Last Run time, the Name, the Column, and the Incident of each test case. Use the Type and Status filters, or Search test case, to narrow the list.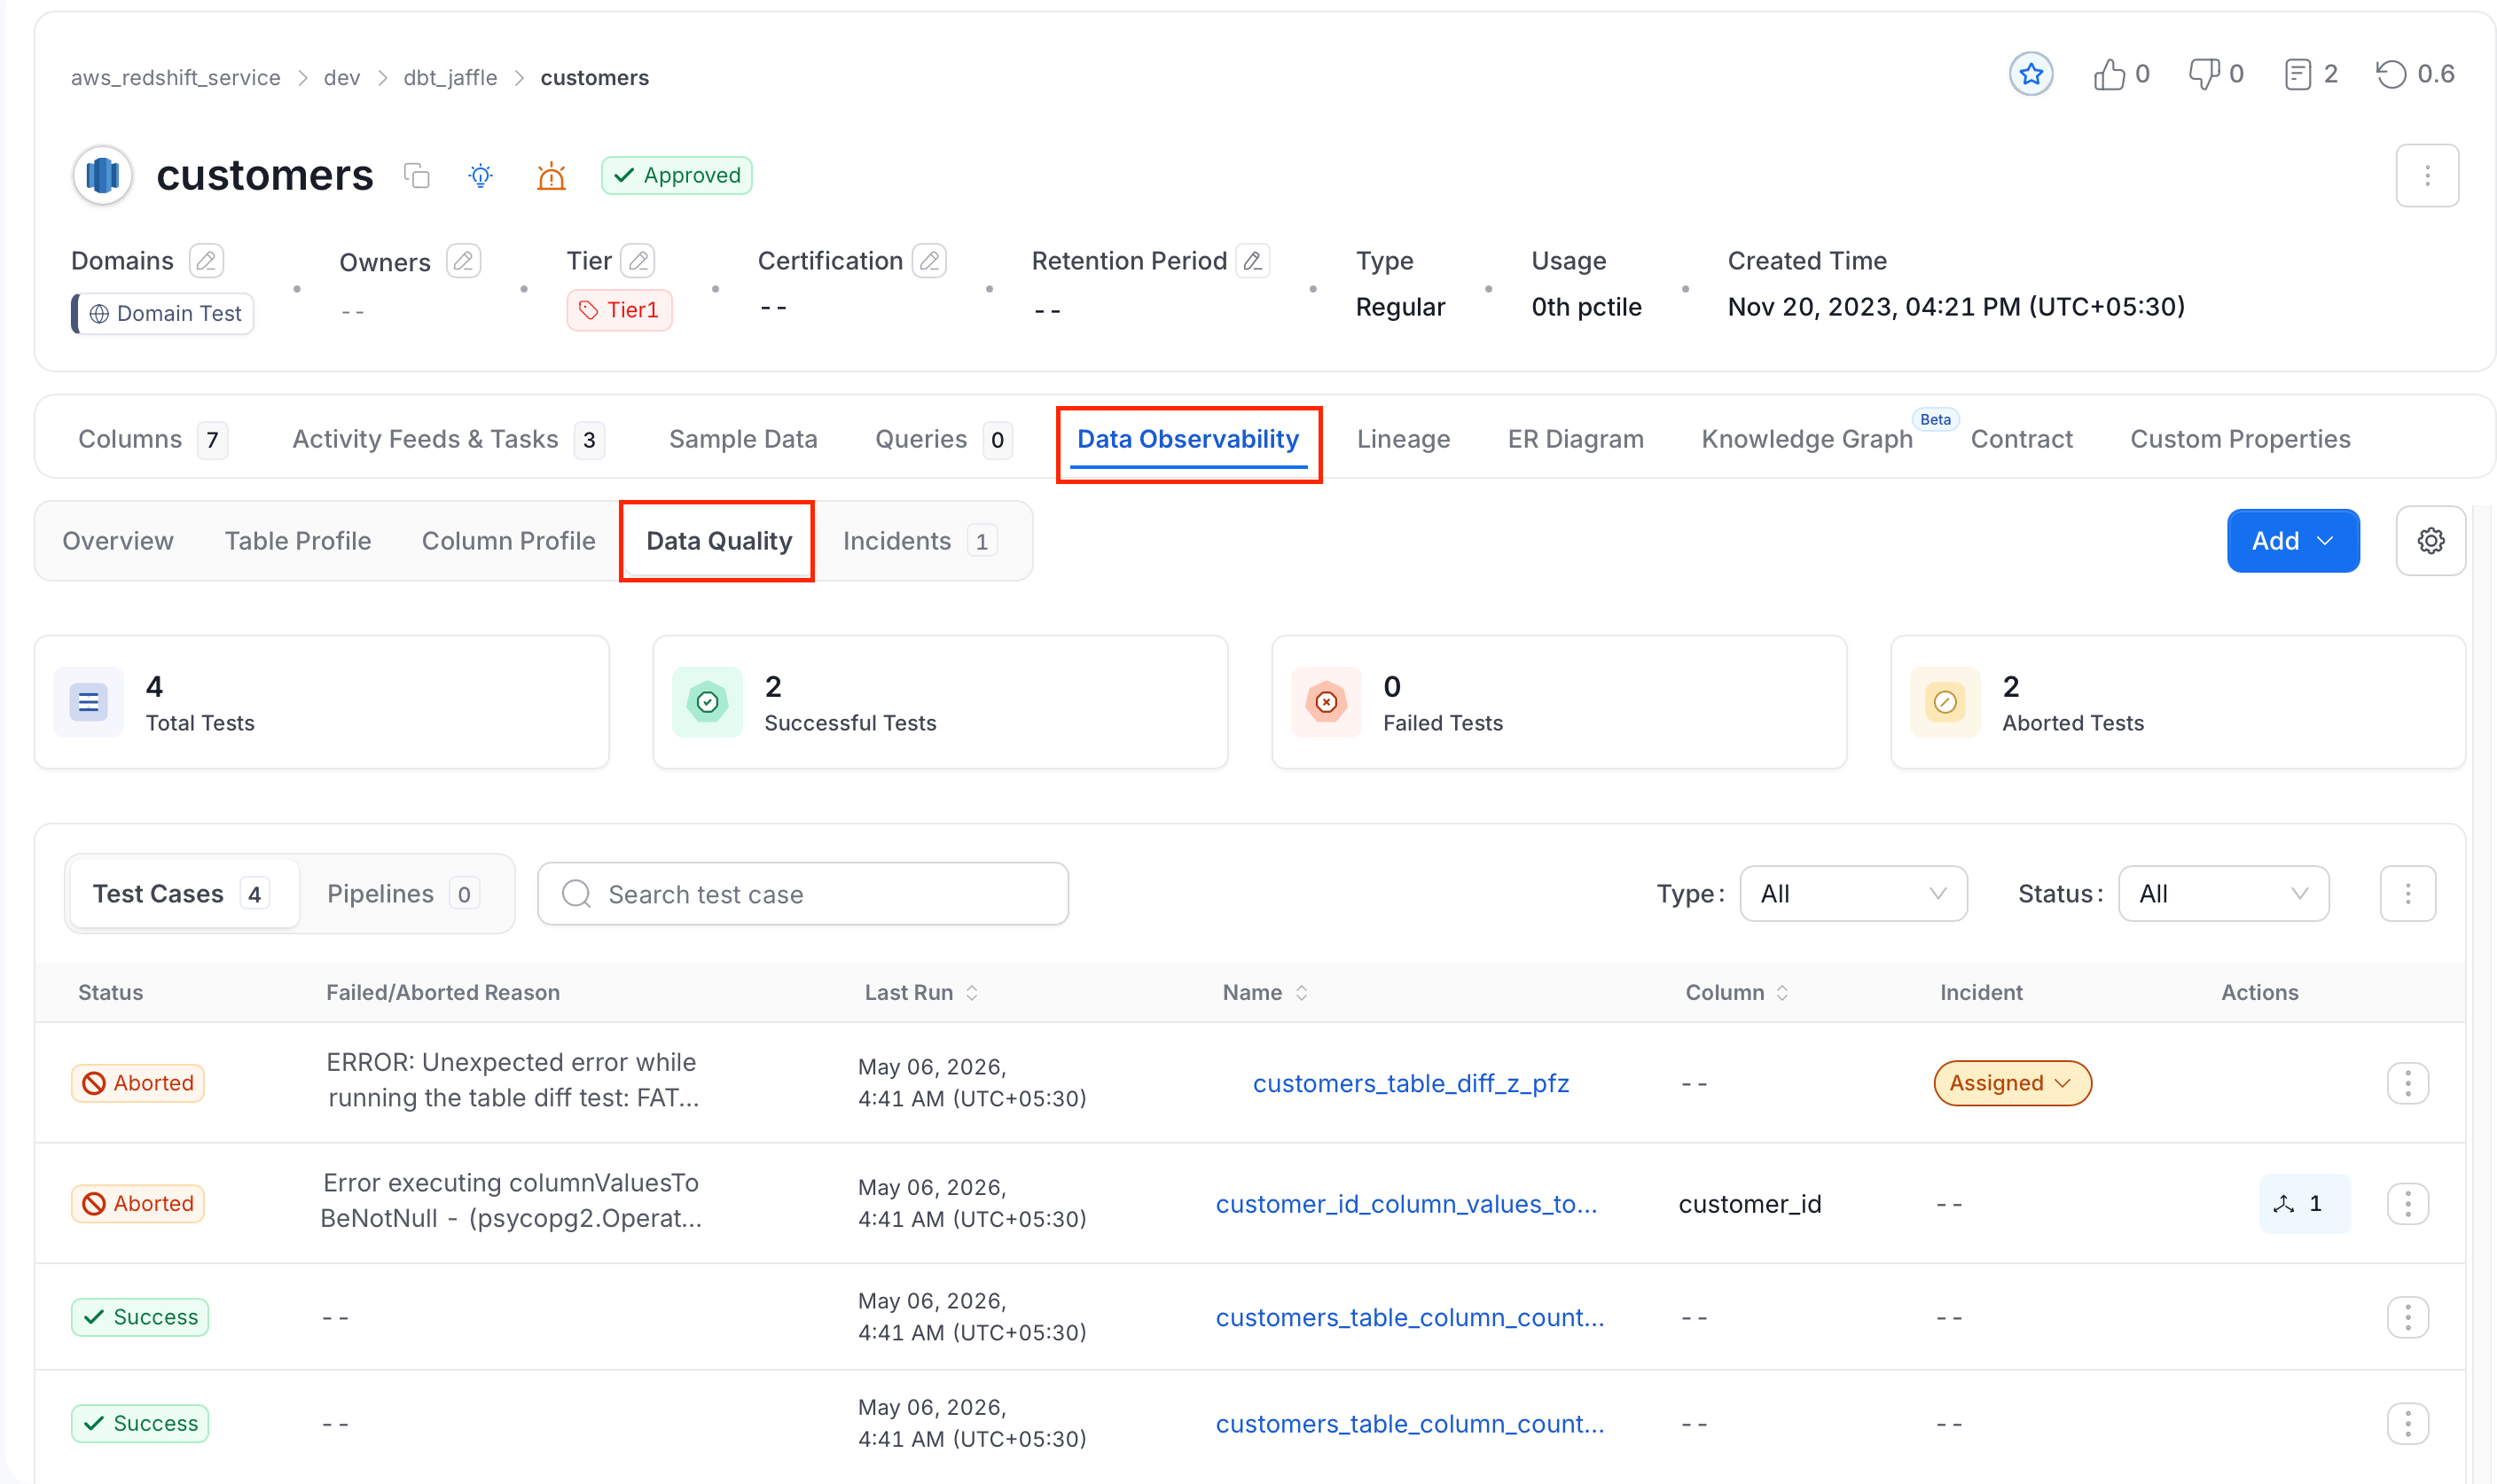
Review Result History and Run Details
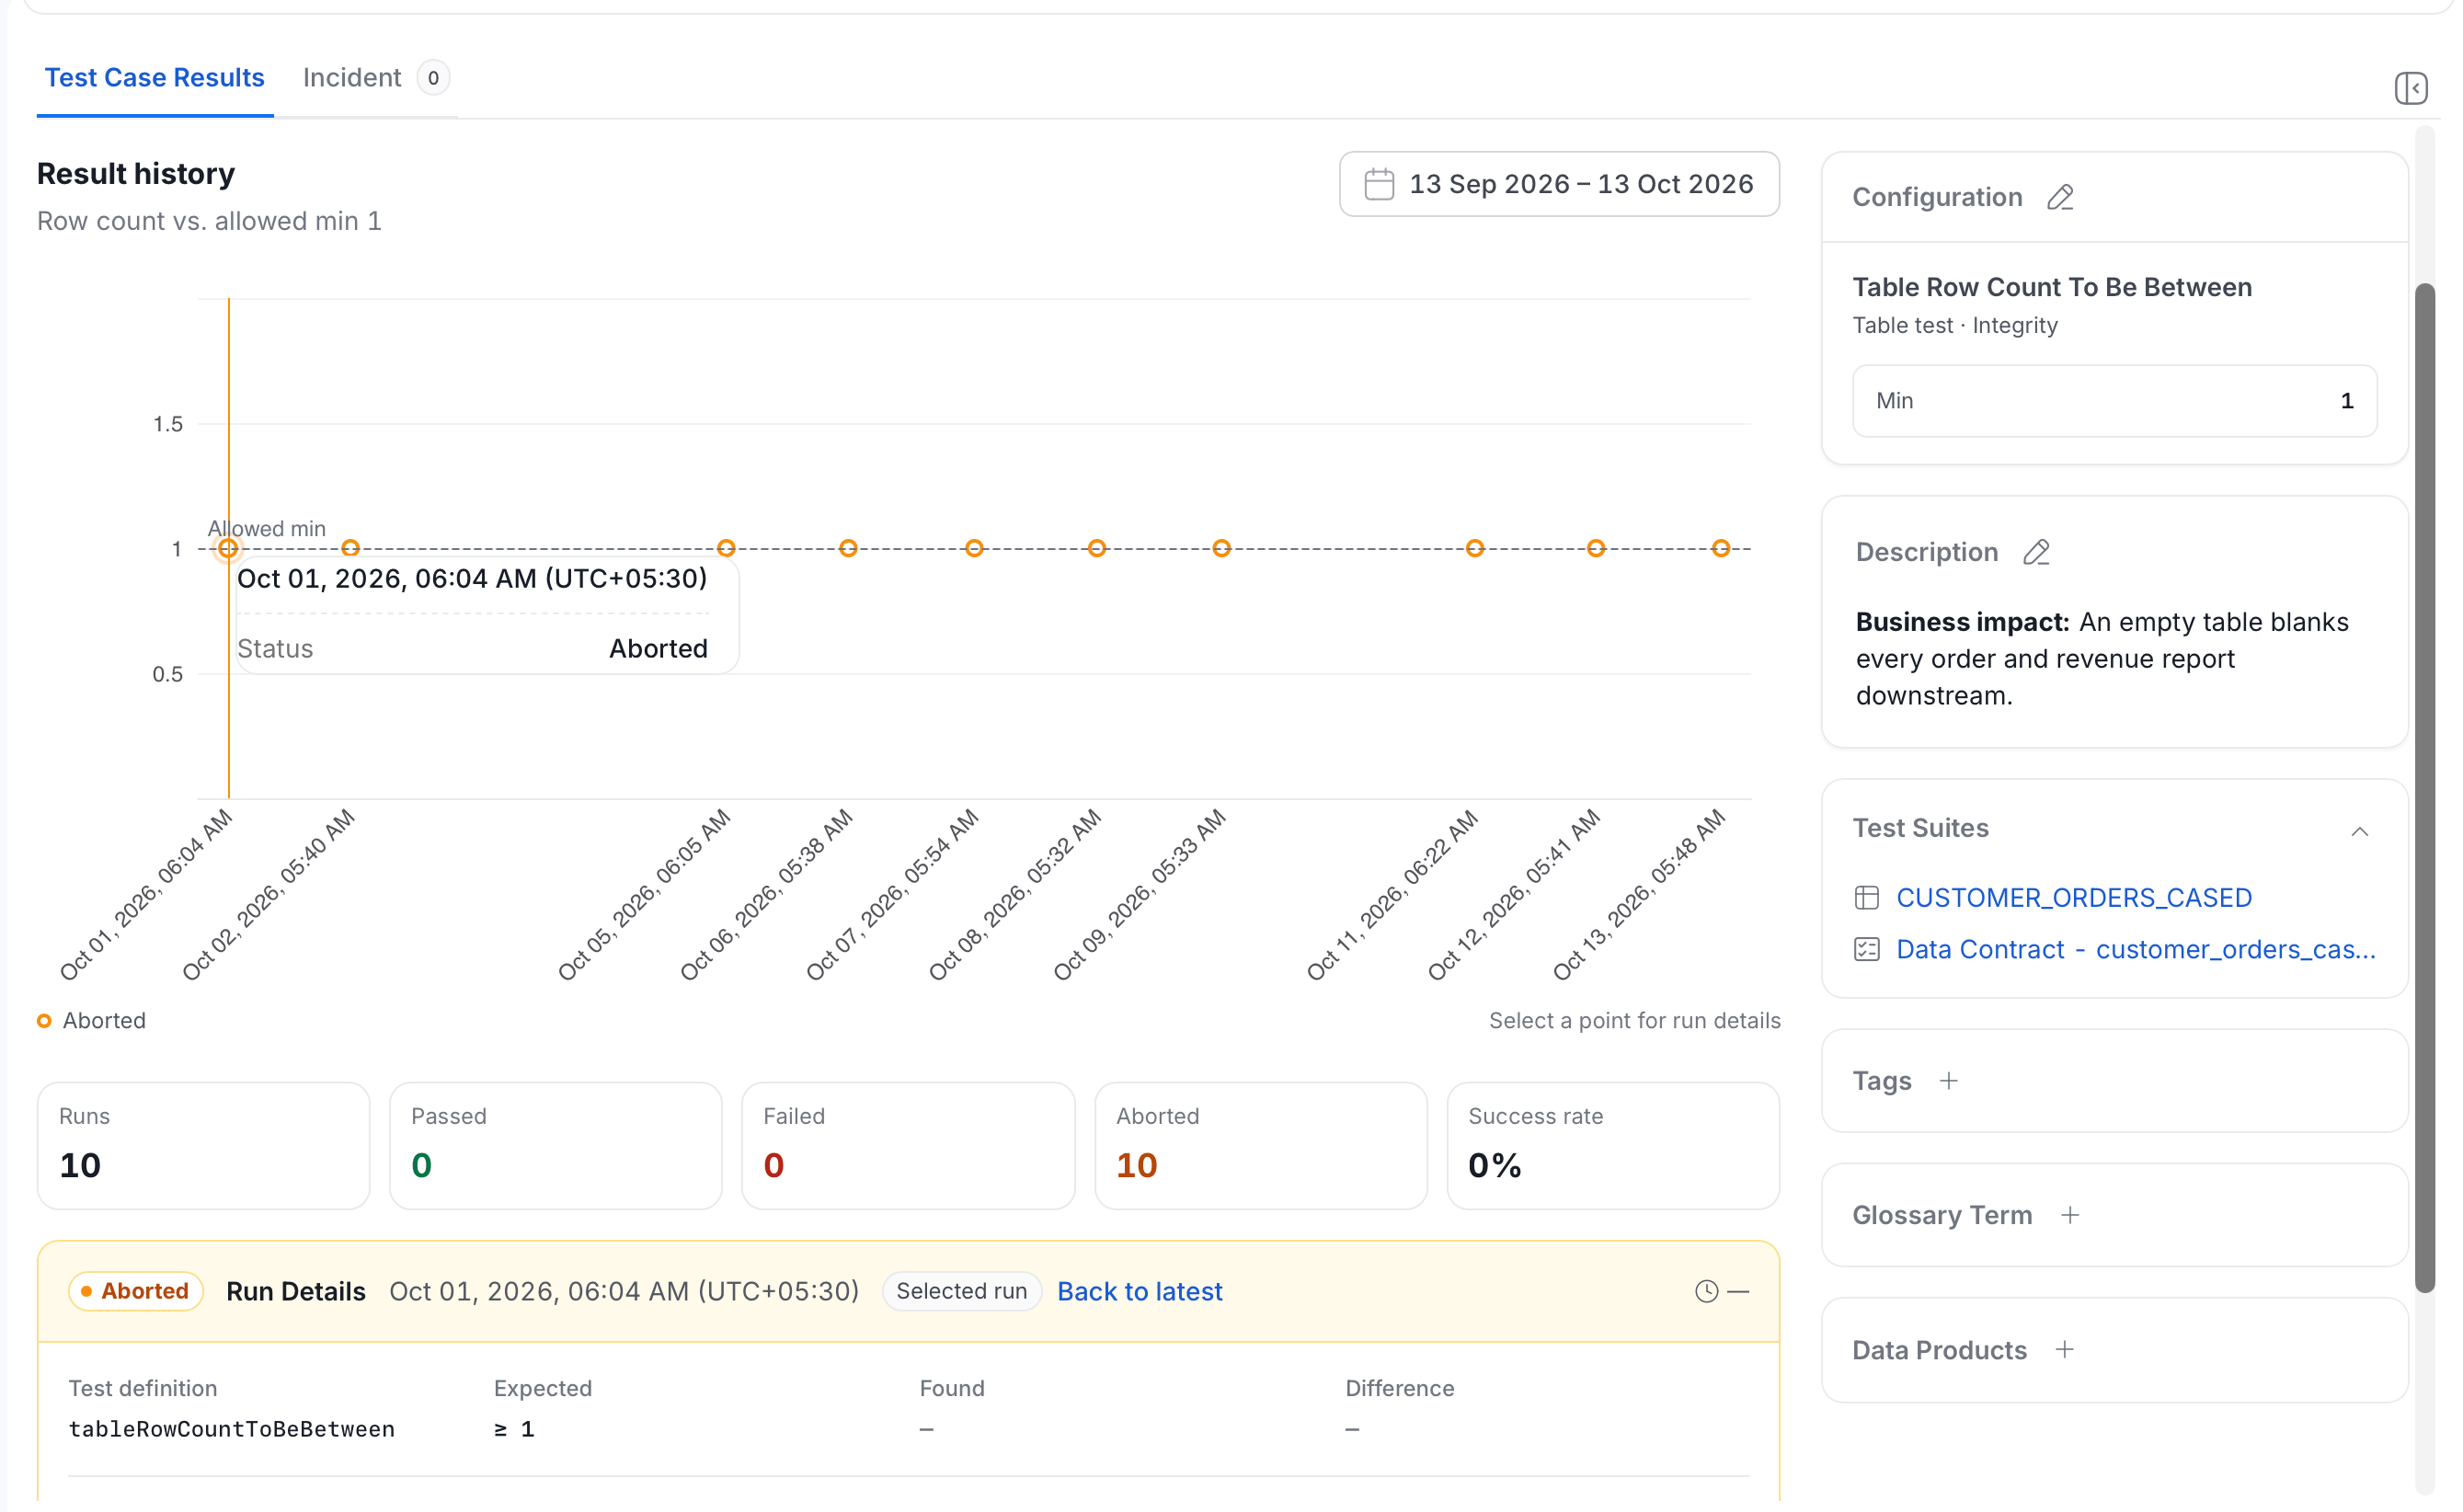
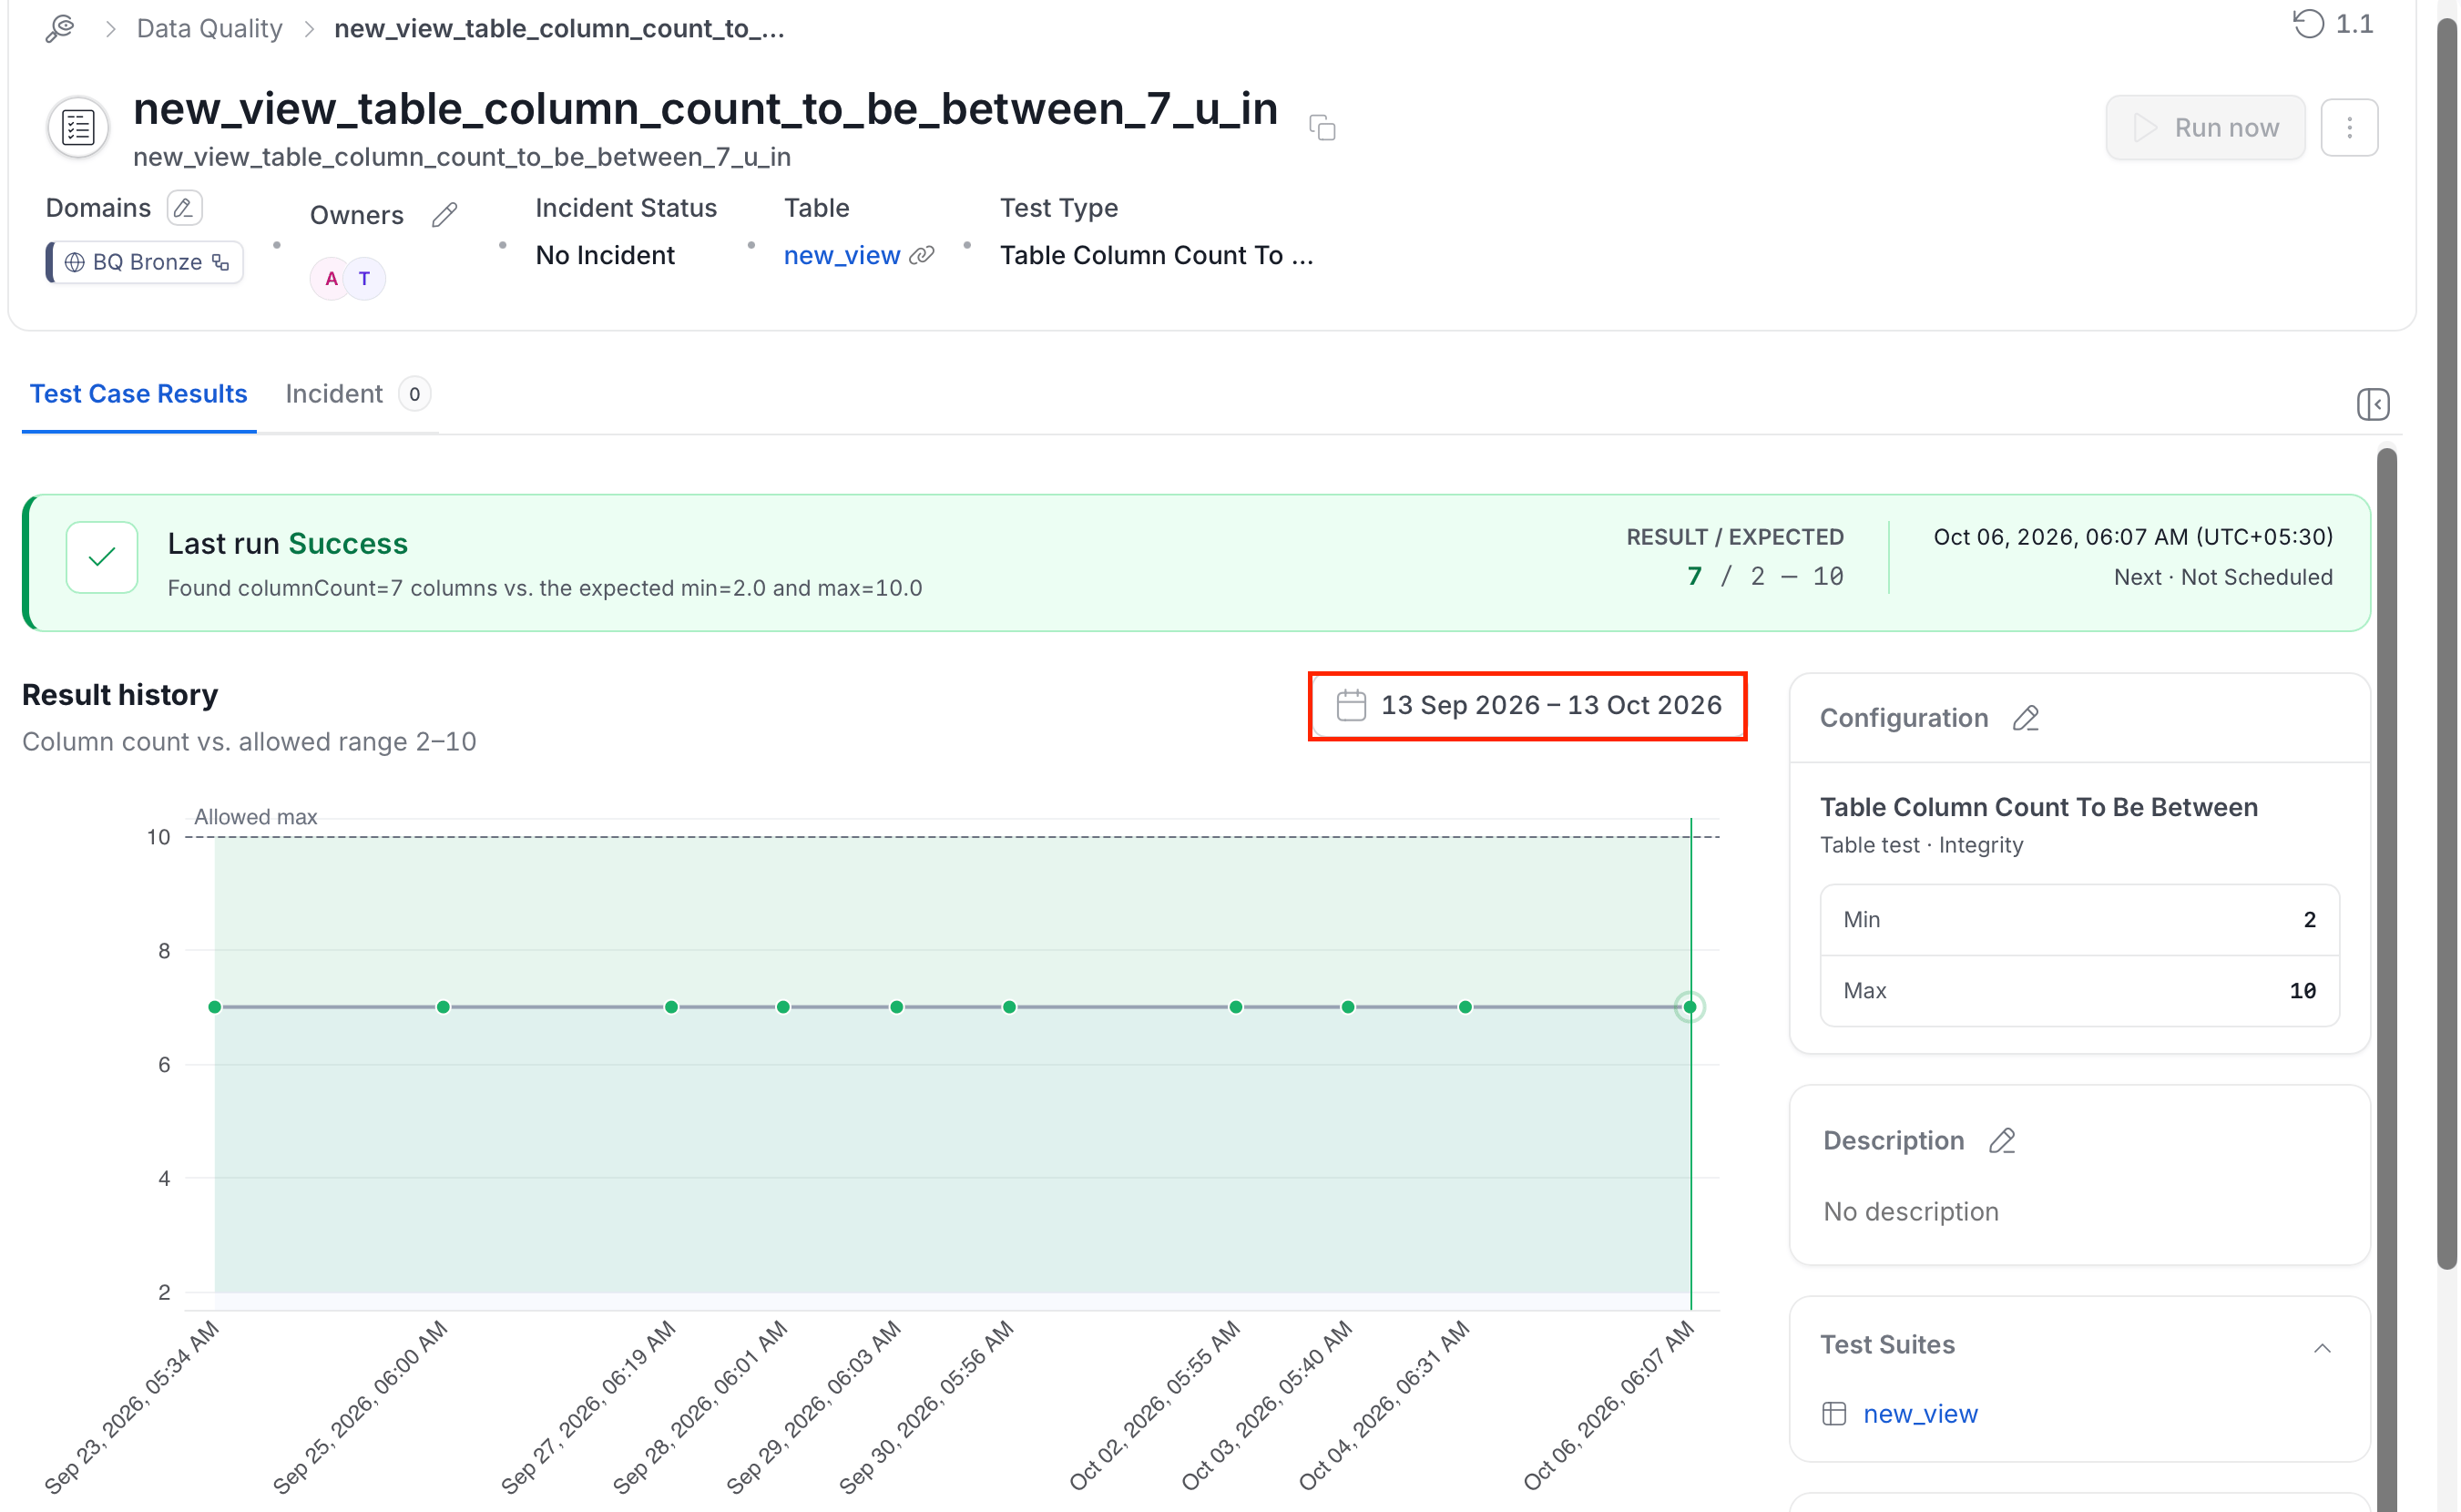
Open a test case from Data Quality > Test Cases, or from the Data Quality sub-tab of a table, to see how the test has performed over time. The Test Case Results tab shows:- Last run: The latest status and a message with the measured value and the expected range. It also shows the Result / Expected values, the run time, and when the next run is due, or Not Scheduled.
- Result history: A chart of the measured value over time. The caption names what Collate measures and what it compares against, for example “Column count vs. allowed range 2–10”. A dashed line marks the allowed limit. A key under the chart names each marker, and aborted runs appear as hollow markers.
- Configuration, Description, Test Suites, Tags, Glossary Term, and Data Products panels beside the chart.
Change the Result History Time Window
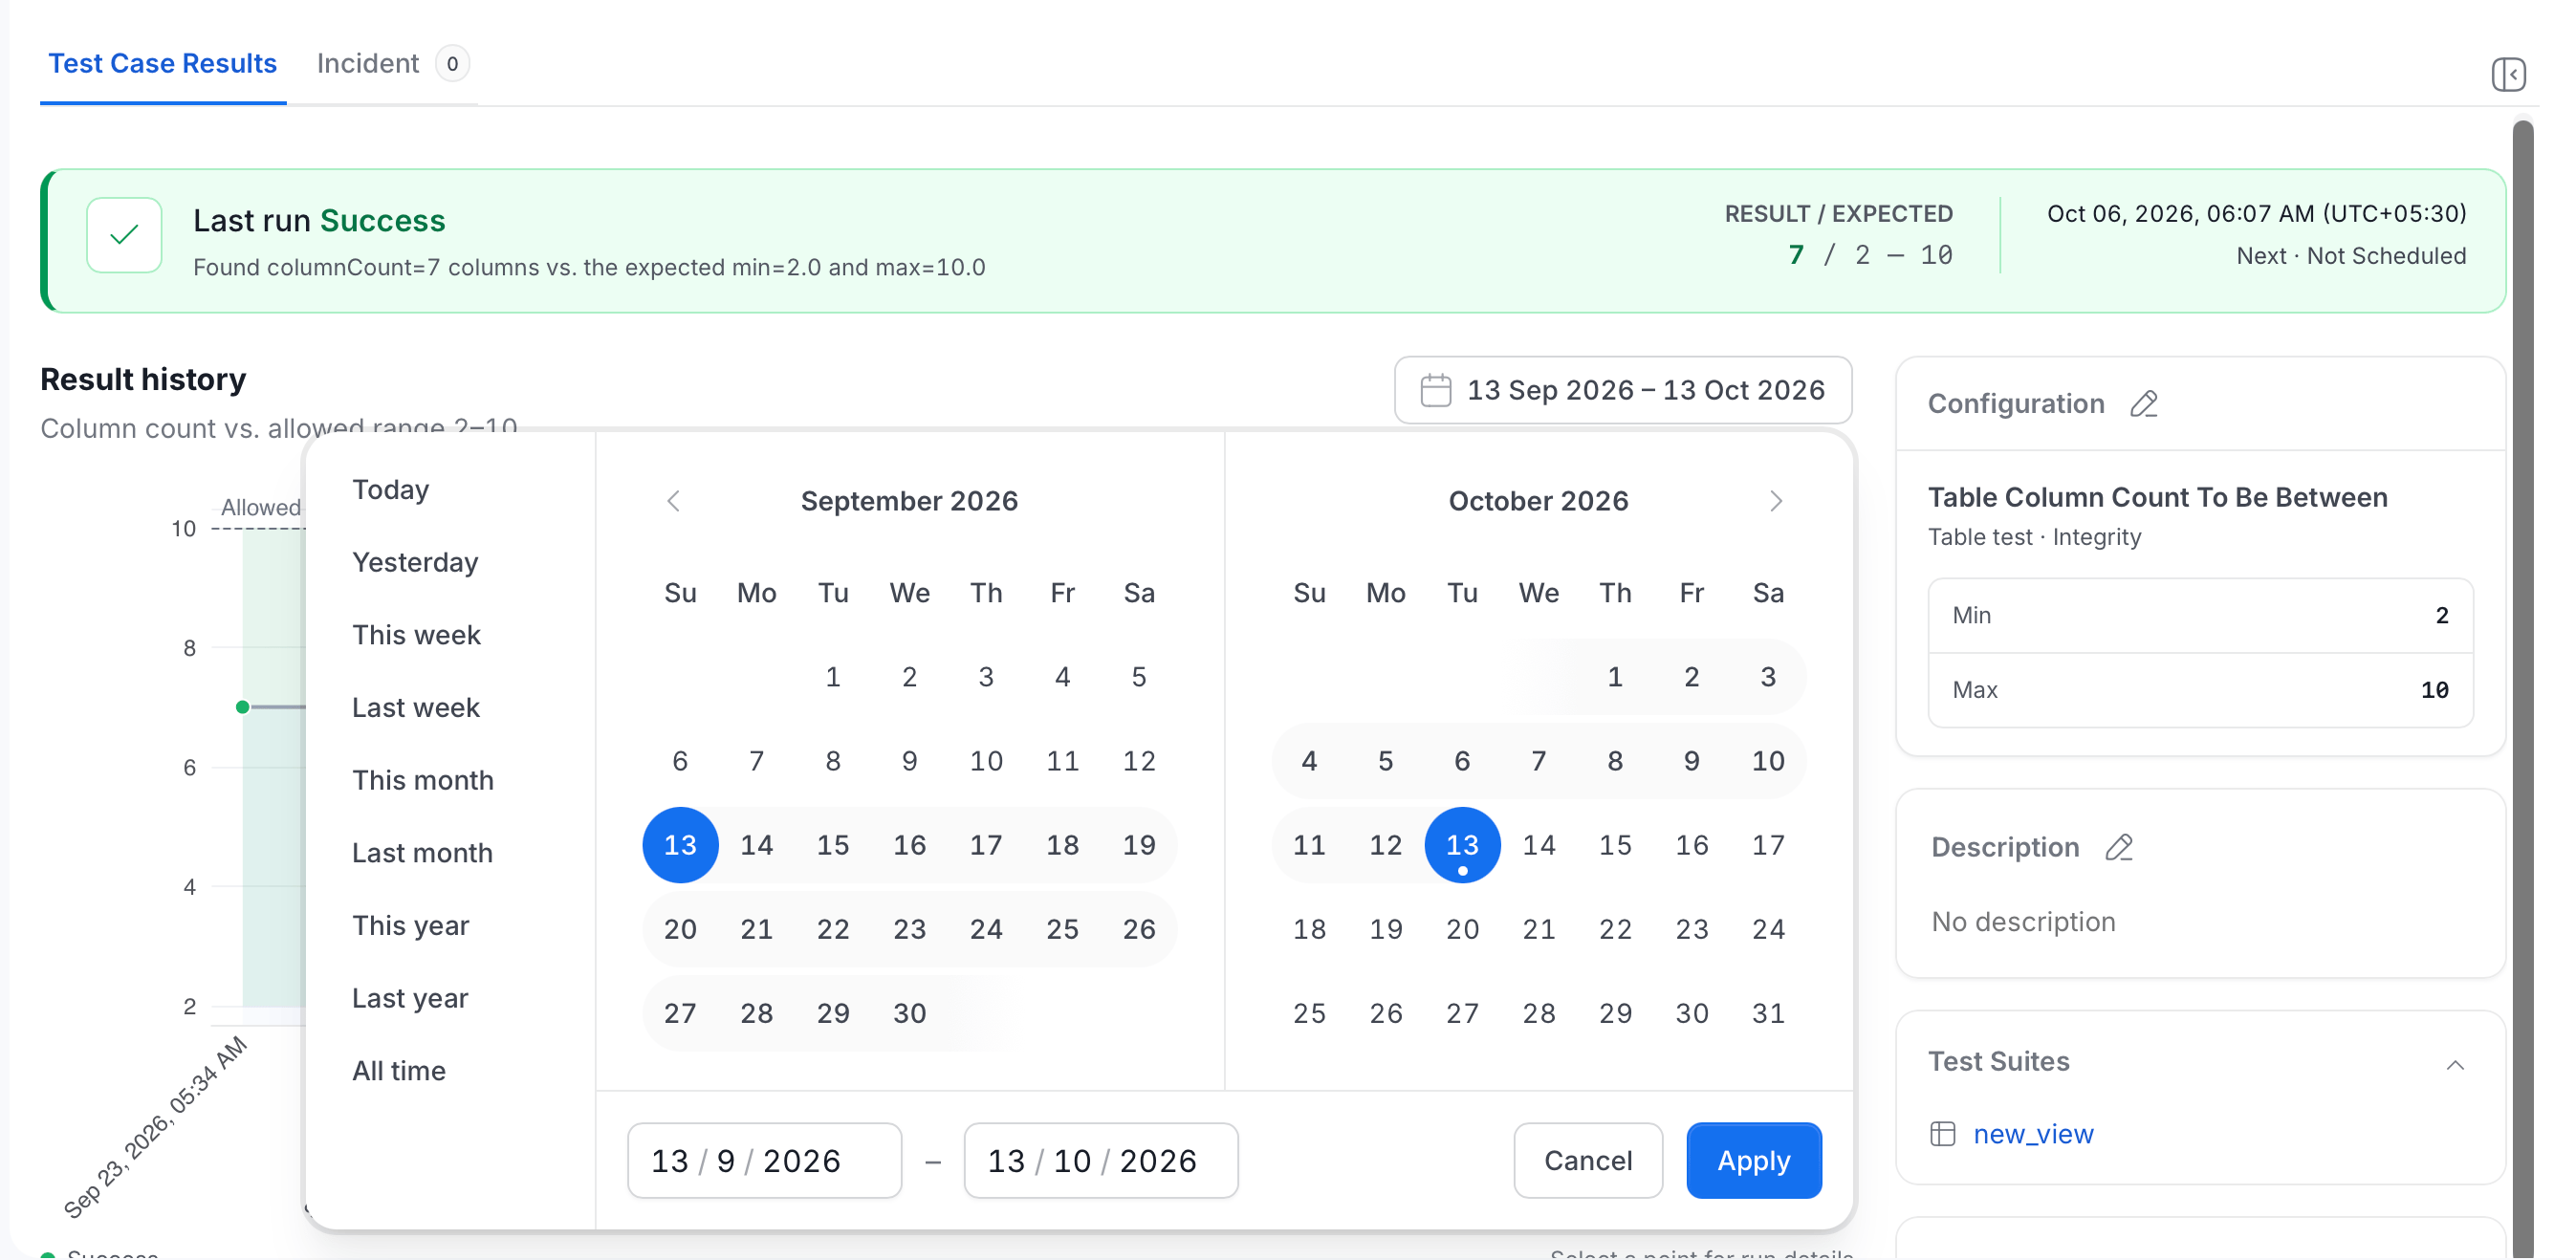
By default, Result history covers the last 30 days and ends today. To change the time window:- Select the date range on the Result history card.
- Choose a time range in one of two ways:
- Select a preset: Today, Yesterday, This week, Last week, This month, Last month, This year, Last year, or All time.
- Pick start and end dates on the calendars, or type them in the date fields.
- Select Apply.
Read the Run Summary Tiles
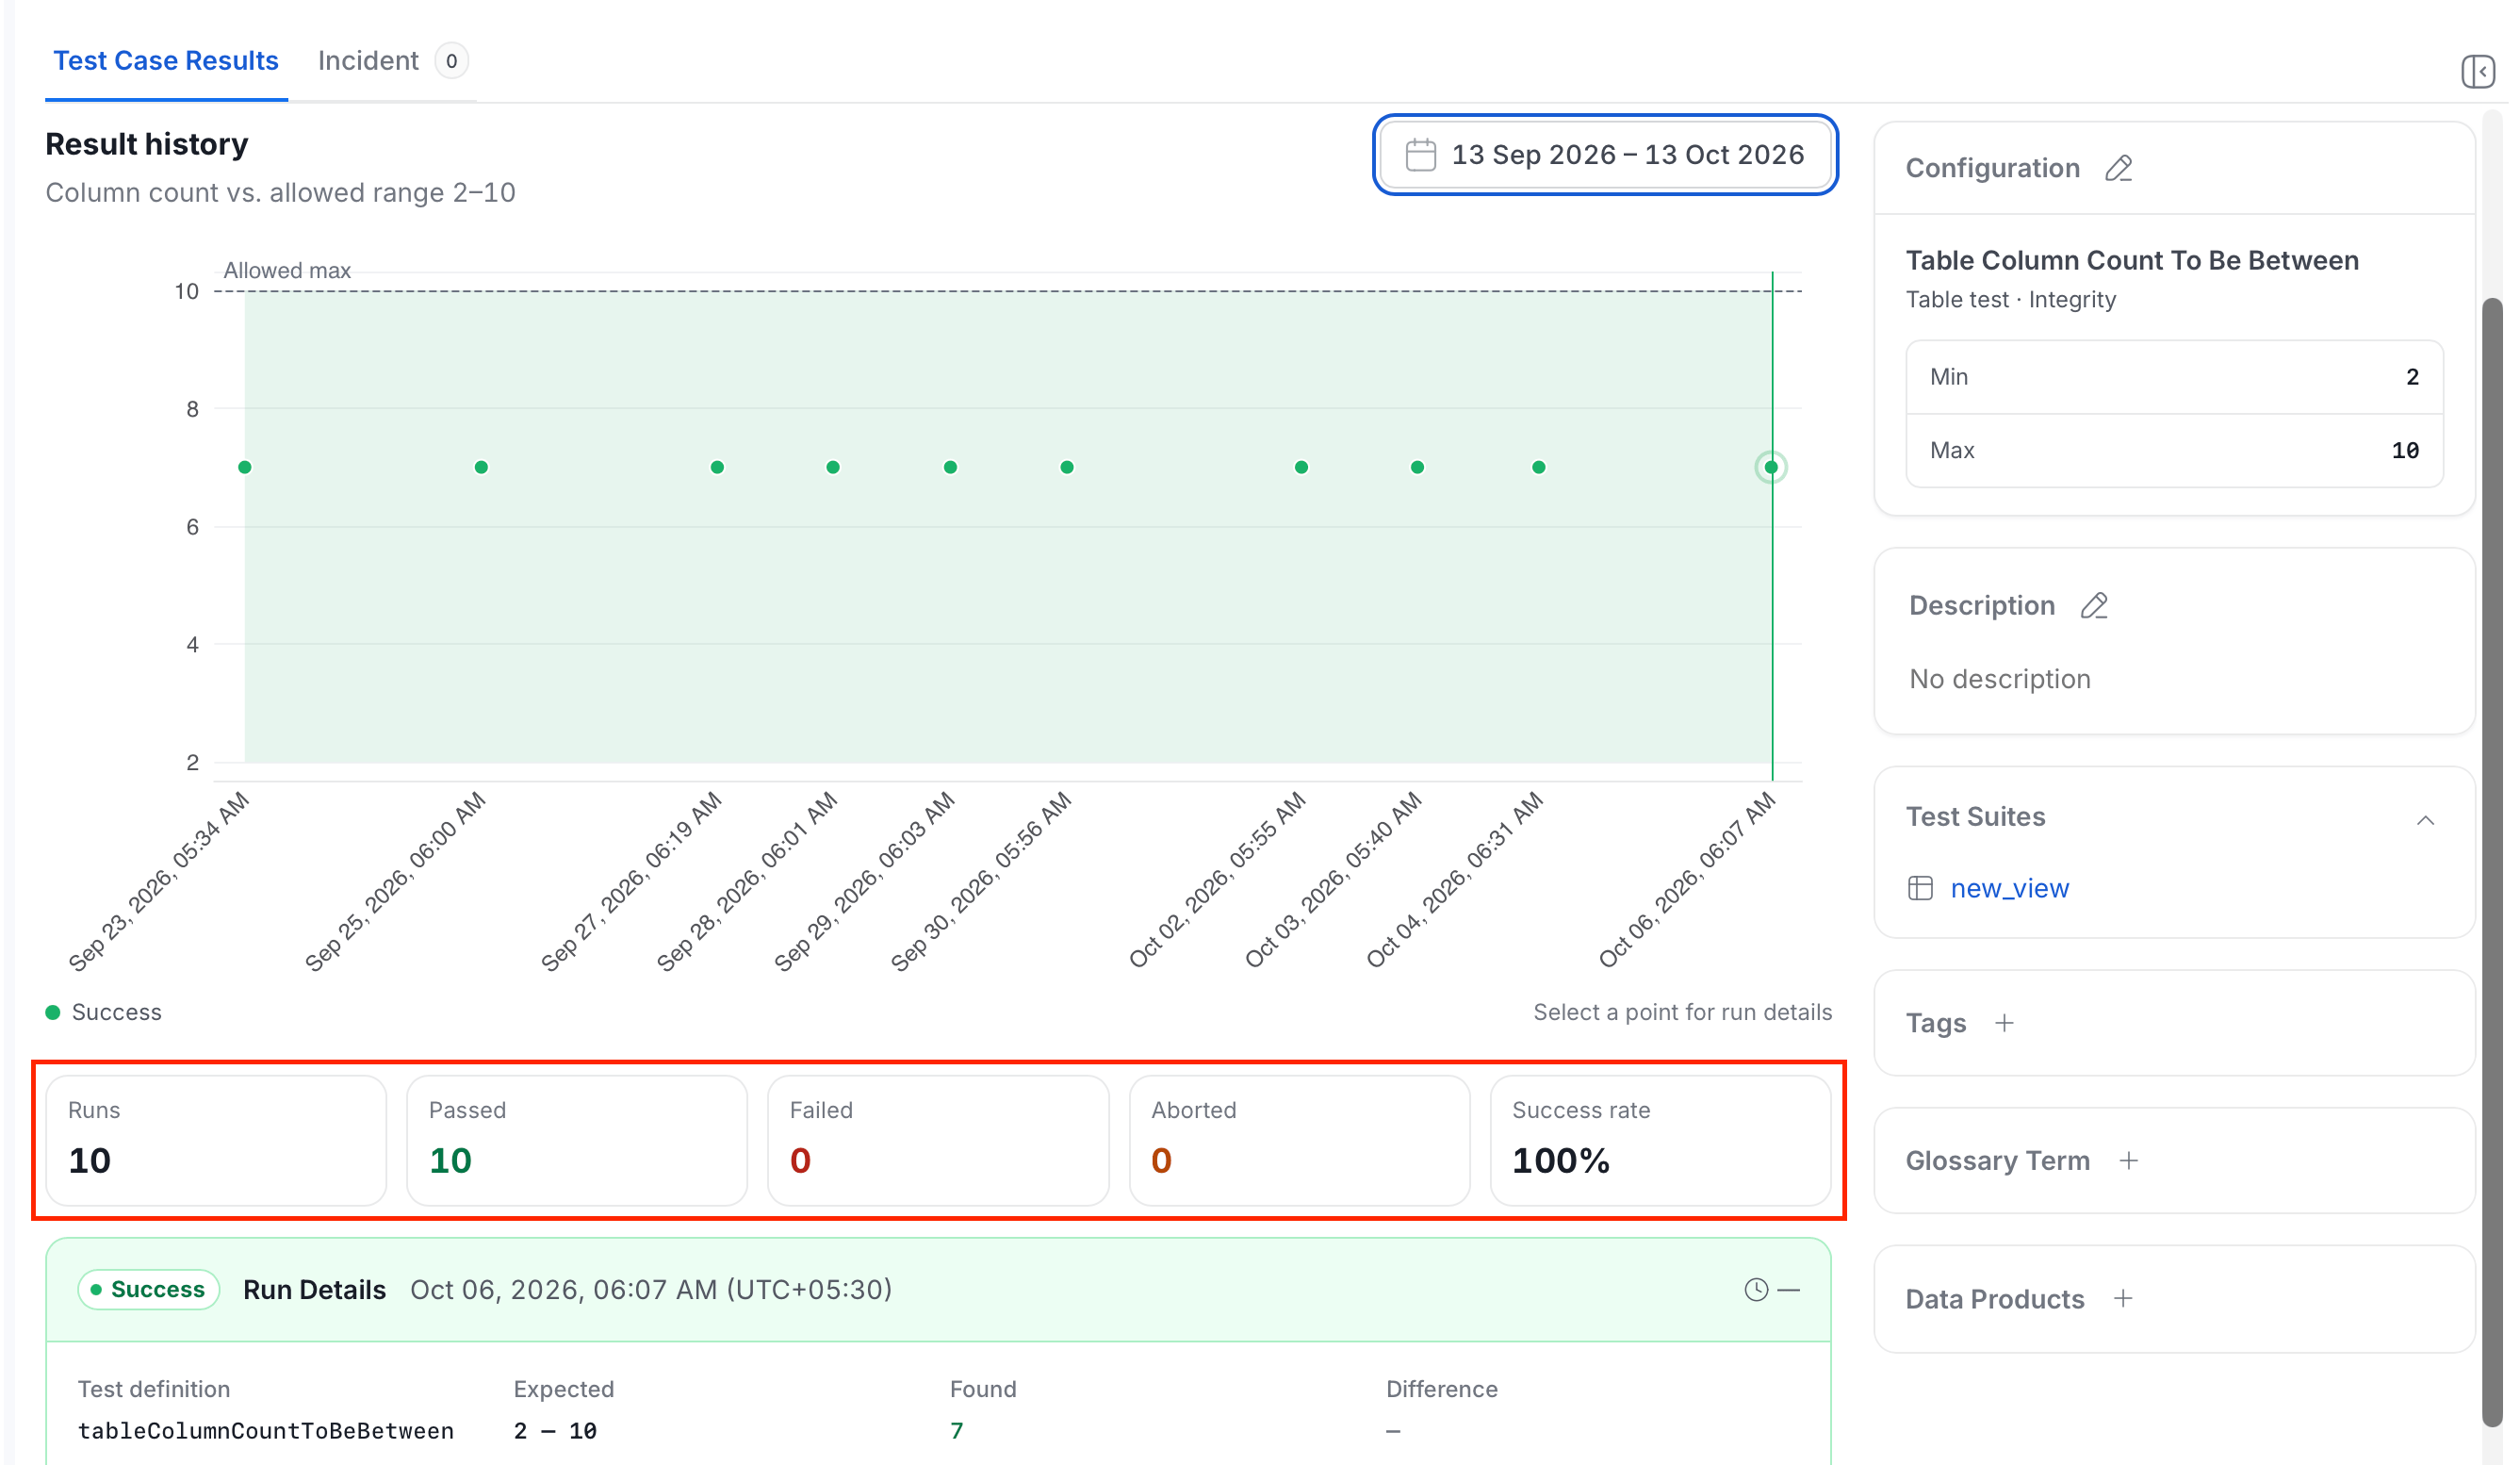
Below the chart, five tiles summarize the selected time window:
Queued runs count toward Runs but not toward the success rate, so the tiles might not add up to Runs. The success rate shows a dash when no run has finished.
Review Run Details
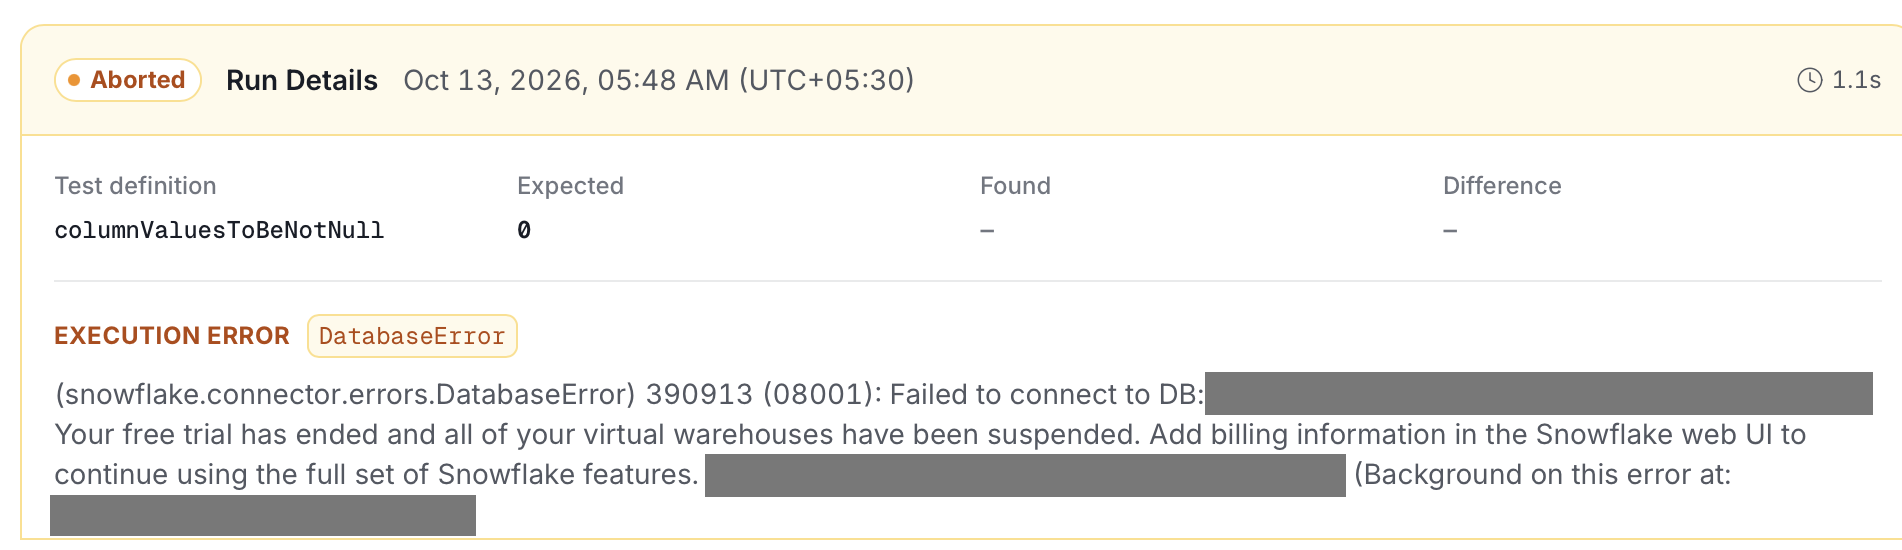
Below the tiles, the Run Details card shows the latest run by default. Hover over a marker on the chart to see its time and status, and select the marker to show that run instead. The card then shows a Selected run label, and Back to latest returns to the latest run. The card shows the following:- The run status, the date and time of the run, and how long the run took. If the run timed out, the duration is marked (timeout).
- Test definition: The test that ran.
- Expected: The value or range that the test expects.
- Found: The value that the run measured.
- Difference: How far the measured value is from what the test expects.