
Ontology Explorer
The Ontology Explorer renders your Glossary as an interactive graph, letting you visualize how terms relate to one another—parent/child hierarchies, related terms, and metrics—beyond what the flat Glossary list view can show.Accessing the Ontology Explorer
Reach the Ontology Explorer from the main navigation, or scoped to a single term from that term’s page.- In the left navigation menu, select Govern > Ontology Explorer.
- The same graph is also available scoped to a single term: open any Glossary Term and go to its Relations Graph tab.
Reading the Graph
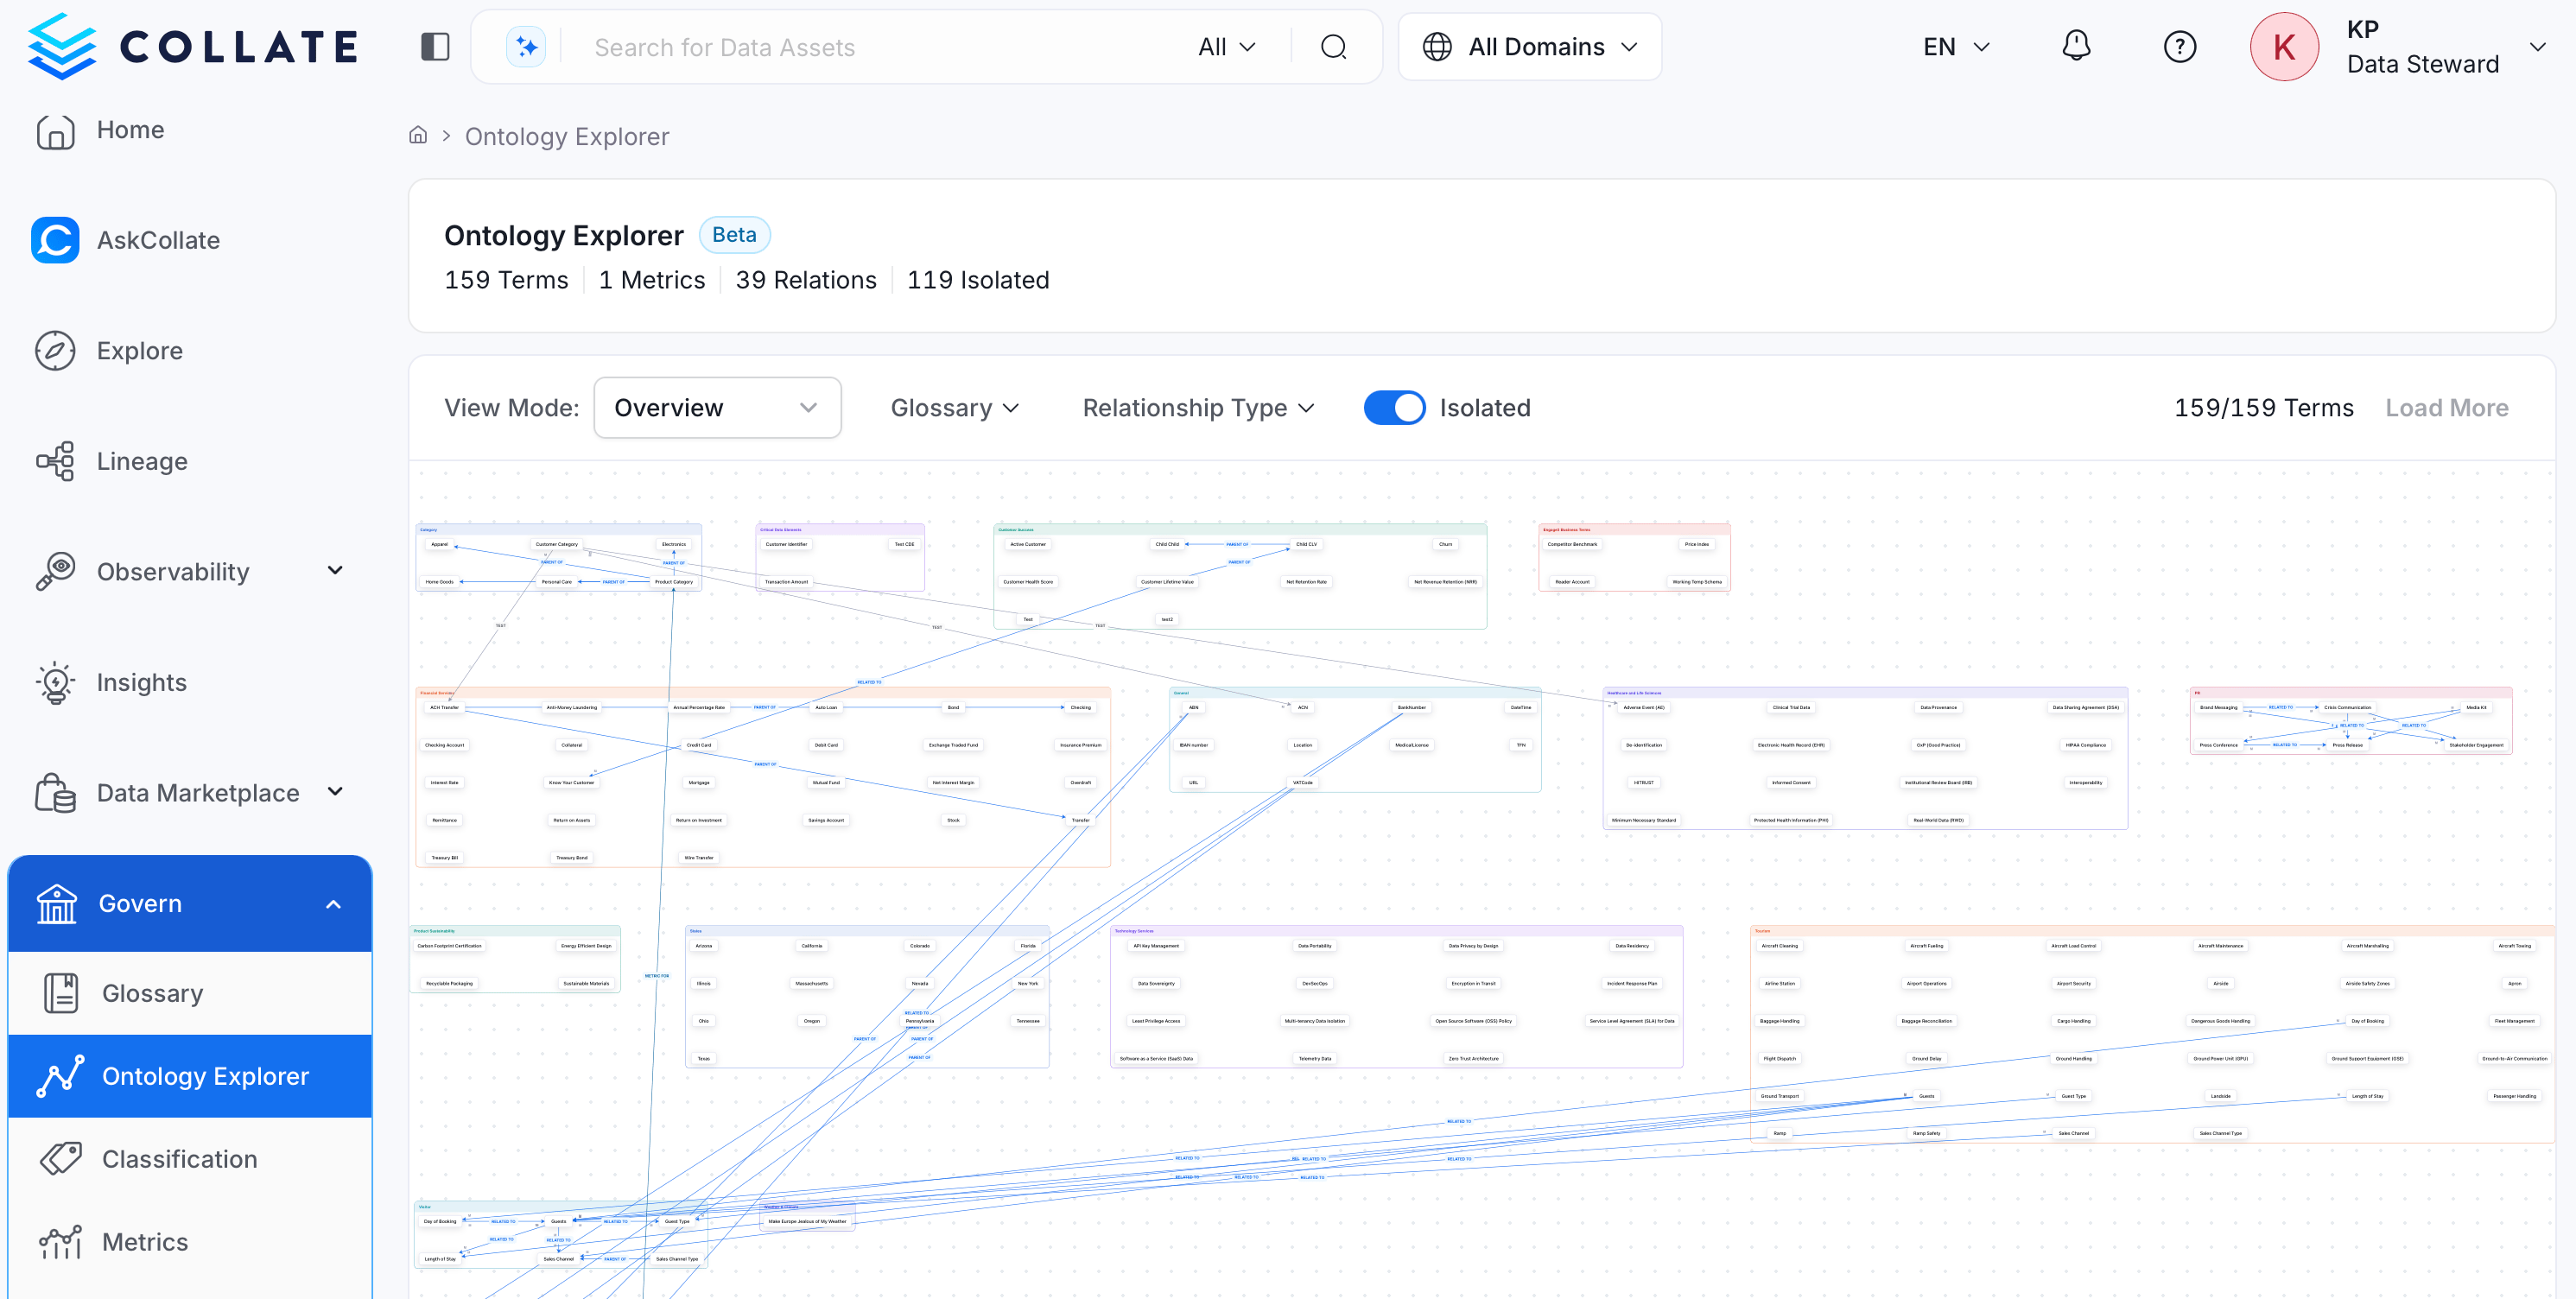
The graph page combines a summary bar with the term canvas itself.- Summary bar: At the top of the page, Collate shows counts for Terms, Metrics, Relations, and Isolated terms—terms with no relationships to any other term.
- Term clusters: Collate groups terms into boxes by their parent glossary, each labeled and color-coded by glossary name.
- Relationship edges: Lines connect related terms across and within clusters, labeled with the relationship type—for example PARENT OF or RELATED TO.
- Term details: Select any term node to open a side panel with its details and relationships.
Model and Data Views
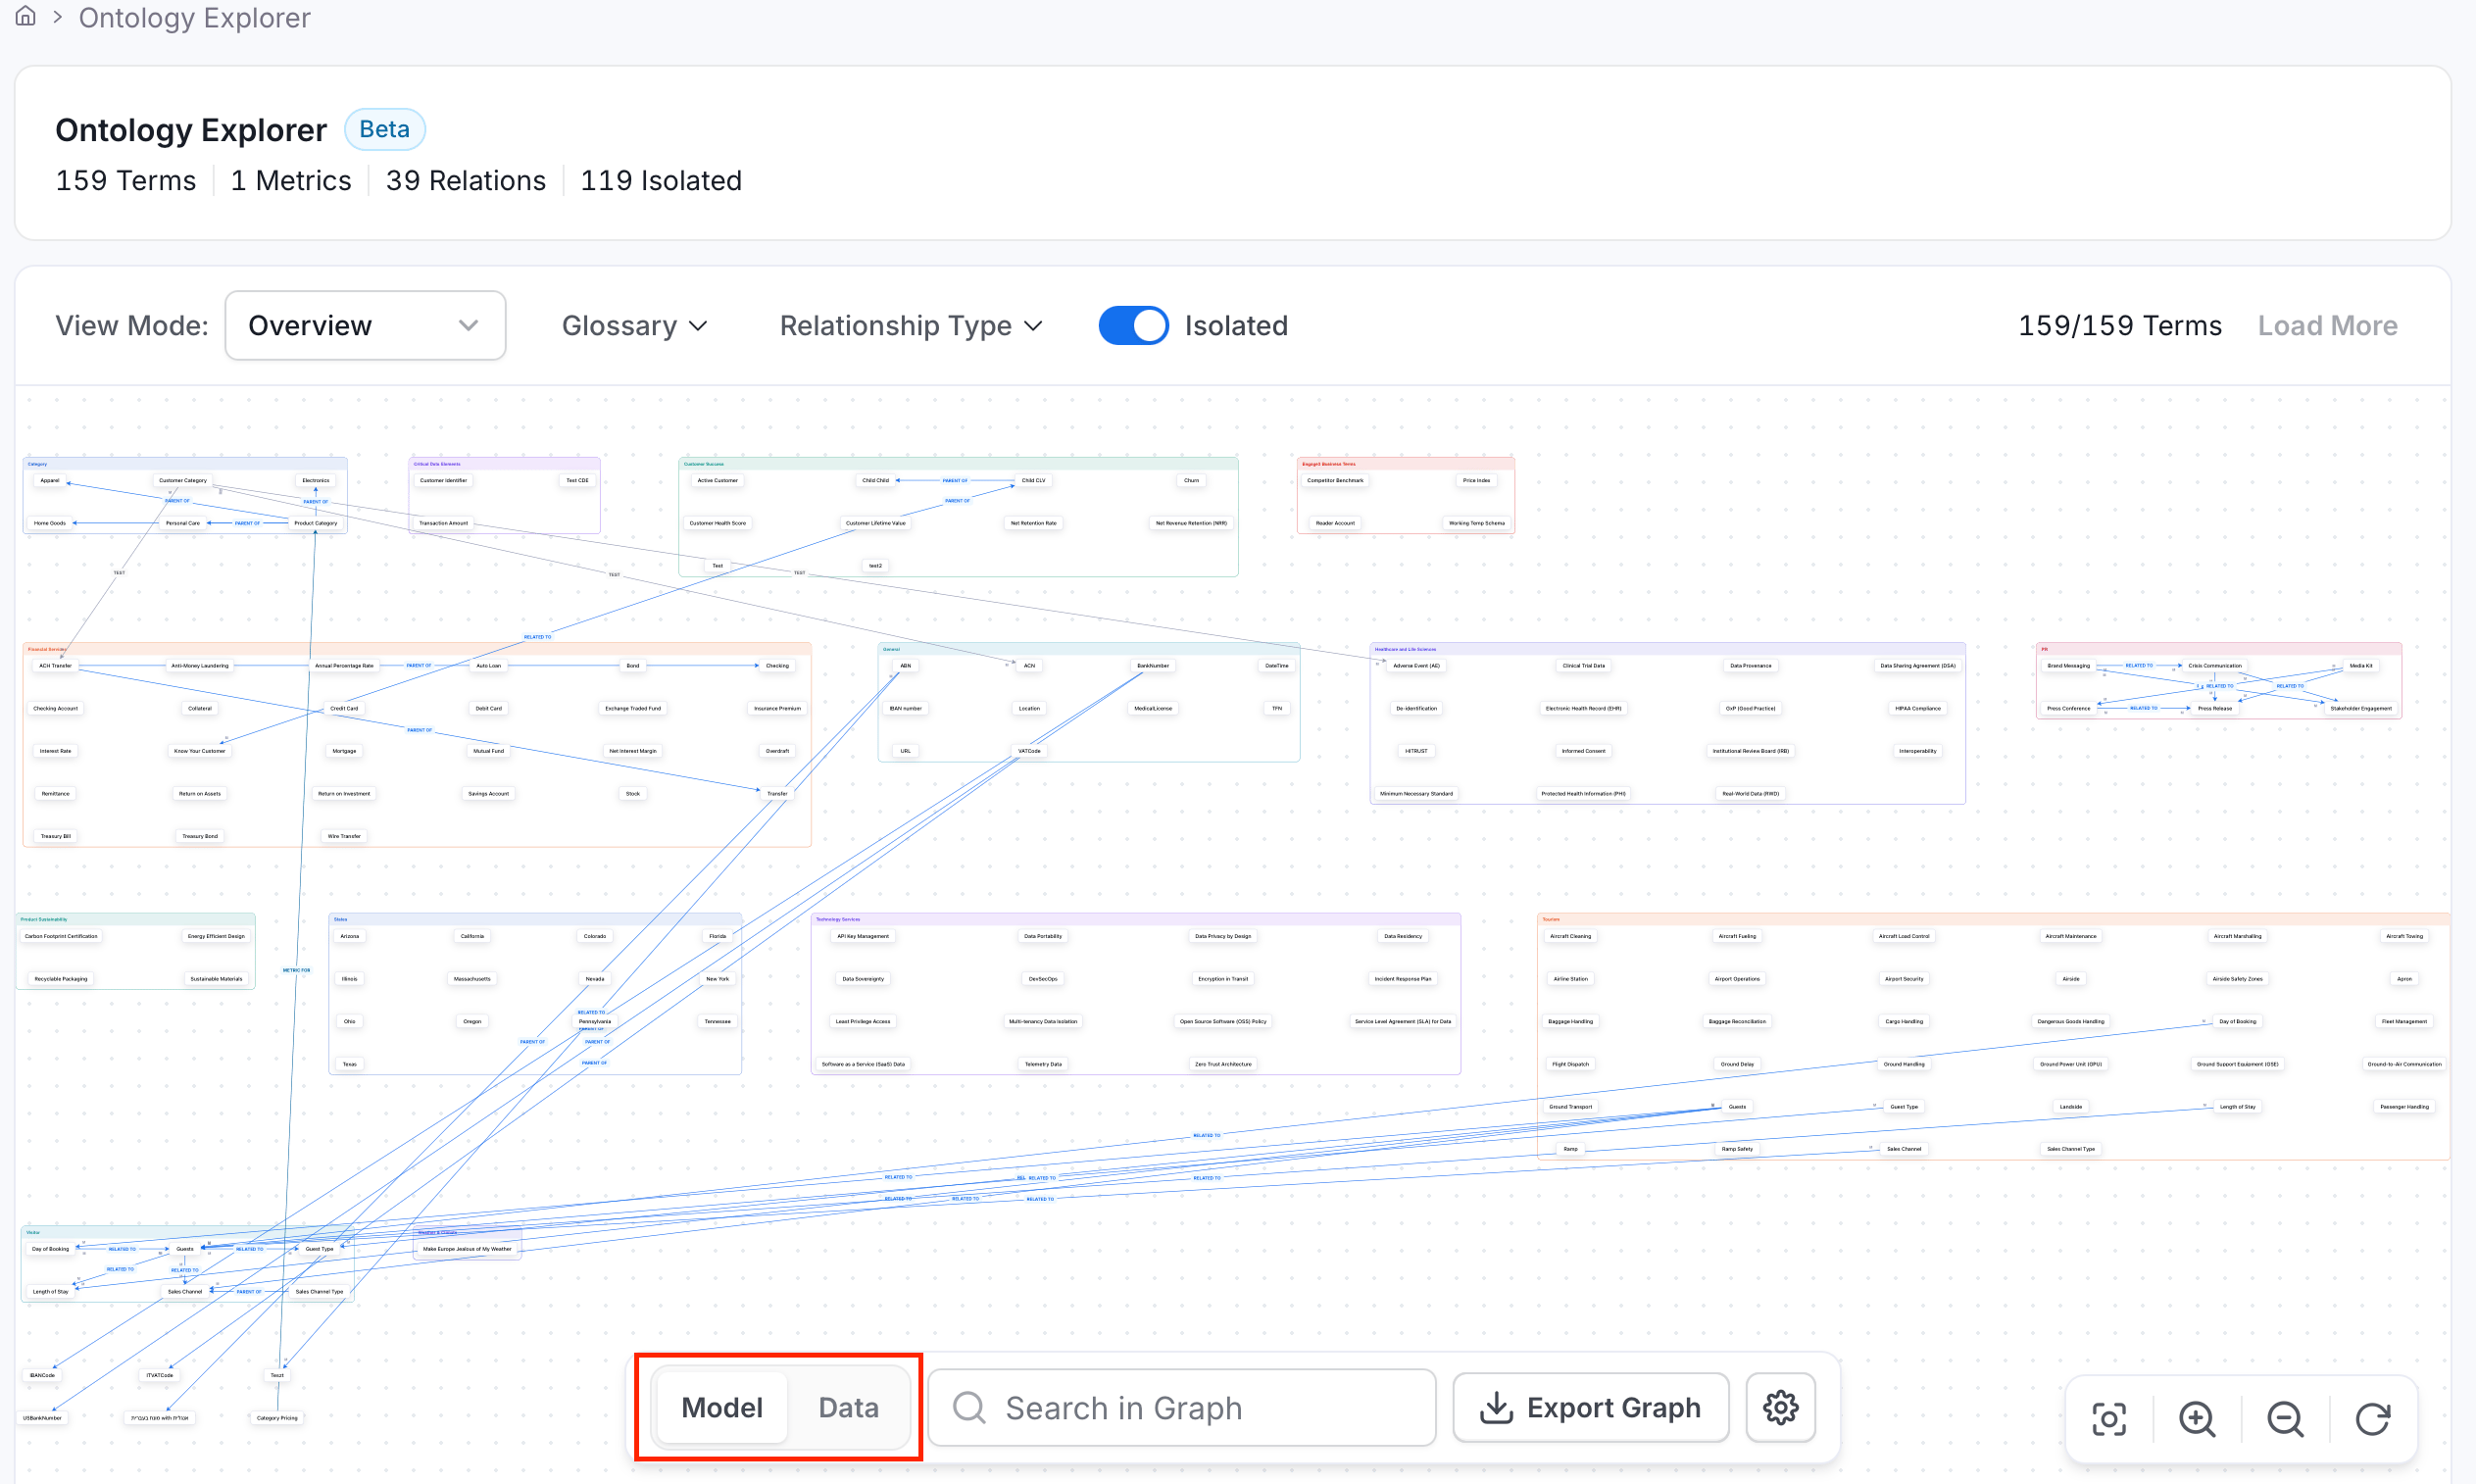
Use the Model / Data toggle below the graph to switch what the graph renders:- Model: Shows the term-to-term ontology—how glossary terms relate to each other. The View Mode, Isolated toggle, and term pagination (Load More) described below only apply in this view.
- Data: Shows terms alongside the data assets tagged with them. Select a term node to expand it and load the assets (tables, dashboards, and so on) associated with that term.
View Modes
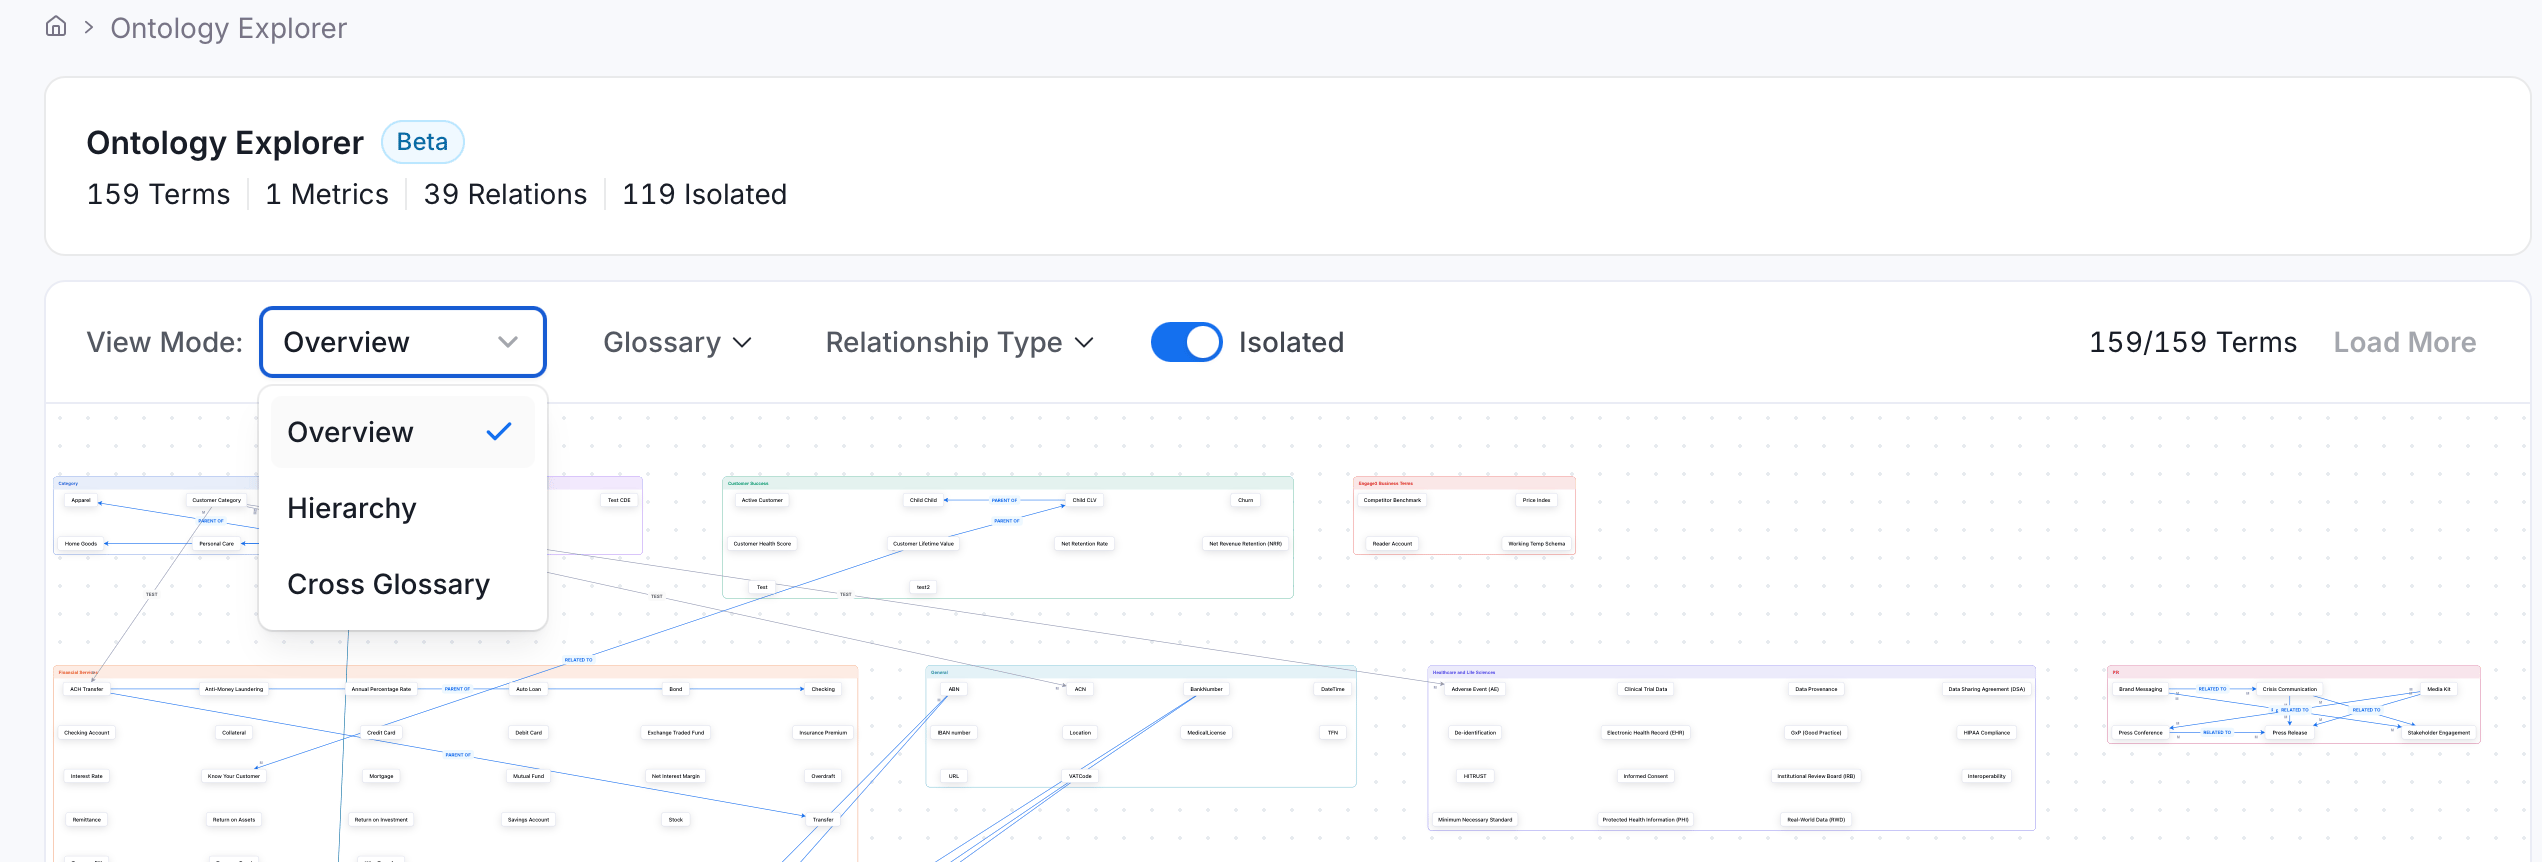
In Model view, use the View Mode dropdown to change how the graph is arranged:- Overview: The default flat view showing all term clusters and their relationships.
- Hierarchy: Arranges terms by parent/child structure.
- Cross Glossary: Shows only relationships that cross glossary boundaries. The Isolated toggle is disabled in this mode, since Cross Glossary excludes isolated terms by definition.
Filtering the Graph
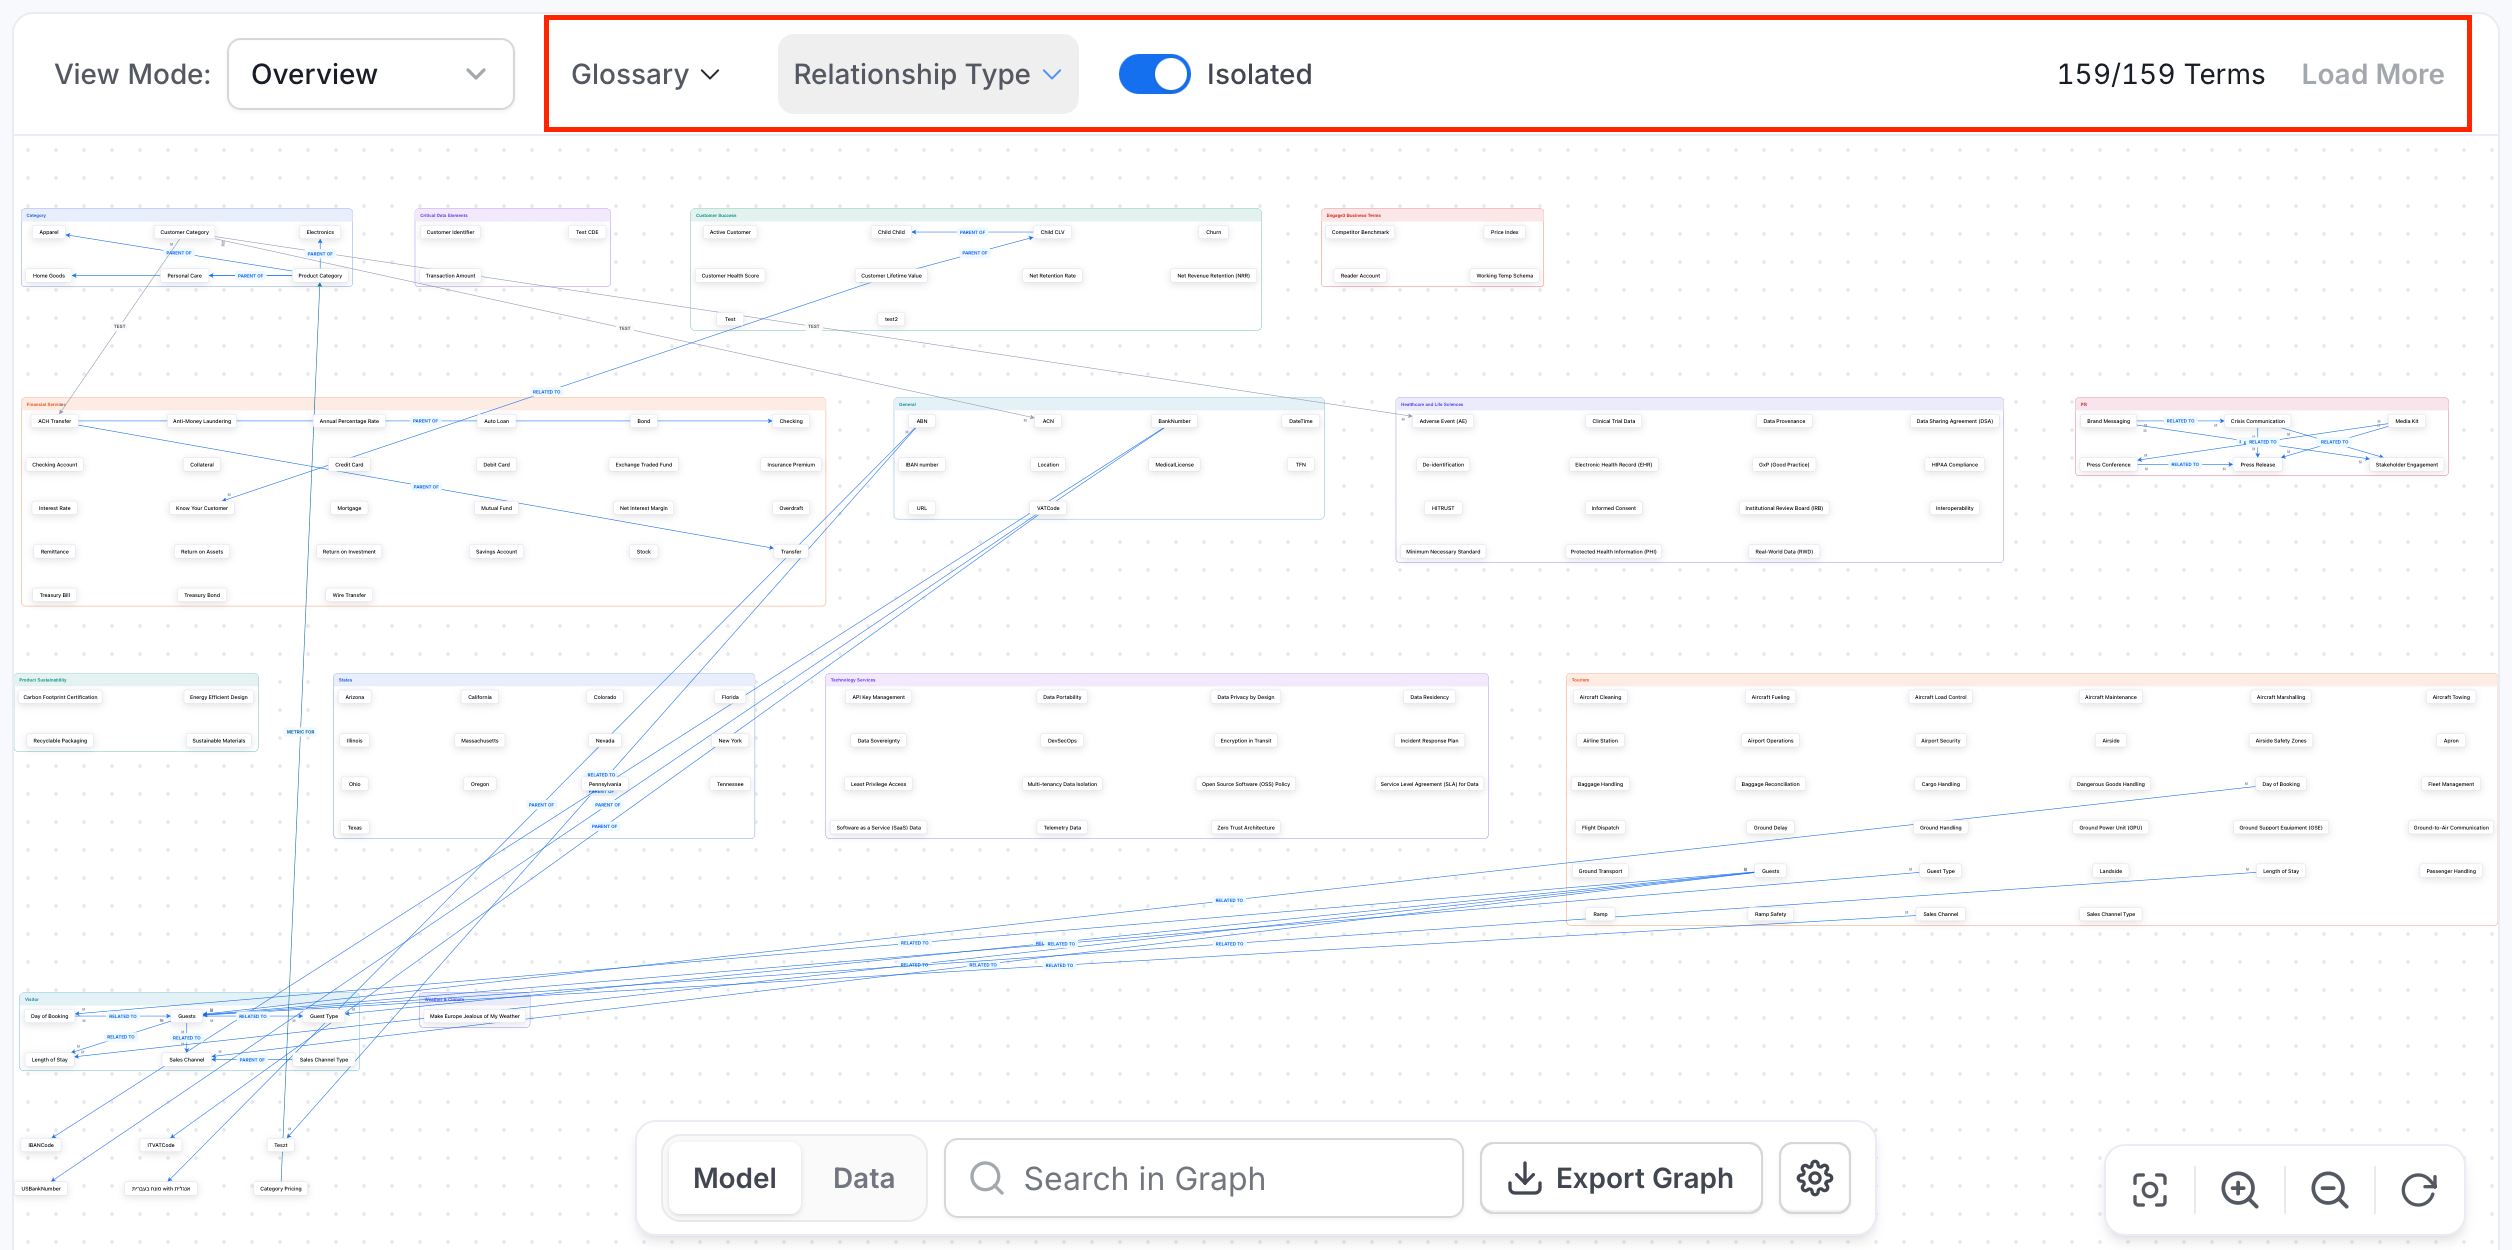
Narrow the graph down using the filter controls in the toolbar.- Glossary: Scope the graph to one or more specific glossaries.
- Relationship Type: Filter edges down to a specific relationship type.
- Isolated: Toggle whether the graph shows terms with no relationships.
- Term count: The toolbar shows how many terms are currently loaded (for example,
159/159 Terms)—use Load More to page in additional terms. - Clear all: Once a Glossary or Relationship Type filter is active, a Clear all button appears to reset both filters at once.
Searching, Exporting, and Graph Settings
Beyond filtering, the toolbar also covers search, export, layout, and canvas navigation.- Search in Graph: Find a specific term without manually scanning the canvas.
-
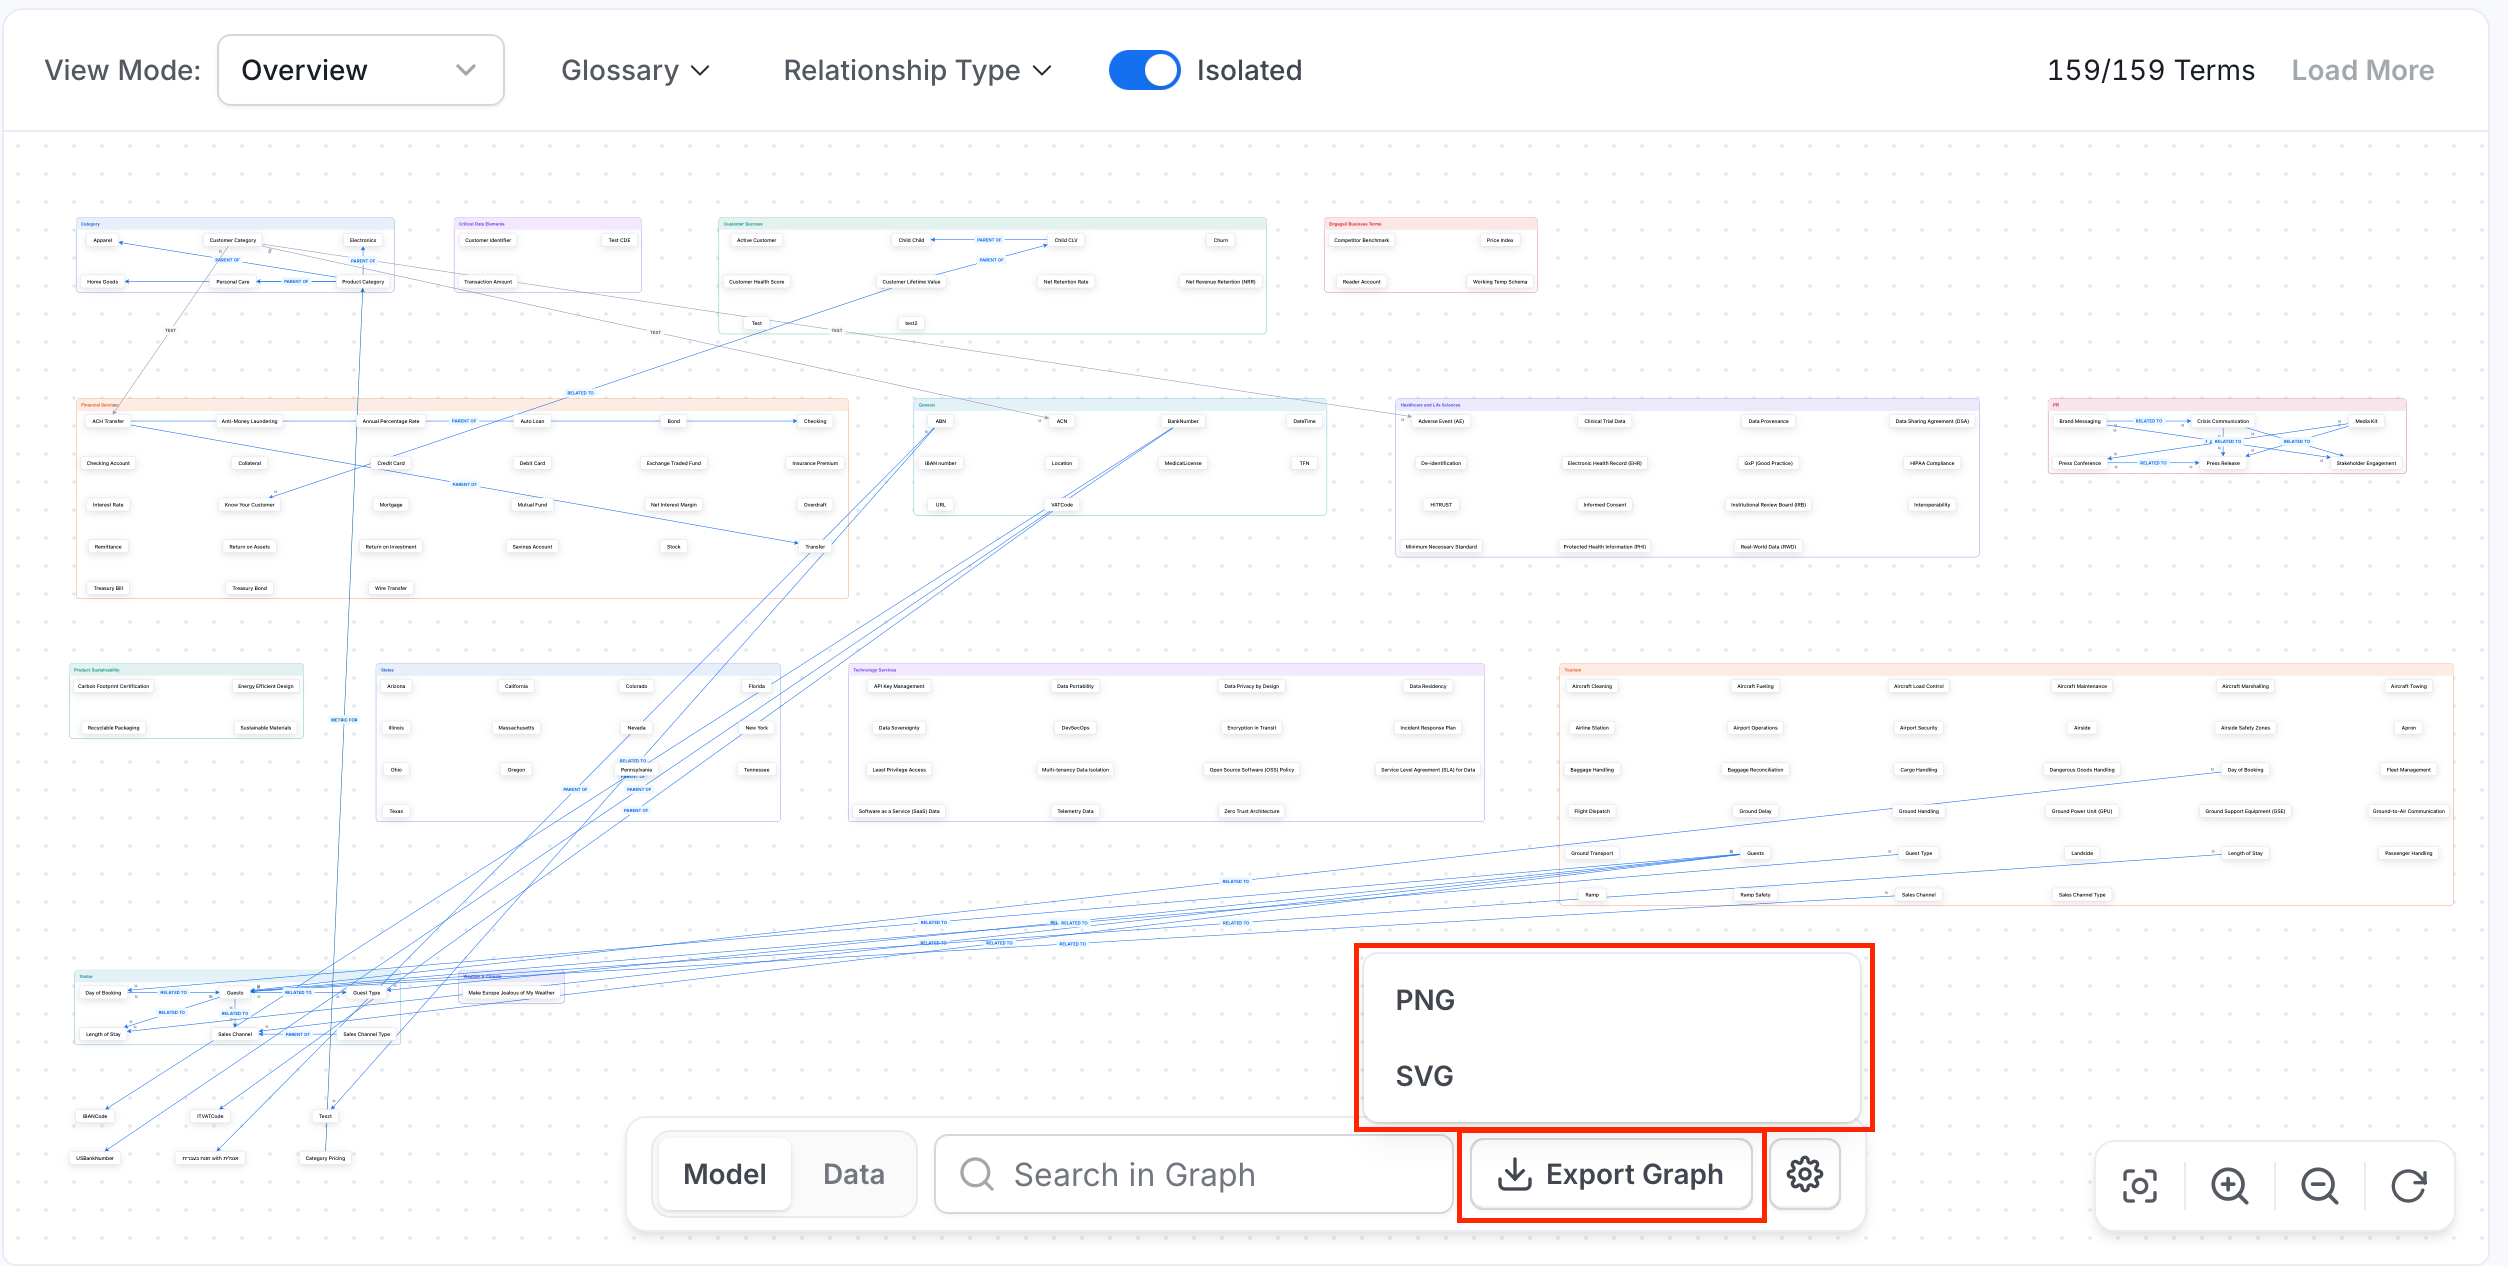
Export Graph: Download the current graph view as a PNG or SVG. If your instance has RDF (Resource Description Framework) indexing enabled and the graph is scoped to a single glossary, Turtle and RDF/XML export are also available.
-
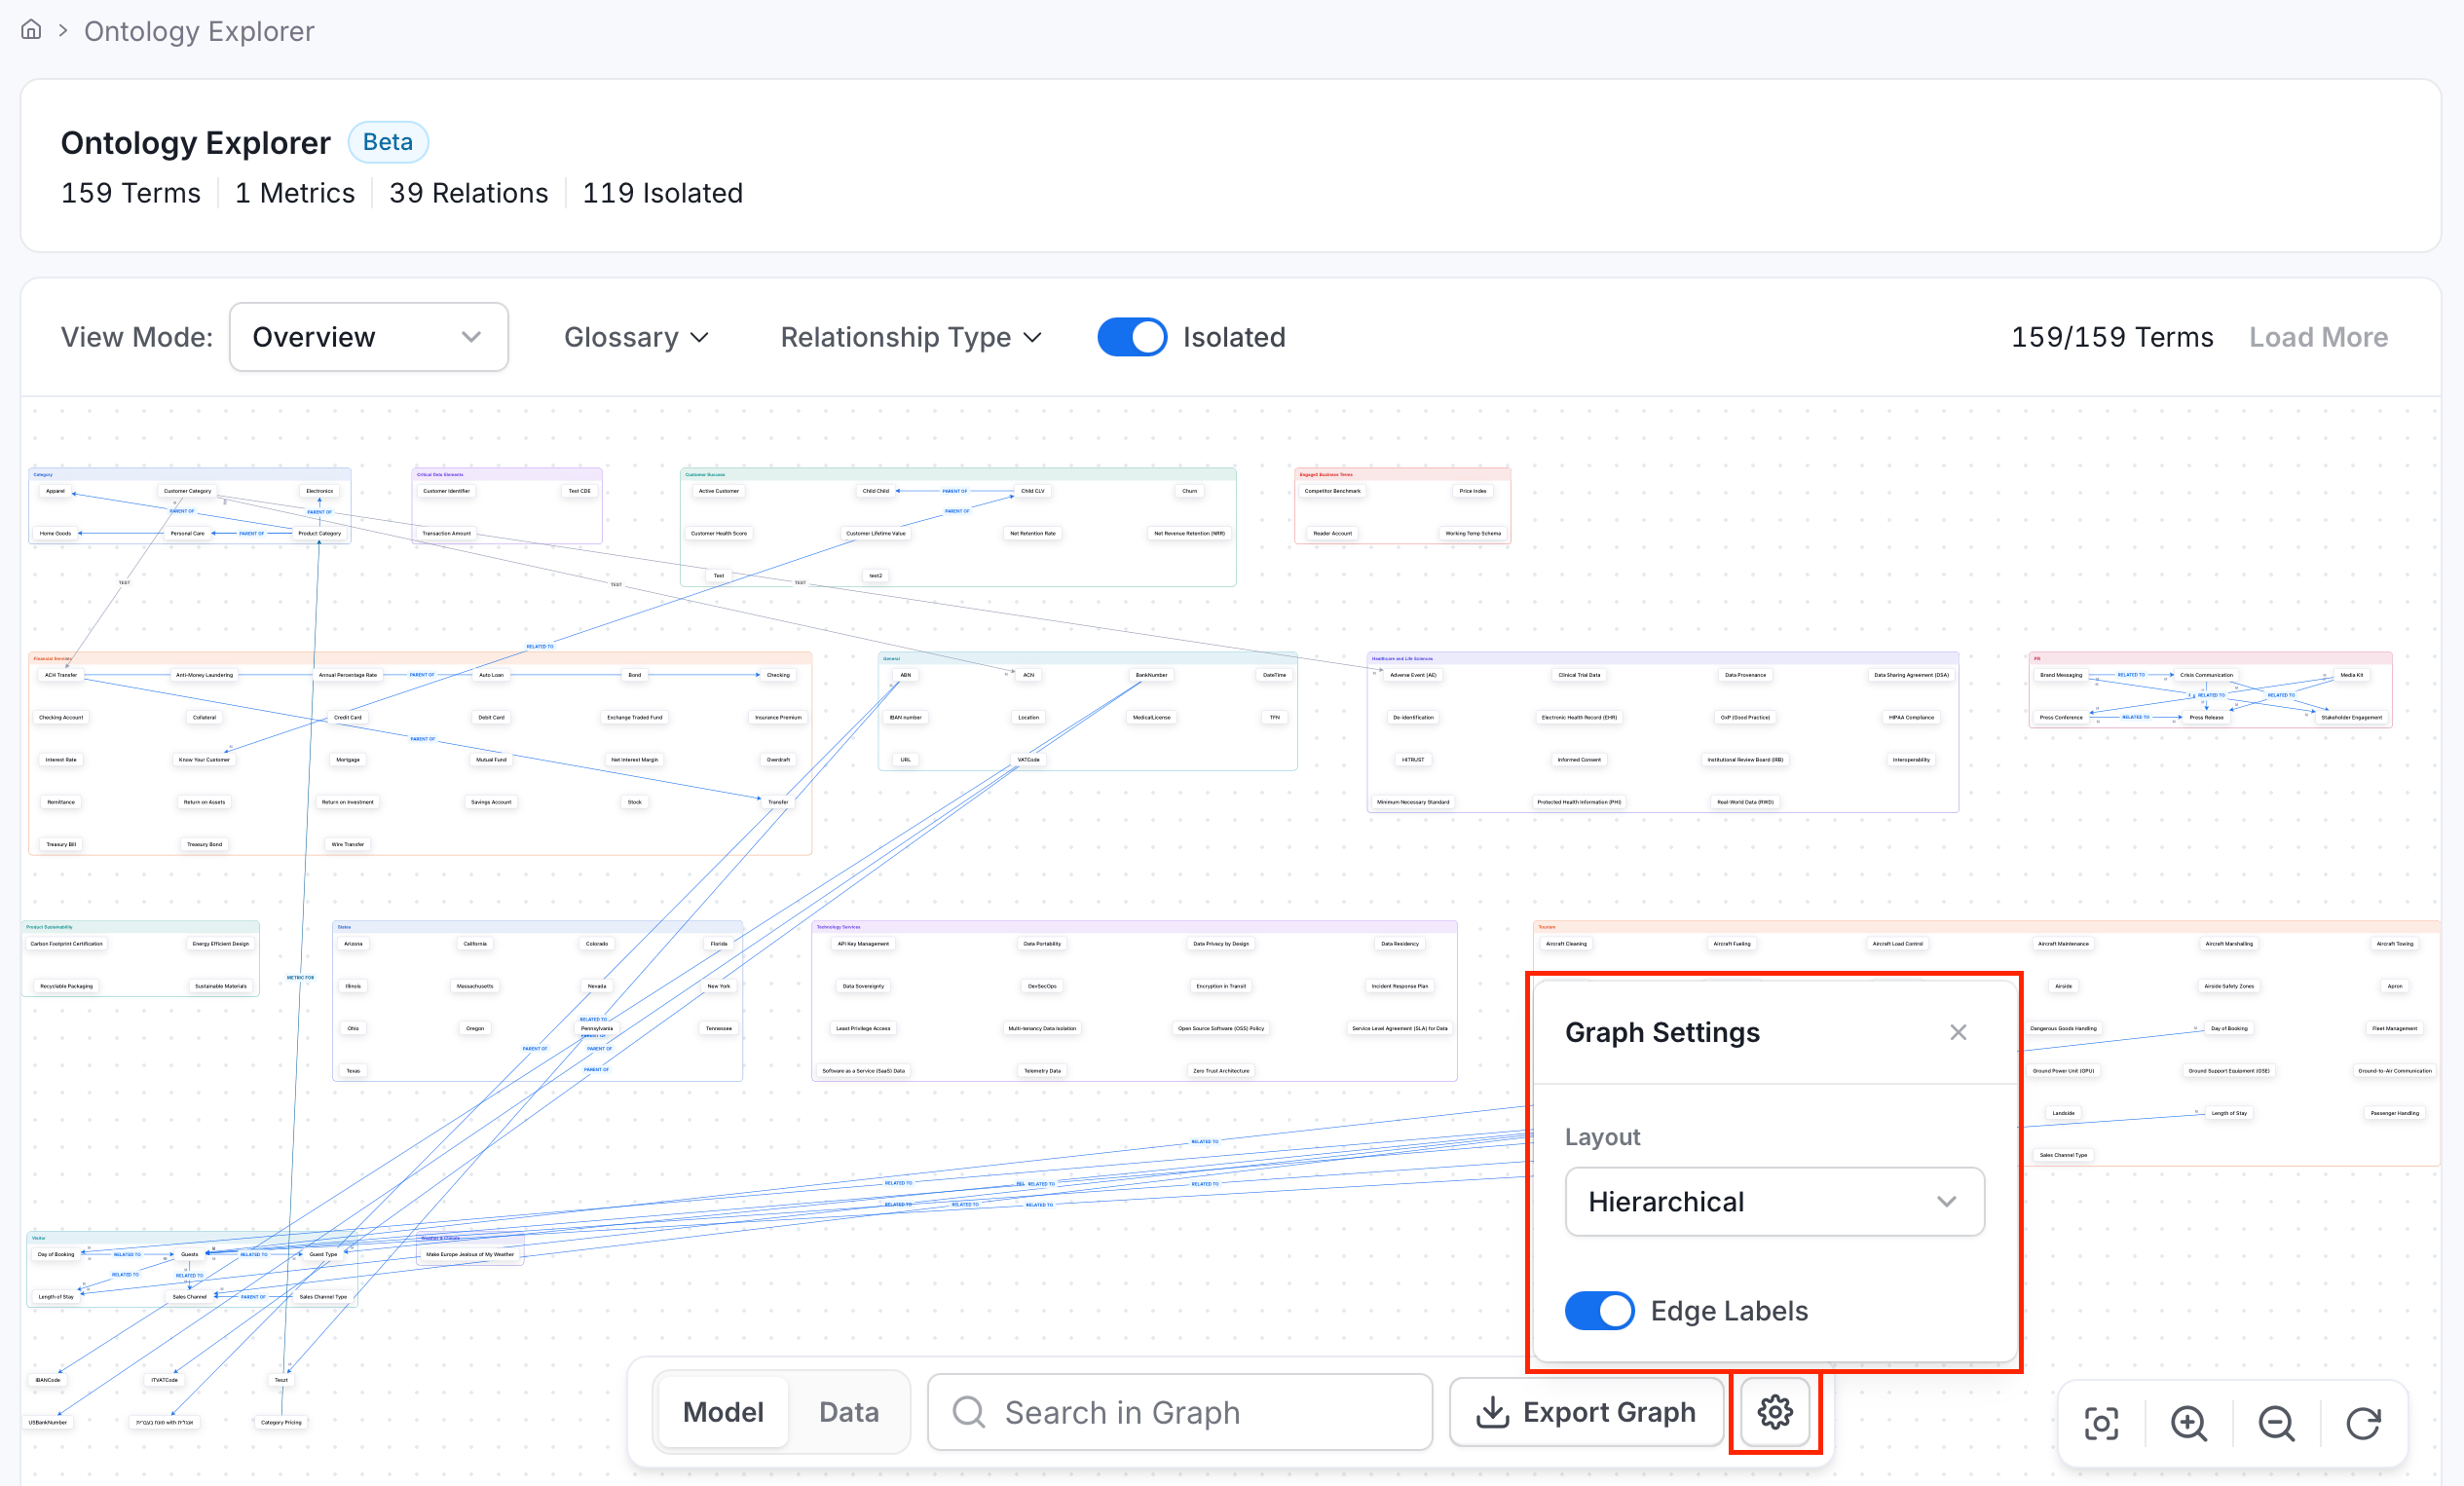
Graph Settings: Select the Settings icon to:
- Change the graph Layout—choose between Hierarchical and Circular.
- Hierarchical: Arranges terms into ranked, tree-like layers based on their relationships—useful for following parent/child structure top-down.
- Circular: Arranges terms around a circular layout instead of in ranked layers—useful for getting an overview of a cluster without a directional hierarchy.
- Toggle Edge Labels on or off, to show or hide relationship-type labels on the connecting lines.
- Change the graph Layout—choose between Hierarchical and Circular.
- Canvas controls: Use the canvas control icons to Fit to Screen, Zoom In, Zoom Out, or Refresh the graph.
Related Reading
Glossary
Learn how to create and organize glossary terms.
Relation Types
Configure the relation types available between glossary terms, including custom types.
RDF Indexing
Enable RDF indexing to unlock Turtle and RDF/XML export from the Ontology Explorer.