Collate: Entity Relationship (ER) Diagrams
Overview
Entity Relationship (ER) Diagrams in Collate provide a visual representation of how tables are connected within a database. These diagrams offer a complete picture of your data structure by automatically detecting relationships based on constraints such as primary keys and foreign keys during metadata ingestion.Automatic Detection of Relationships
Collate’s metadata ingestion workflow identifies and extracts table relationships, ensuring that primary key and foreign key constraints are accurately represented. Once ingestion is completed, users can access ER diagrams at both the table level and database schema level.Features of ER Diagrams
Visualizing Table Relationships
- ER diagrams display tables, constraints, and relationships between them.
- Relationship cardinality is clearly indicated, helping users understand data connections.
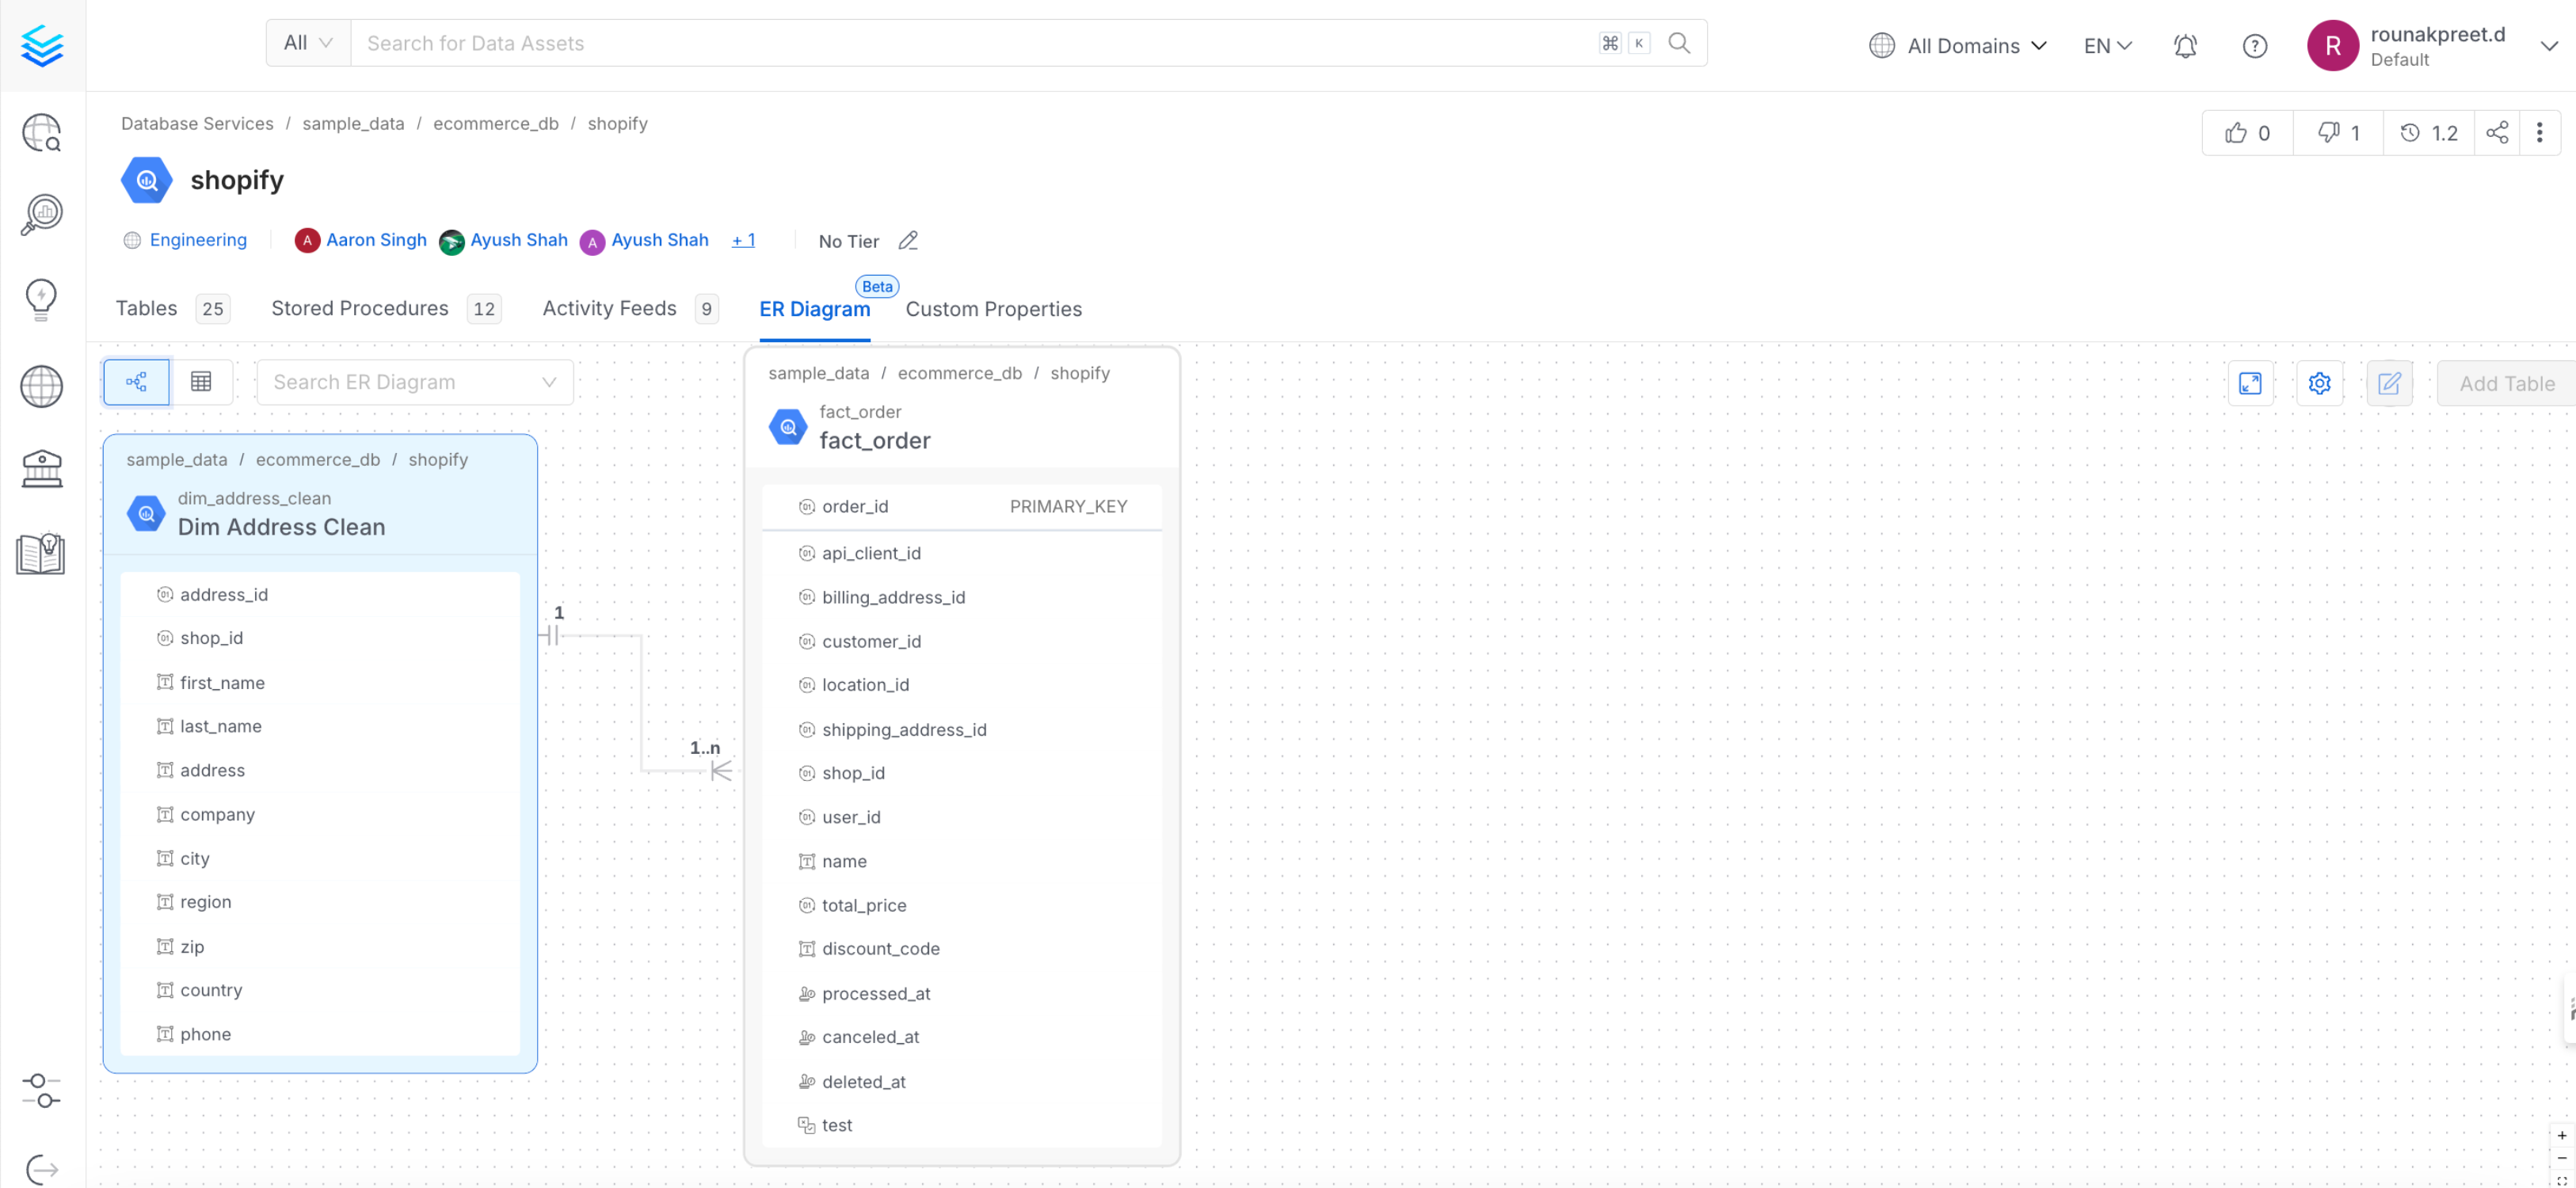
Interactive Exploration
- Users can navigate from table to table by following relationships.
- Enhances data discovery by making it more intuitive and efficient.
Editing Relationships
- Modify existing relationships by updating their type.
- Add or remove relationships to reflect changes in the database structure.
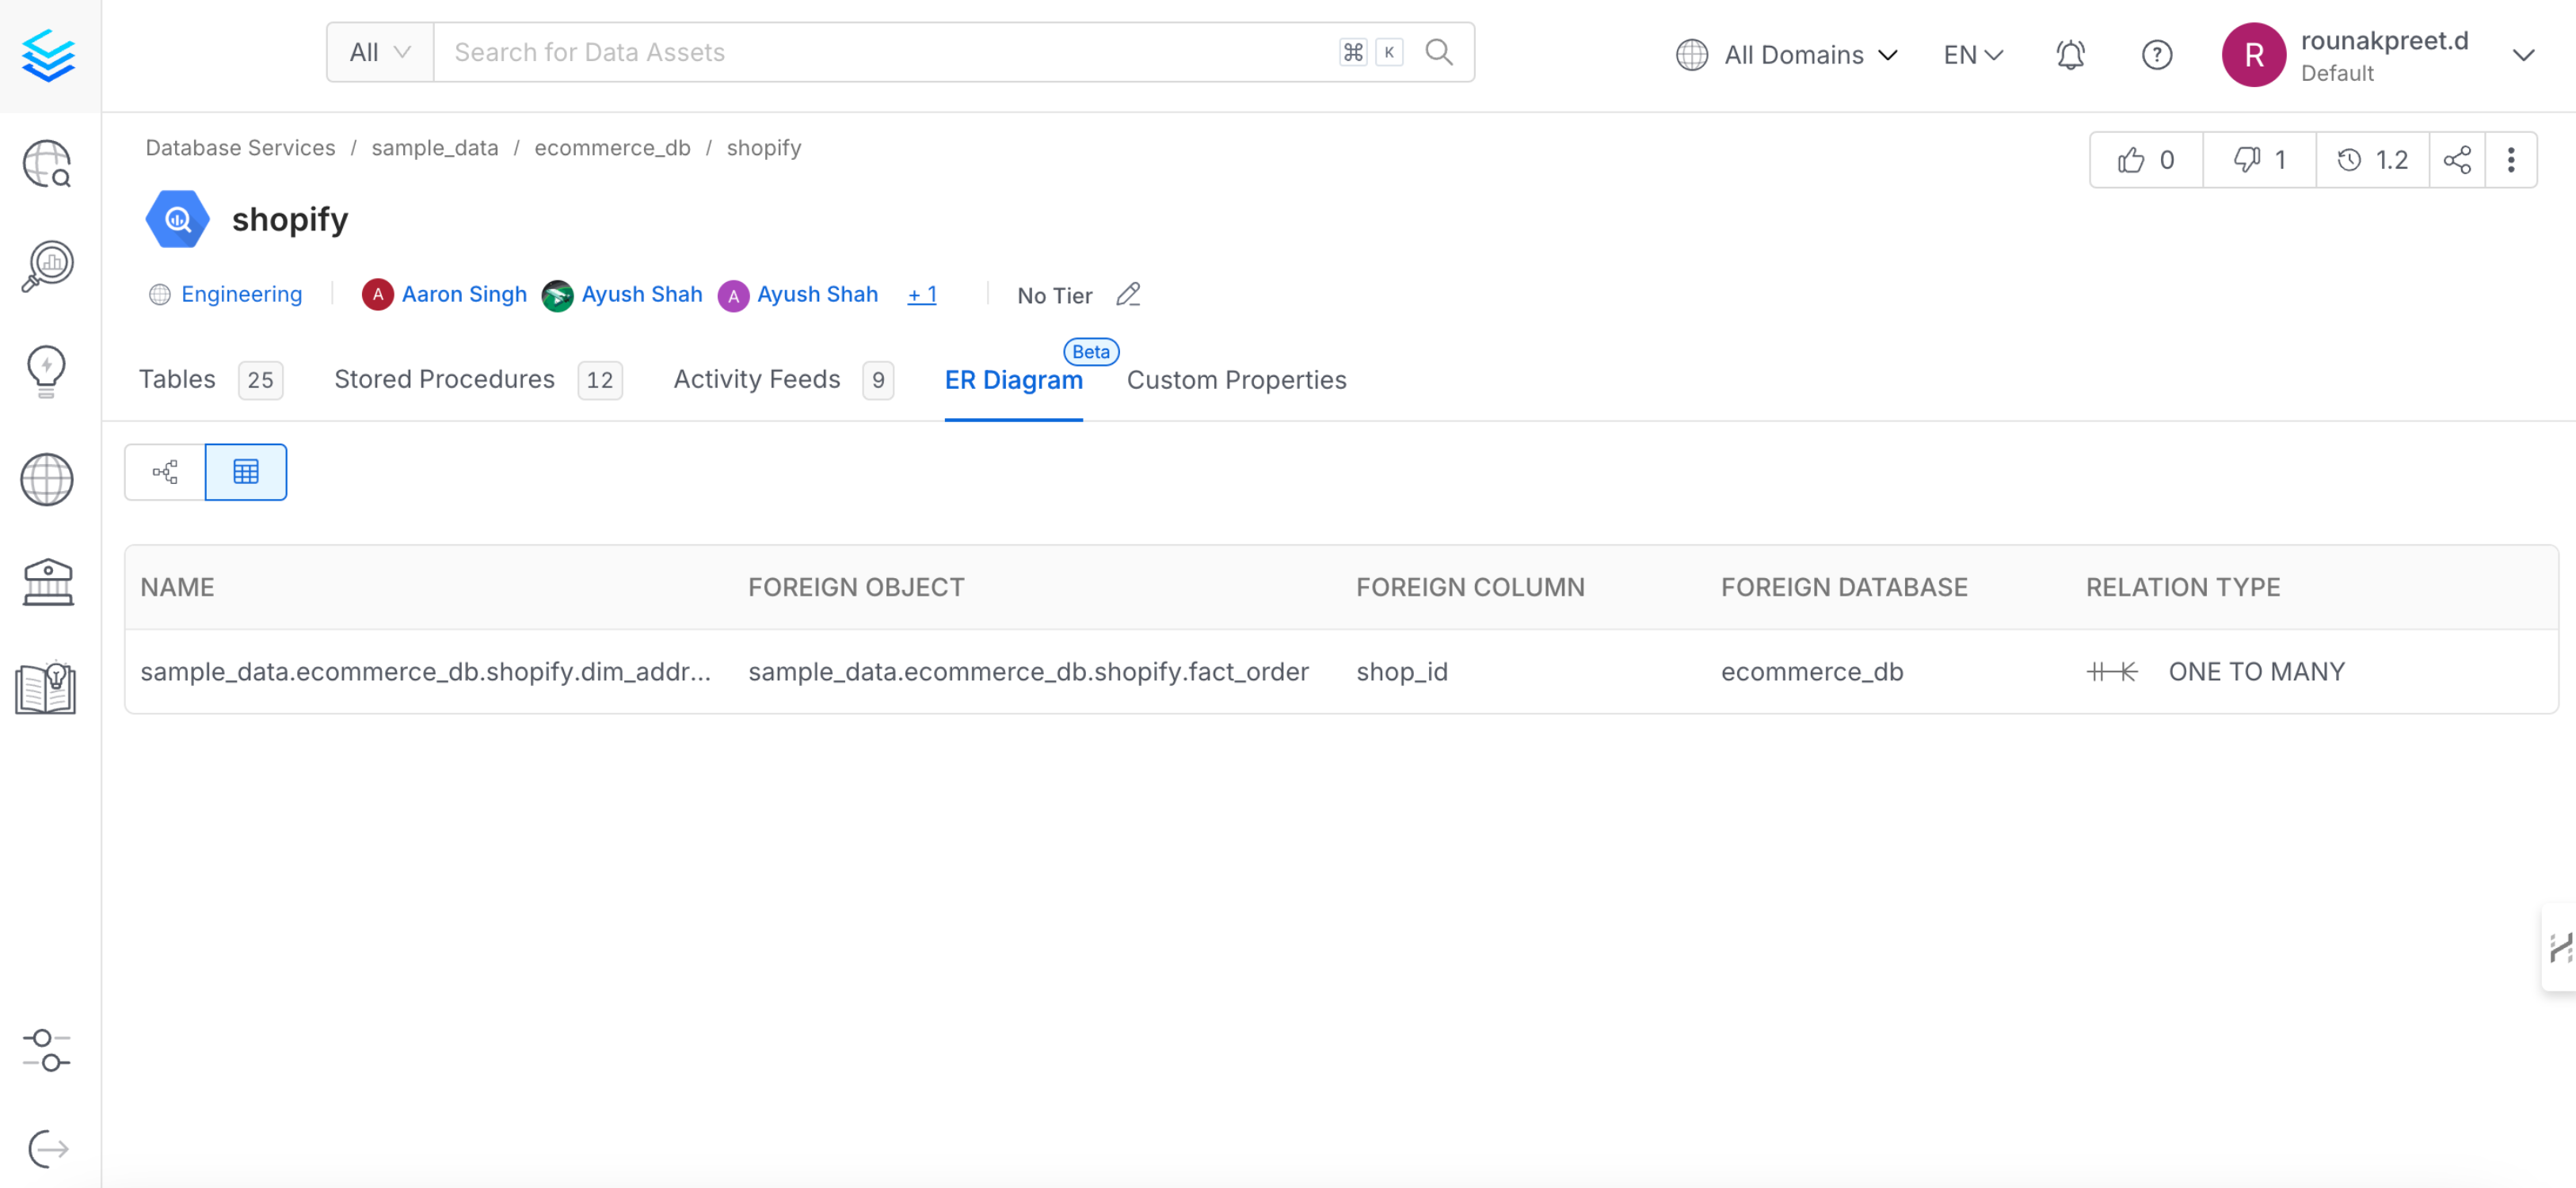
Table View for Simplified Insights
- In addition to the diagram, Collate offers a table view listing all relationships in a structured format.
- Provides a quick overview of data dependencies.
Benefits of ER Diagrams
Improved Database Understanding
- ER diagrams create a common language for database discussions.
- Helps teams visualize complex relationships and constraints.
Enhanced Troubleshooting & Impact Analysis
- Users can quickly identify table relationships and assess the impact of schema changes.
- Assists in debugging and optimizing database structures.