Requirements
There are two types of metadata we ingest from Looker:- Dashboards & Charts
- LookML Models
For the
projectmetadata being ingested: - We get the actual LookML Project an Explore or View is developed in.
- For Dashboards, we use the folder name from the UI, since there is no other hierarchy involved there.
In terms of permissions, we need a user with access to the Dashboards and LookML Explores that we want to ingest. You can
create your API credentials following these docs.
However, LookML Views are not present in the Looker SDK. Instead, we need to extract that information directly from
the GitHub repository holding the source
.lkmlfiles. In order to get this metadata, we will require a GitHub token with read only access to the repository. You can follow these steps from the GitHub documentation.
Entity Mapping
The Looker connector maps Looker assets to Collate entities as follows:Example Structure
Looker Structure:- Looker dashboards appear as Collate dashboards, organized by their Looker folder
- Dashboard tiles appear as charts underneath their dashboard
- LookML Explores and Views appear as data models, organized by their LookML project
- The project field is sourced differently depending on entity type: a Looker folder for Dashboards, a LookML project for Data Models
Metadata Ingestion
Connection Details
1
Connection Details
- Host and Port: URL to the Looker instance, e.g.,
https://my-company.region.looker.com. - Client ID: User’s Client ID to authenticate to the SDK. This user should have privileges to read all the metadata in Looker.
- Client Secret: User’s Client Secret for the same ID provided. Then, if we choose to inform the GitHub credentials to ingest LookML Views:
- Repository Owner: The owner (user or organization) of a GitHub repository. For example, in https://github.com/open-metadata/OpenMetadata, the owner is
open-metadata. - Repository Name: The name of a GitHub repository. For example, in https://github.com/open-metadata/OpenMetadata, the name is
OpenMetadata. - API Token: Token to use the API. This is required for private repositories and to ensure we don’t hit API limits.
Follow these steps in order to create a fine-grained personal access token.
When configuring, give repository access to
Only select repositoriesand choose the one containing your LookML files. Then, we only needRepository PermissionsasRead-onlyforContents.
2
Test the Connection
Once the credentials have been added, click on Test Connection and Save the changes.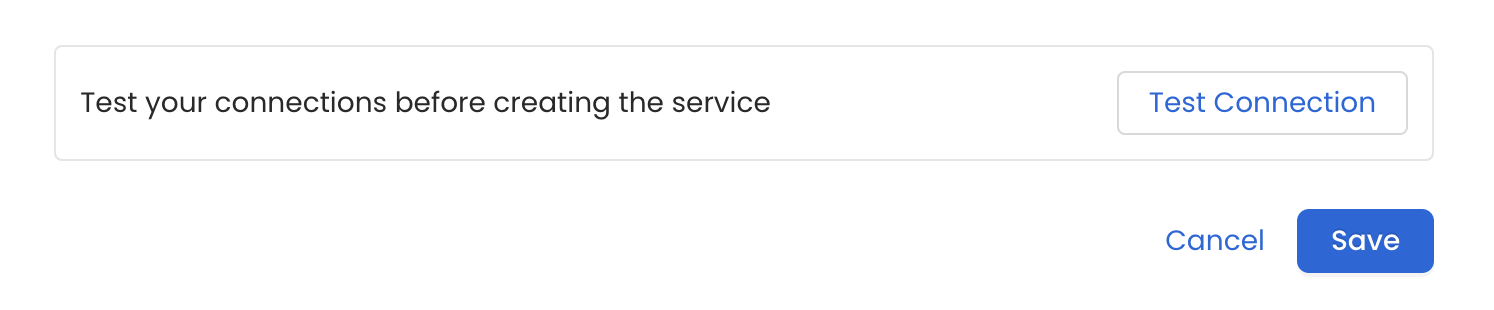
3
Configure Metadata Ingestion
After adding and testing the dashboard service, configure the metadata ingestion pipeline. To configure, follow the steps below: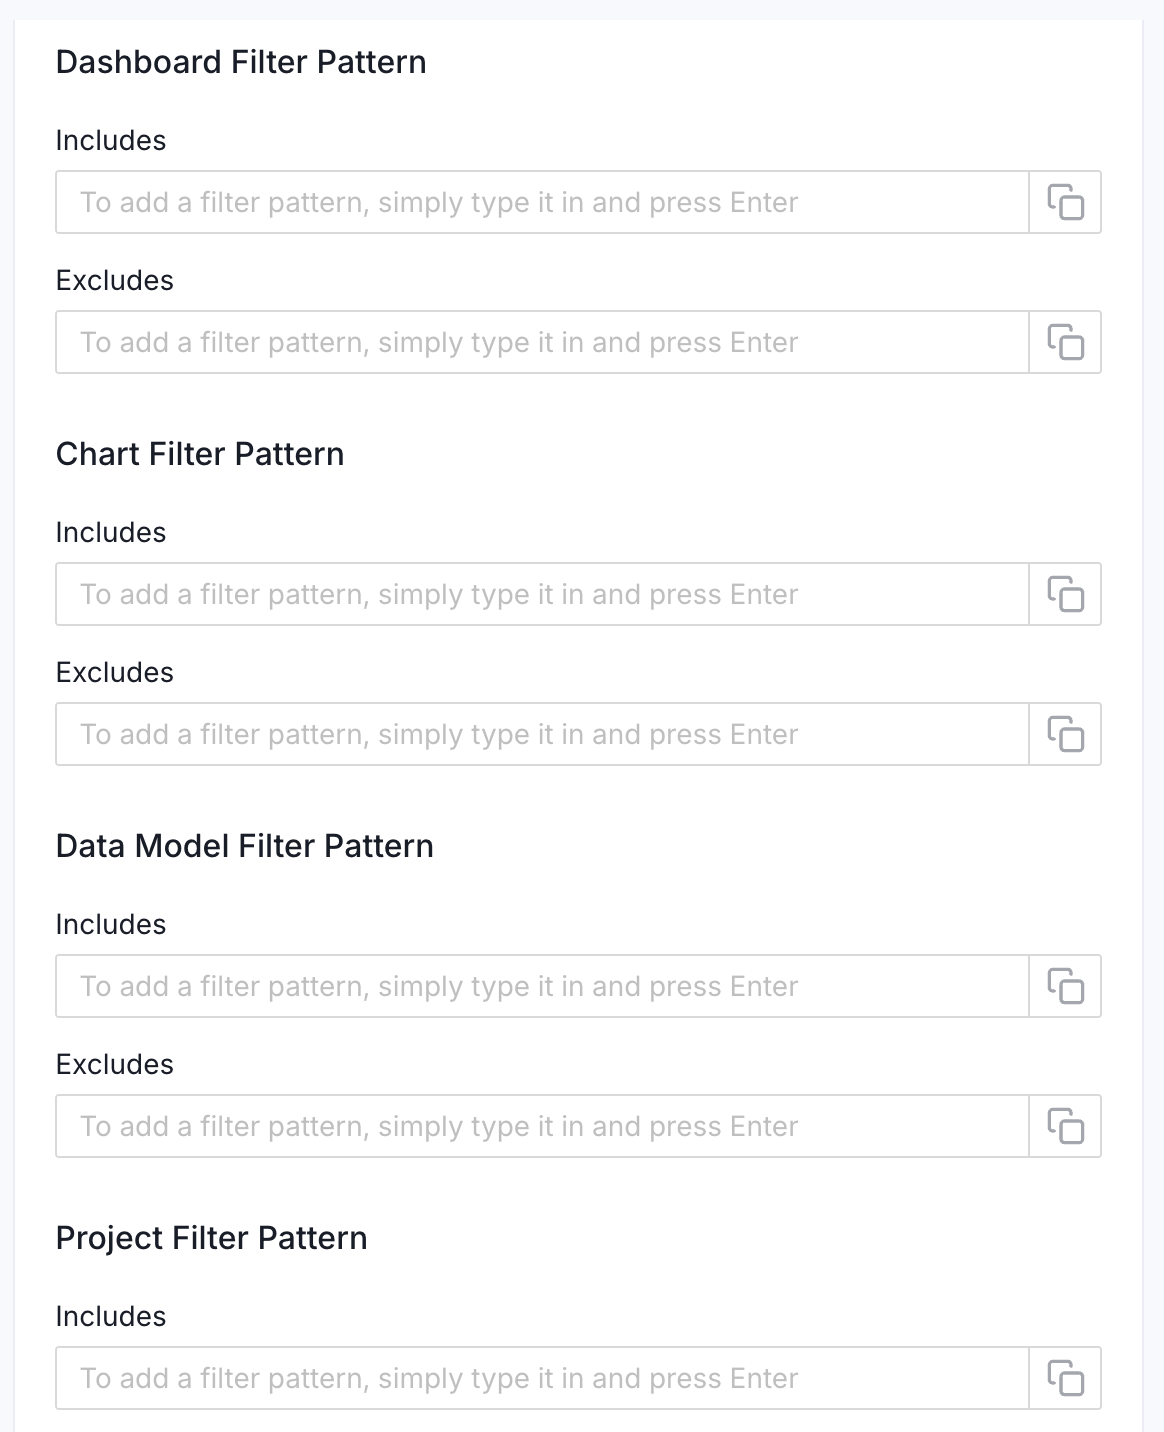
- Navigate to Settings > Services > Dashboards.
- On the Dashboards services page, click the service you’ve added.
- Go to the Agents tab, and then click Add Agent > Add Metadata Agent.
- Configure the ingestion details. See Metadata Ingestion Options.
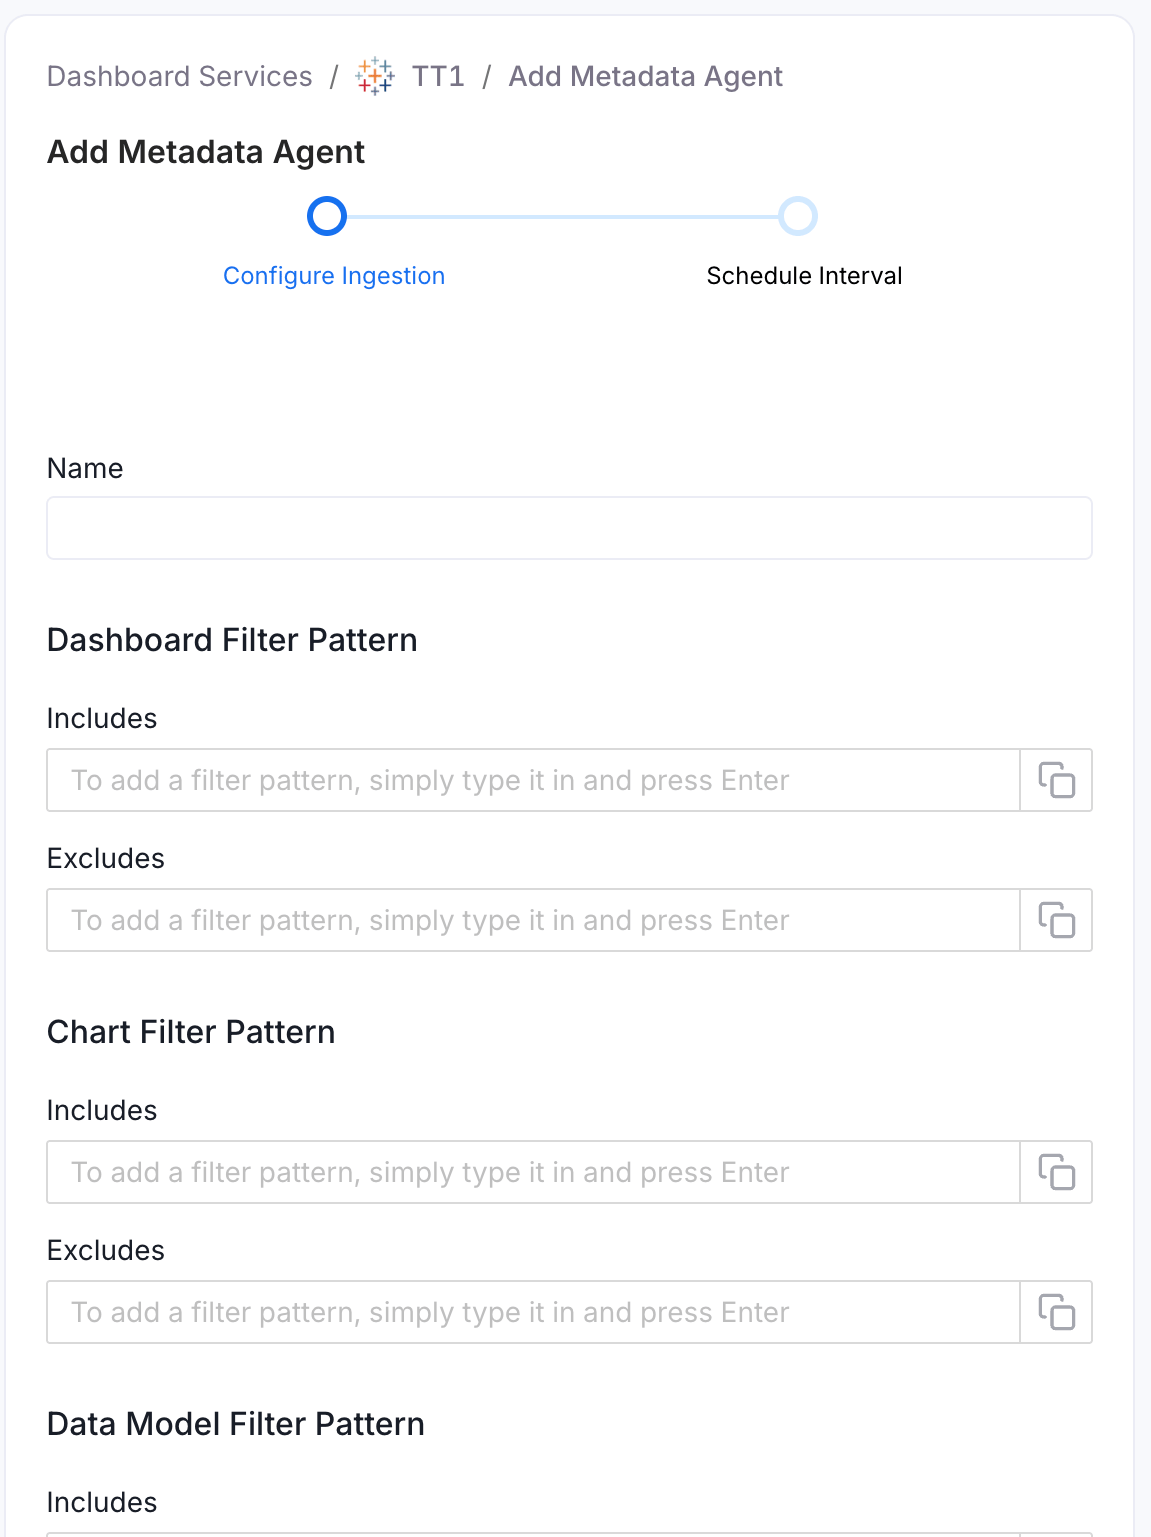
Metadata Ingestion Options
- Name: This field is the name of the ingestion pipeline. Customize it or use the generated name.
- Dashboard Filter Pattern (Optional): Use it to control whether to include dashboards as part of metadata ingestion.
- Include: Explicitly include dashboards by adding comma-separated regular expressions to the ‘Include’ field. OpenMetadata will include all dashboards with names matching one or more of the supplied regular expressions. All other dashboards will be excluded.
- Exclude: Explicitly exclude dashboards by adding comma-separated regular expressions to the ‘Exclude’ field. OpenMetadata will exclude all dashboards with names matching one or more of the supplied regular expressions. All other dashboards will be included.
- Chart Filter Pattern (Optional): Use it to control whether to include charts as part of metadata ingestion.
- Include: Explicitly include charts by adding comma-separated regular expressions to the ‘Include’ field. OpenMetadata will include all charts with names matching one or more of the supplied regular expressions. All other charts will be excluded.
- Exclude: Explicitly exclude charts by adding comma-separated regular expressions to the ‘Exclude’ field. OpenMetadata will exclude all charts with names matching one or more of the supplied regular expressions. All other charts will be included.
- Data Model Filter Pattern (Optional): Use it to control whether to include data models as part of metadata ingestion.
- Include: Explicitly include data models by adding comma-separated regular expressions to the ‘Include’ field. OpenMetadata will include all data models with names matching one or more of the supplied regular expressions. All other data models will be excluded.
- Exclude: Explicitly exclude data models by adding comma-separated regular expressions to the ‘Exclude’ field. OpenMetadata will exclude all data models with names matching one or more of the supplied regular expressions. All other data models will be included.
- Project Filter Pattern: Filter the dashboards, charts, and data sources by projects. Note that all of them support regex as include or exclude. For example, “My project, My proj.*, .*Project”.
- Enable Debug Log: Enable this toggle to use debug-level logging.
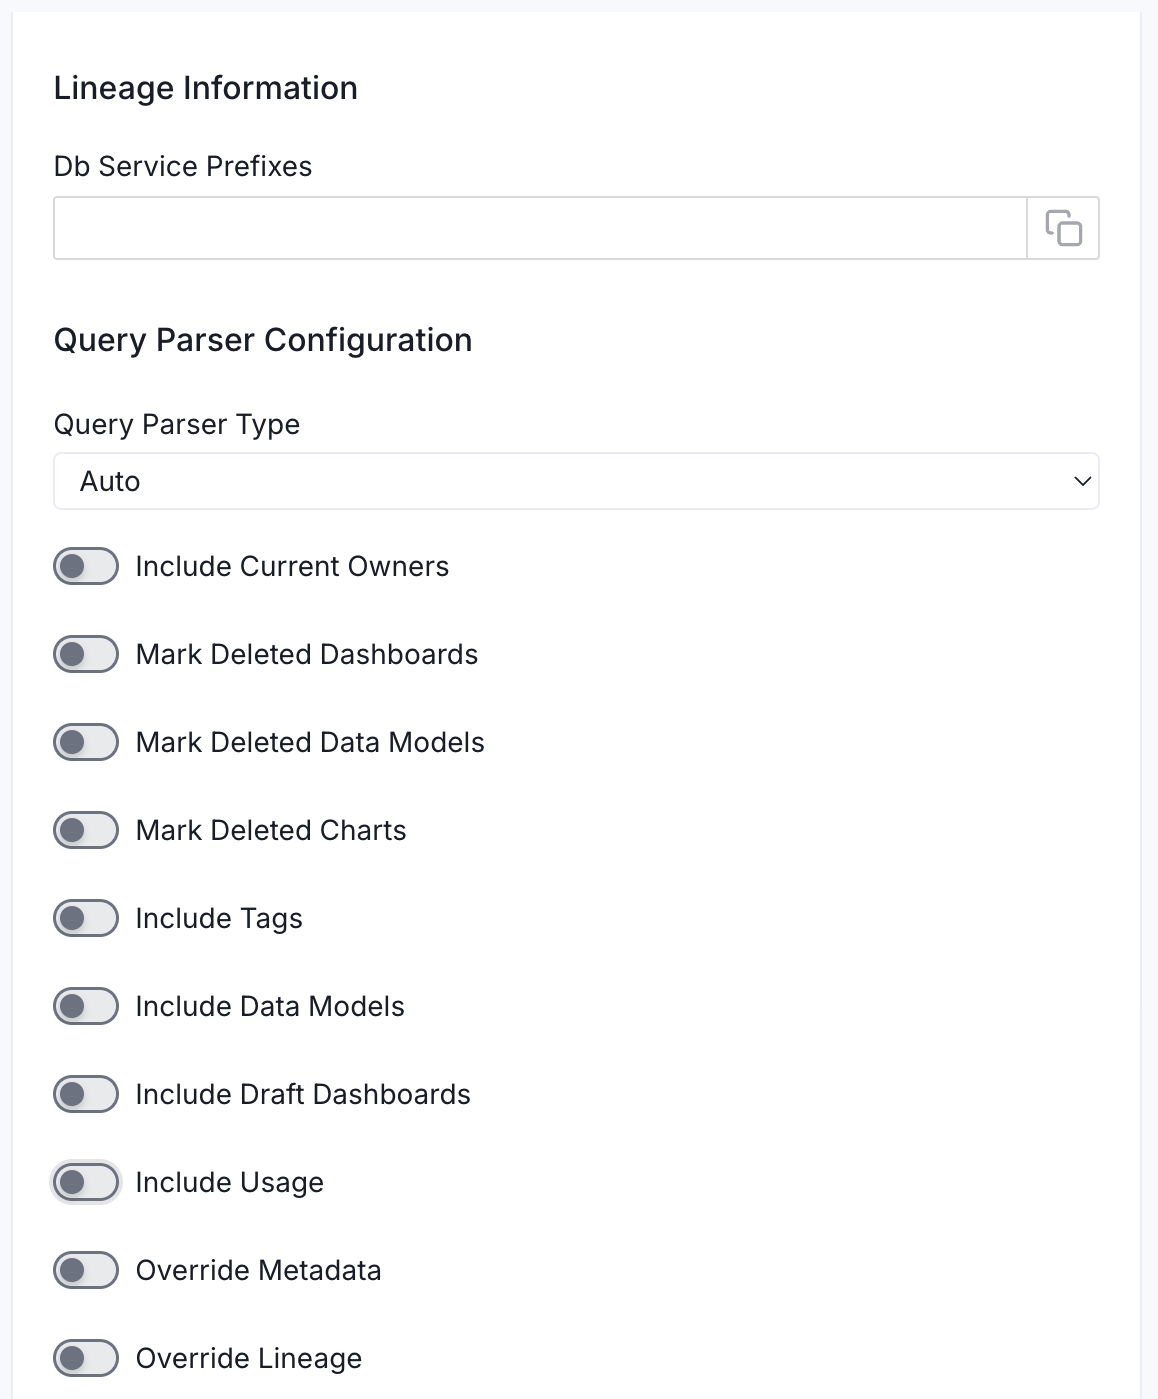
- Lineage Information (Optional): Configure this section to enable lineage between your dashboards and the database tables they are built on. OpenMetadata uses the database service name to match and draw the lineage path from table to dashboard.
- Db Service Prefixes: Enter one or more service path prefixes to tell OpenMetadata where to look for the source tables used by your dashboards. Supported formats:
DBServiceName—matches all tables in the serviceDBServiceName.DatabaseName—matches tables in a specific databaseDBServiceName.DatabaseName.SchemaName—matches tables in a specific schemaDBServiceName.DatabaseName.SchemaName.TableName—matches a specific table
- Db Service Prefixes: Enter one or more service path prefixes to tell OpenMetadata where to look for the source tables used by your dashboards. Supported formats:
- Query Parser Configuration: Controls how OpenMetadata parses SQL queries to extract lineage. Use this to select the SQL parser that best fits your data source’s dialect.
- Query Parser Type: Choose the SQL parser for lineage extraction:
- Auto (default): Automatically tries SqlGlot first, falls back to SqlFluff, then SqlParse. Recommended for best results.
- SqlGlot: High-performance parser with good dialect support. Falls back to SqlParse on failure.
- SqlFluff: Comprehensive but slower parser with strong dialect support. Falls back to SqlParse on failure.
- Query Parser Type: Choose the SQL parser for lineage extraction:
- Include Current Owners: Enable this toggle to control whether to include owners for the ingested entity if the owner email matches a user stored in the Collate server as part of metadata ingestion. If the ingested entity already exists and has an owner, the owner will not be overwritten.
- Mark Deleted Dashboards: Optional configuration to soft delete dashboards in OpenMetadata if the source dashboards are deleted. After deleting, all associated entities like lineage and other related data for that dashboard will be deleted.
- Mark Deleted Data Models: Optional configuration to soft delete data models in OpenMetadata if the source data models are deleted. After deleting, all associated entities with that data model will be deleted.
- Mark Deleted Charts: Optional configuration to soft delete charts in OpenMetadata if the source charts are deleted. After deleting, all associated entities with that chart will be deleted.
- Include Tags: Enable this toggle to control whether to include tags in metadata ingestion.
- Include Data Models: Enable this toggle to control whether to include data models as part of metadata ingestion.
- Include Draft Dashboard: Enable this toggle to include draft dashboards. By default, this is enabled.
- Include Usage: Enable this toggle to control whether to include usage data as part of metadata ingestion.
- Override Metadata: Enable this toggle to control whether to override the existing metadata in the Collate server with the metadata fetched from the source. If enabled, the metadata fetched from the source will override the existing metadata in OpenMetadata. If disabled, only fields that have no value in OpenMetadata will be updated. This is applicable for fields like description, tags, owner, and displayName.
- Override Lineage: Enable this toggle to control whether to override the existing lineage in OpenMetadata with the lineage fetched from the source. If enabled, existing lineage will be replaced. If disabled, new lineage edges will be added without removing existing ones.
4
Schedule the Ingestion and Deploy
Scheduling can be set up at an hourly, daily, weekly, or manual cadence. The
timezone is in UTC. Select a Start Date to schedule for ingestion. It is
optional to add an End Date.Review your configuration settings. If they match what you intended,
click Deploy to create the service and schedule metadata ingestion.If something doesn’t look right, click the Back button to return to the
appropriate step and change the settings as needed.After configuring the workflow, you can click on Deploy to create the
pipeline.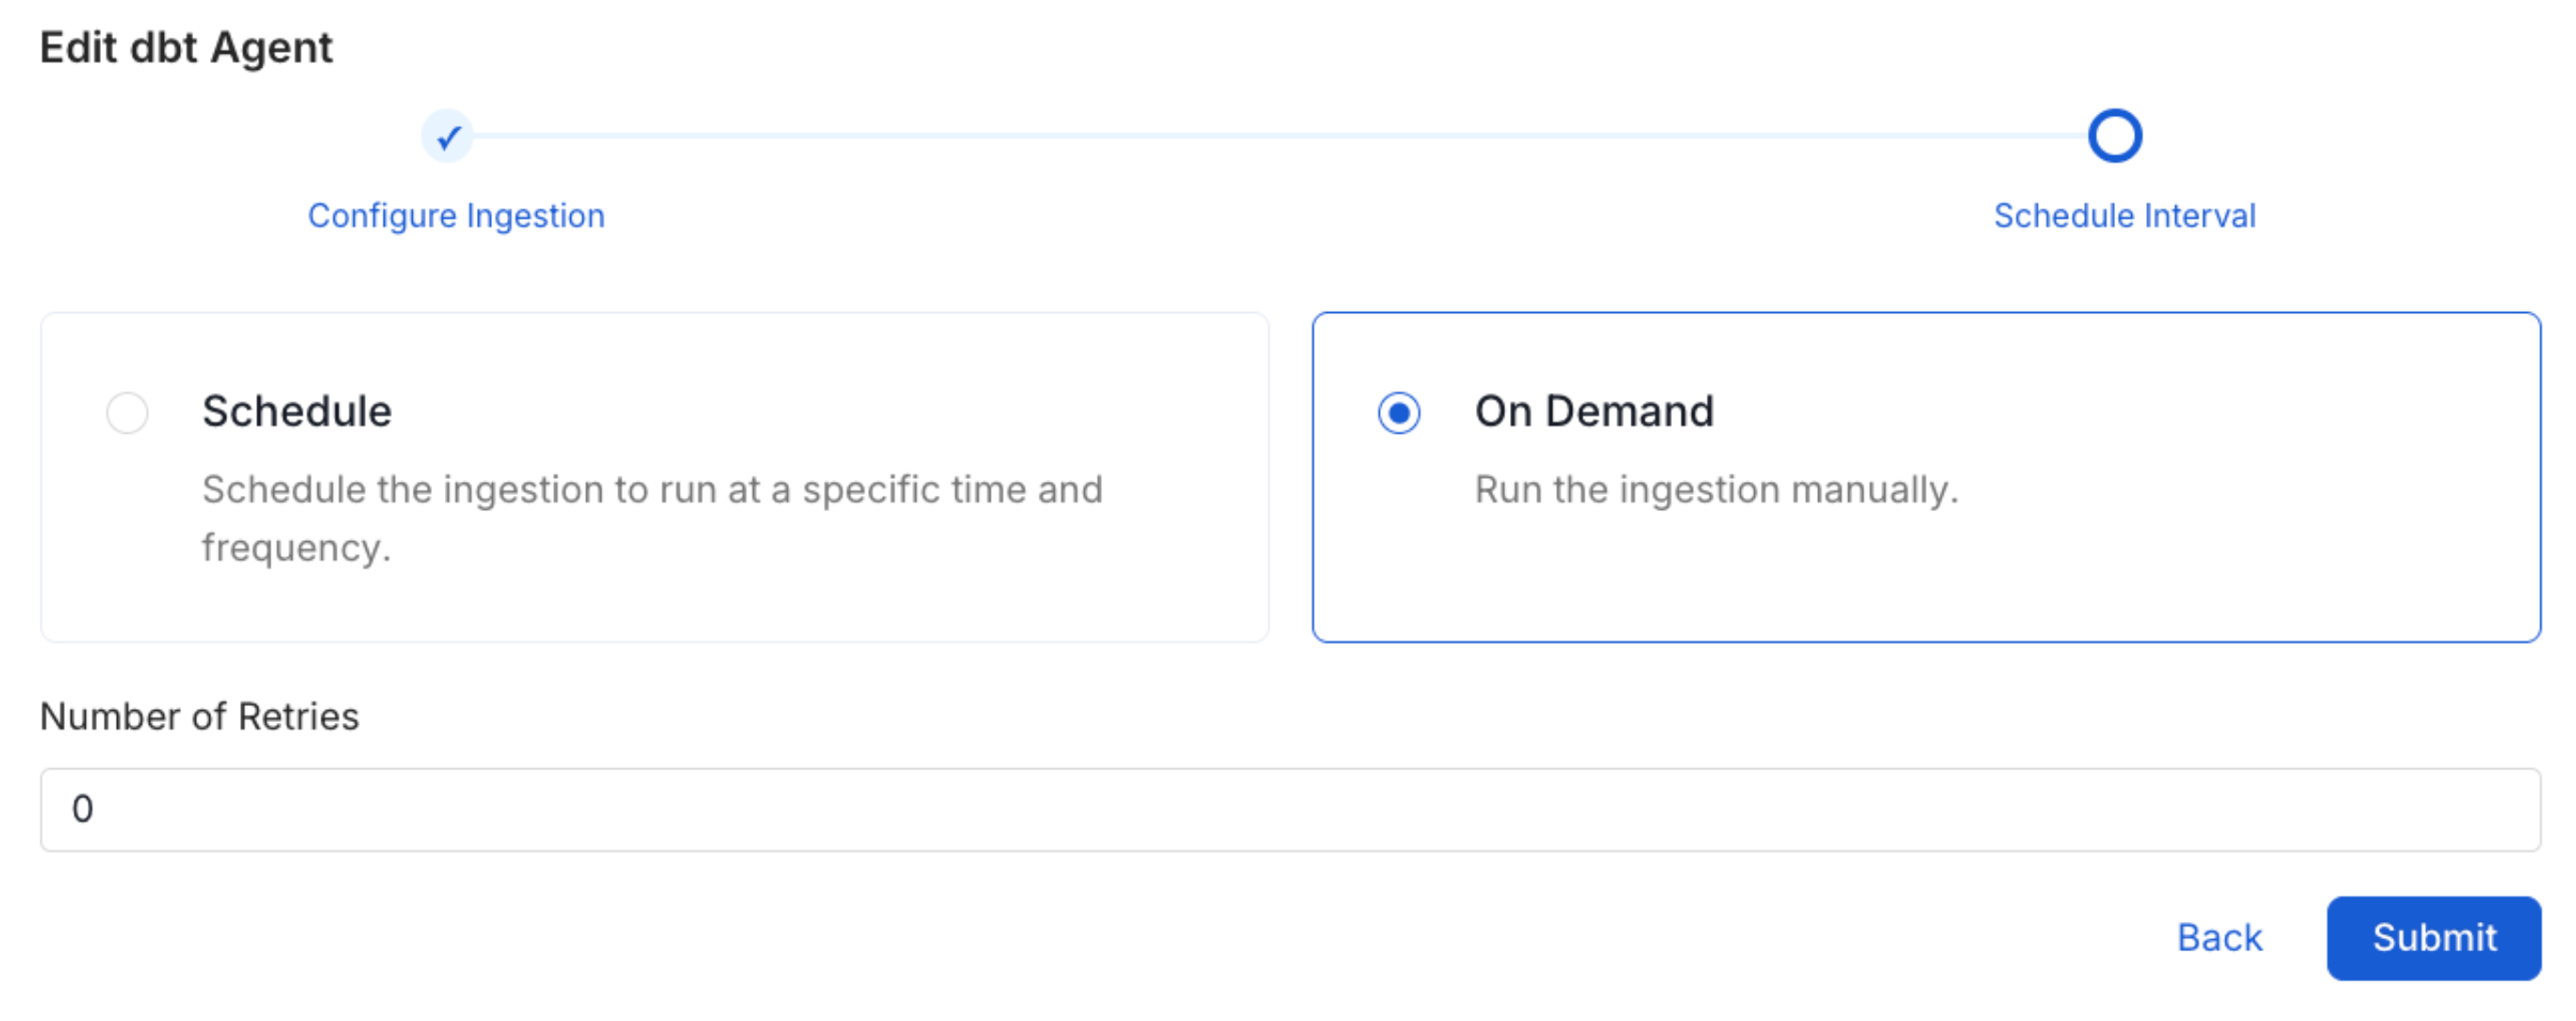
5
View the Ingestion Pipeline
Once the workflow has been successfully deployed, you can view the
Ingestion Pipeline running from the Service Page.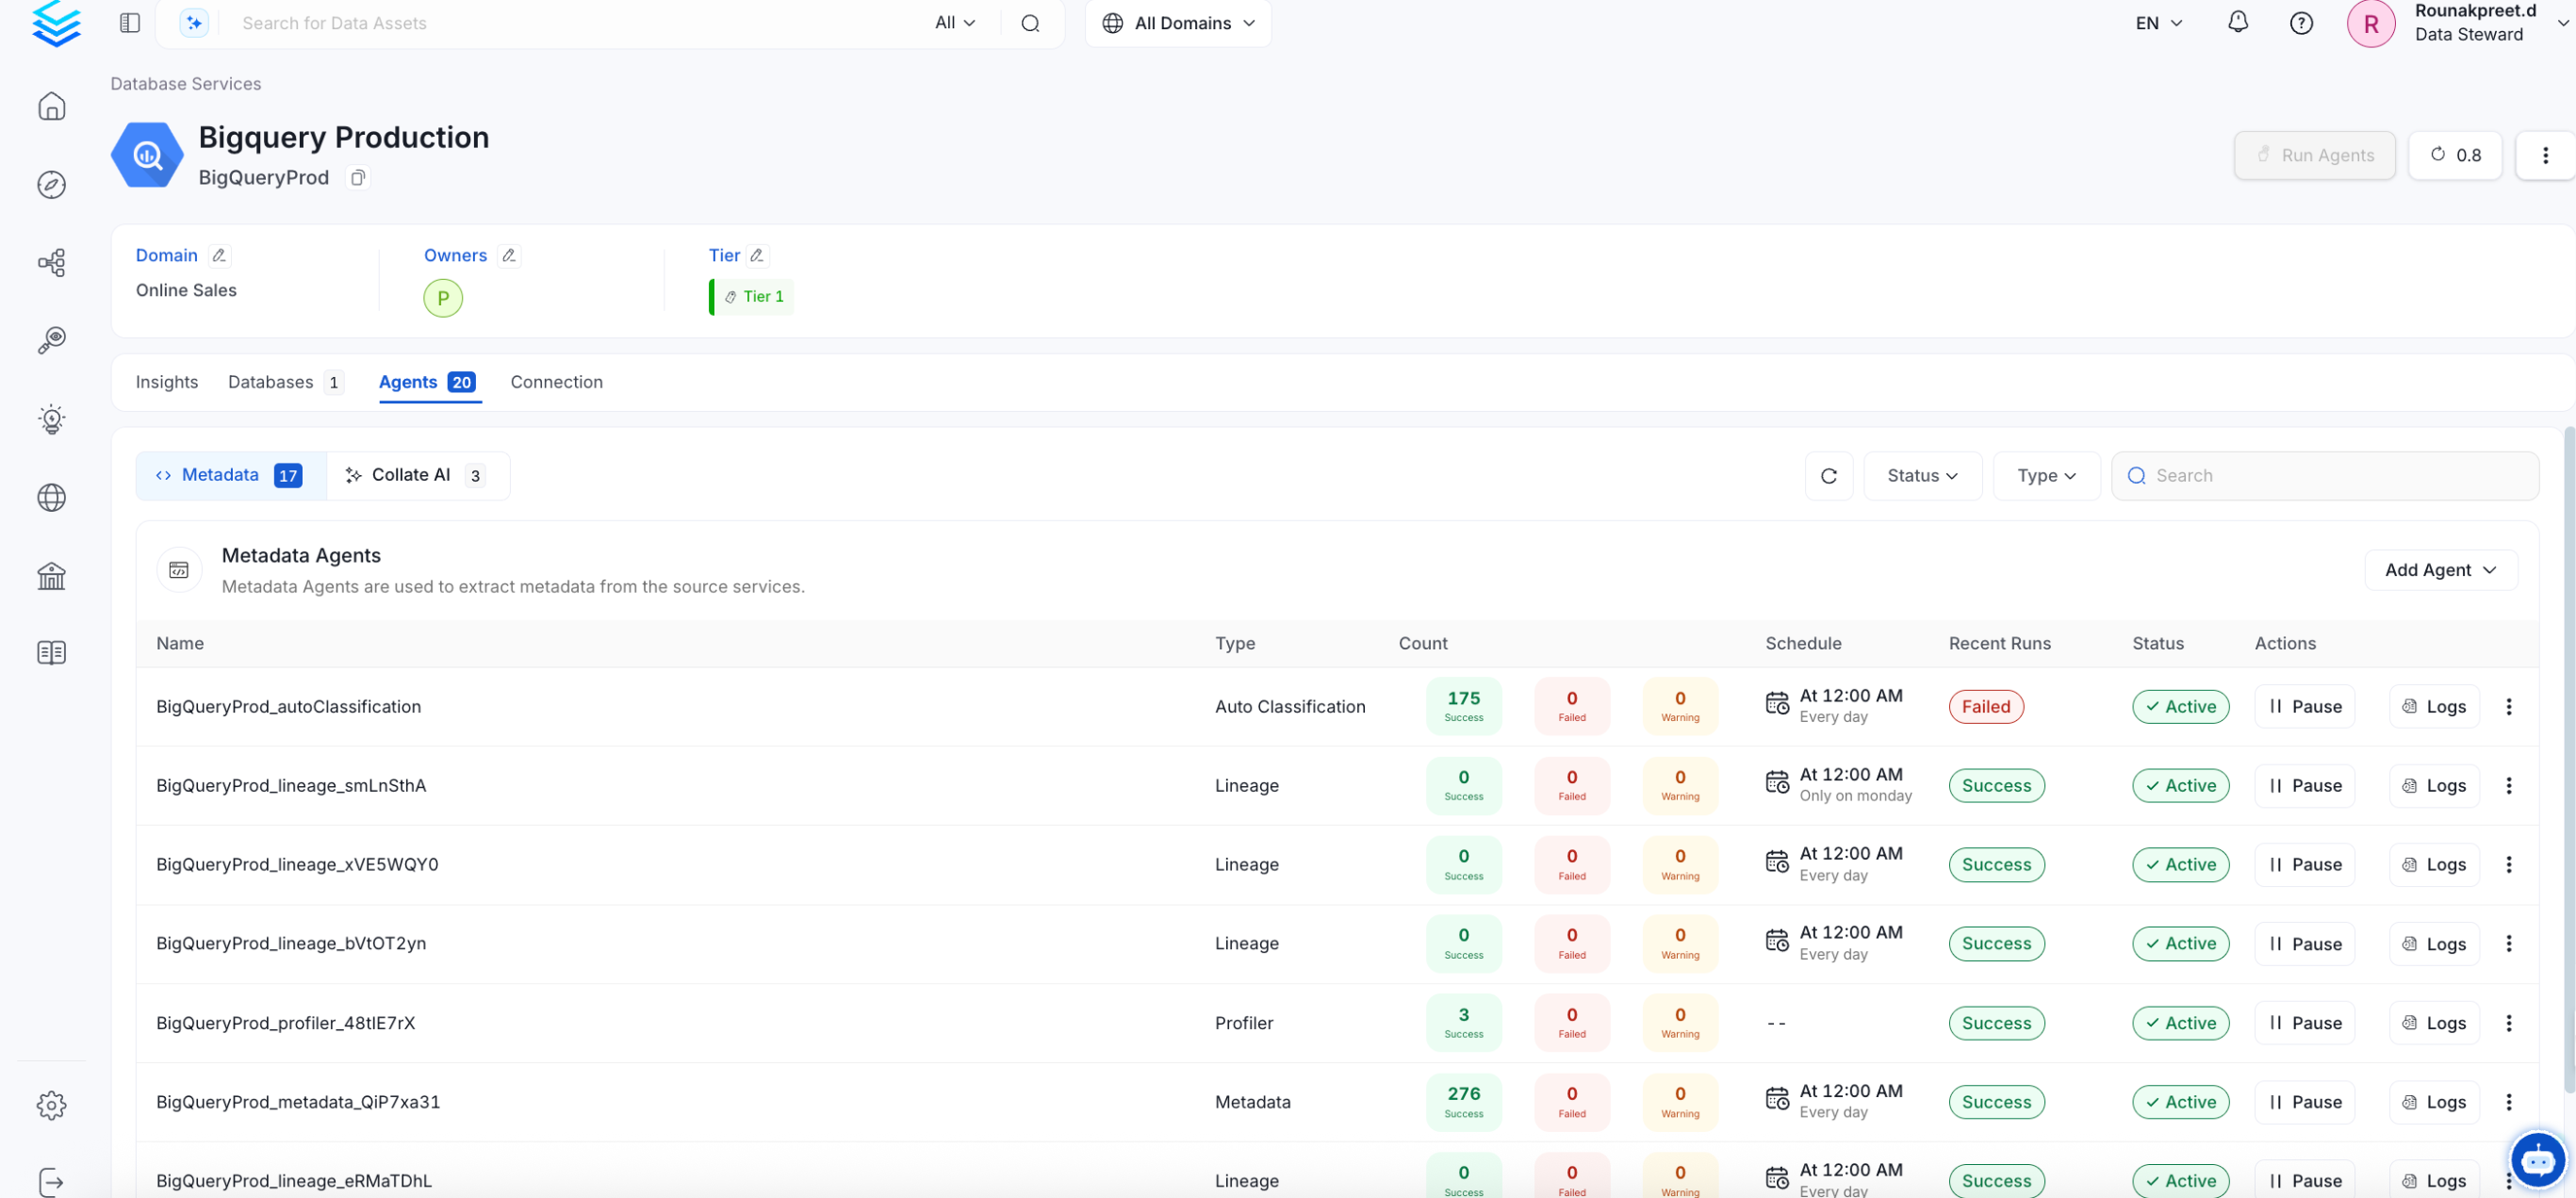
Lineage
Lineage in Collate shows you which database tables power each dashboard. When lineage is set up, you can trace any dashboard back to the exact source tables in your database. There is no separate lineage agent or lineage pipeline—lineage is collected as part of the same metadata ingestion workflow. Configuring the Db Service Prefixes field (covered below) is optional but recommended — it restricts table matching to specific database services. If left blank, Collate attempts to match source tables across all ingested database services.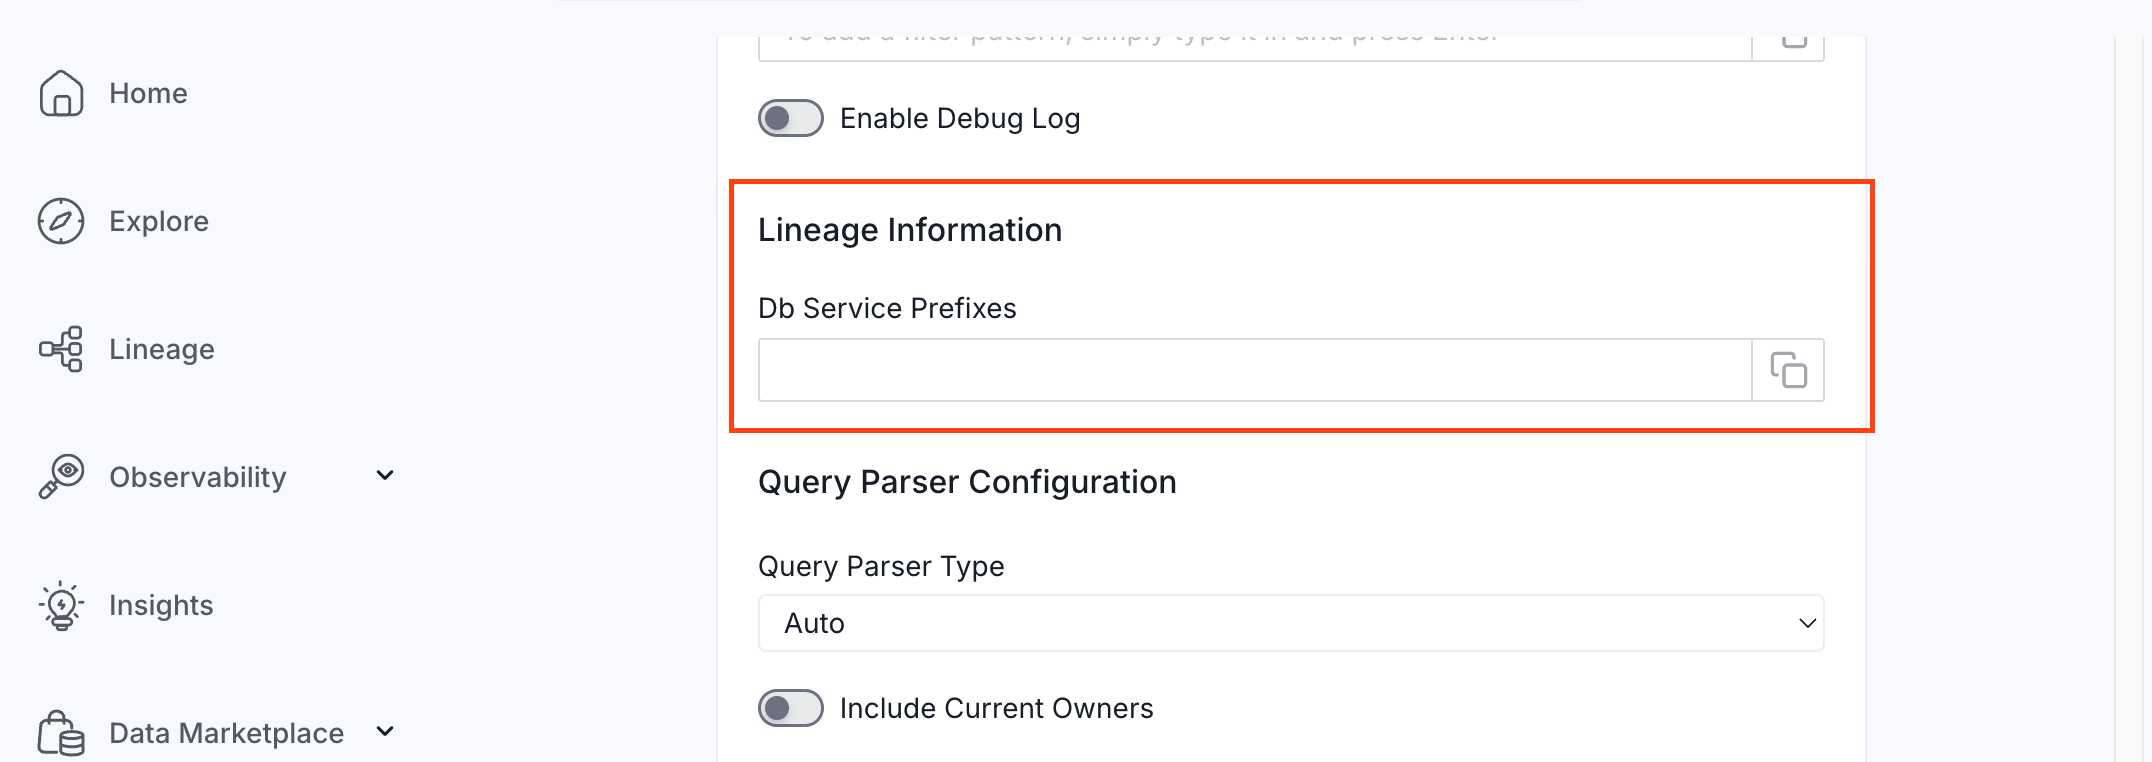
How to Set Up Lineage
- Go to Settings > Services > Dashboards.
- Click the dashboard service you’ve added.
- Go to the Agents tab, then select Add Agent > Add Metadata Agent. If a metadata agent already exists, select the three-dot context menu (⋮) next to it and select Edit.
- In the Configure Ingestion step, scroll down to the Lineage Information section.
- Optionally enter one or more database service names in the Db Service Prefixes field to restrict table matching to specific services. If left blank, Collate searches across all ingested database services.
Troubleshooting
Looker Troubleshooting
Learn more about how to troubleshoot common Looker connector issues and resolve configuration or ingestion errors.