
Requirements
Collate ingests two types of metadata from Looker:- Dashboards & Charts
- LookML Models
For the
projectmetadata being ingested: - The actual LookML Project an Explore or View is developed in.
- For Dashboards, the folder name from the UI, since there is no other hierarchy involved there.
In terms of permissions, a user with access to the Dashboards and LookML Explores to be ingested is required.
Create your API credentials by following Looker API authentication.
However, LookML Views are not present in the Looker SDK. Instead, that information must be extracted directly from
the GitHub repository holding the source
.lkmlfiles. To get this metadata, a GitHub token with read only access to the repository is required. For steps, see Creating a personal access token.
Entity Mapping
The Looker connector maps Looker assets to Collate entities as follows:Example Structure
Looker Structure:- Looker dashboards appear as Collate dashboards, organized by their Looker folder
- Dashboard tiles appear as charts underneath their dashboard
- LookML Explores and Views appear as data models, organized by their LookML project
- The project field is sourced differently depending on entity type: a Looker folder for Dashboards, a LookML project for Data Models
Metadata Ingestion
To ingest metadata from Looker, you need to create a service connection. The service connects Looker with Collate. Once you create a service, Collate automatically starts ingesting metadata.Step 1: Add New Service
Open the Services page and start a new service.-
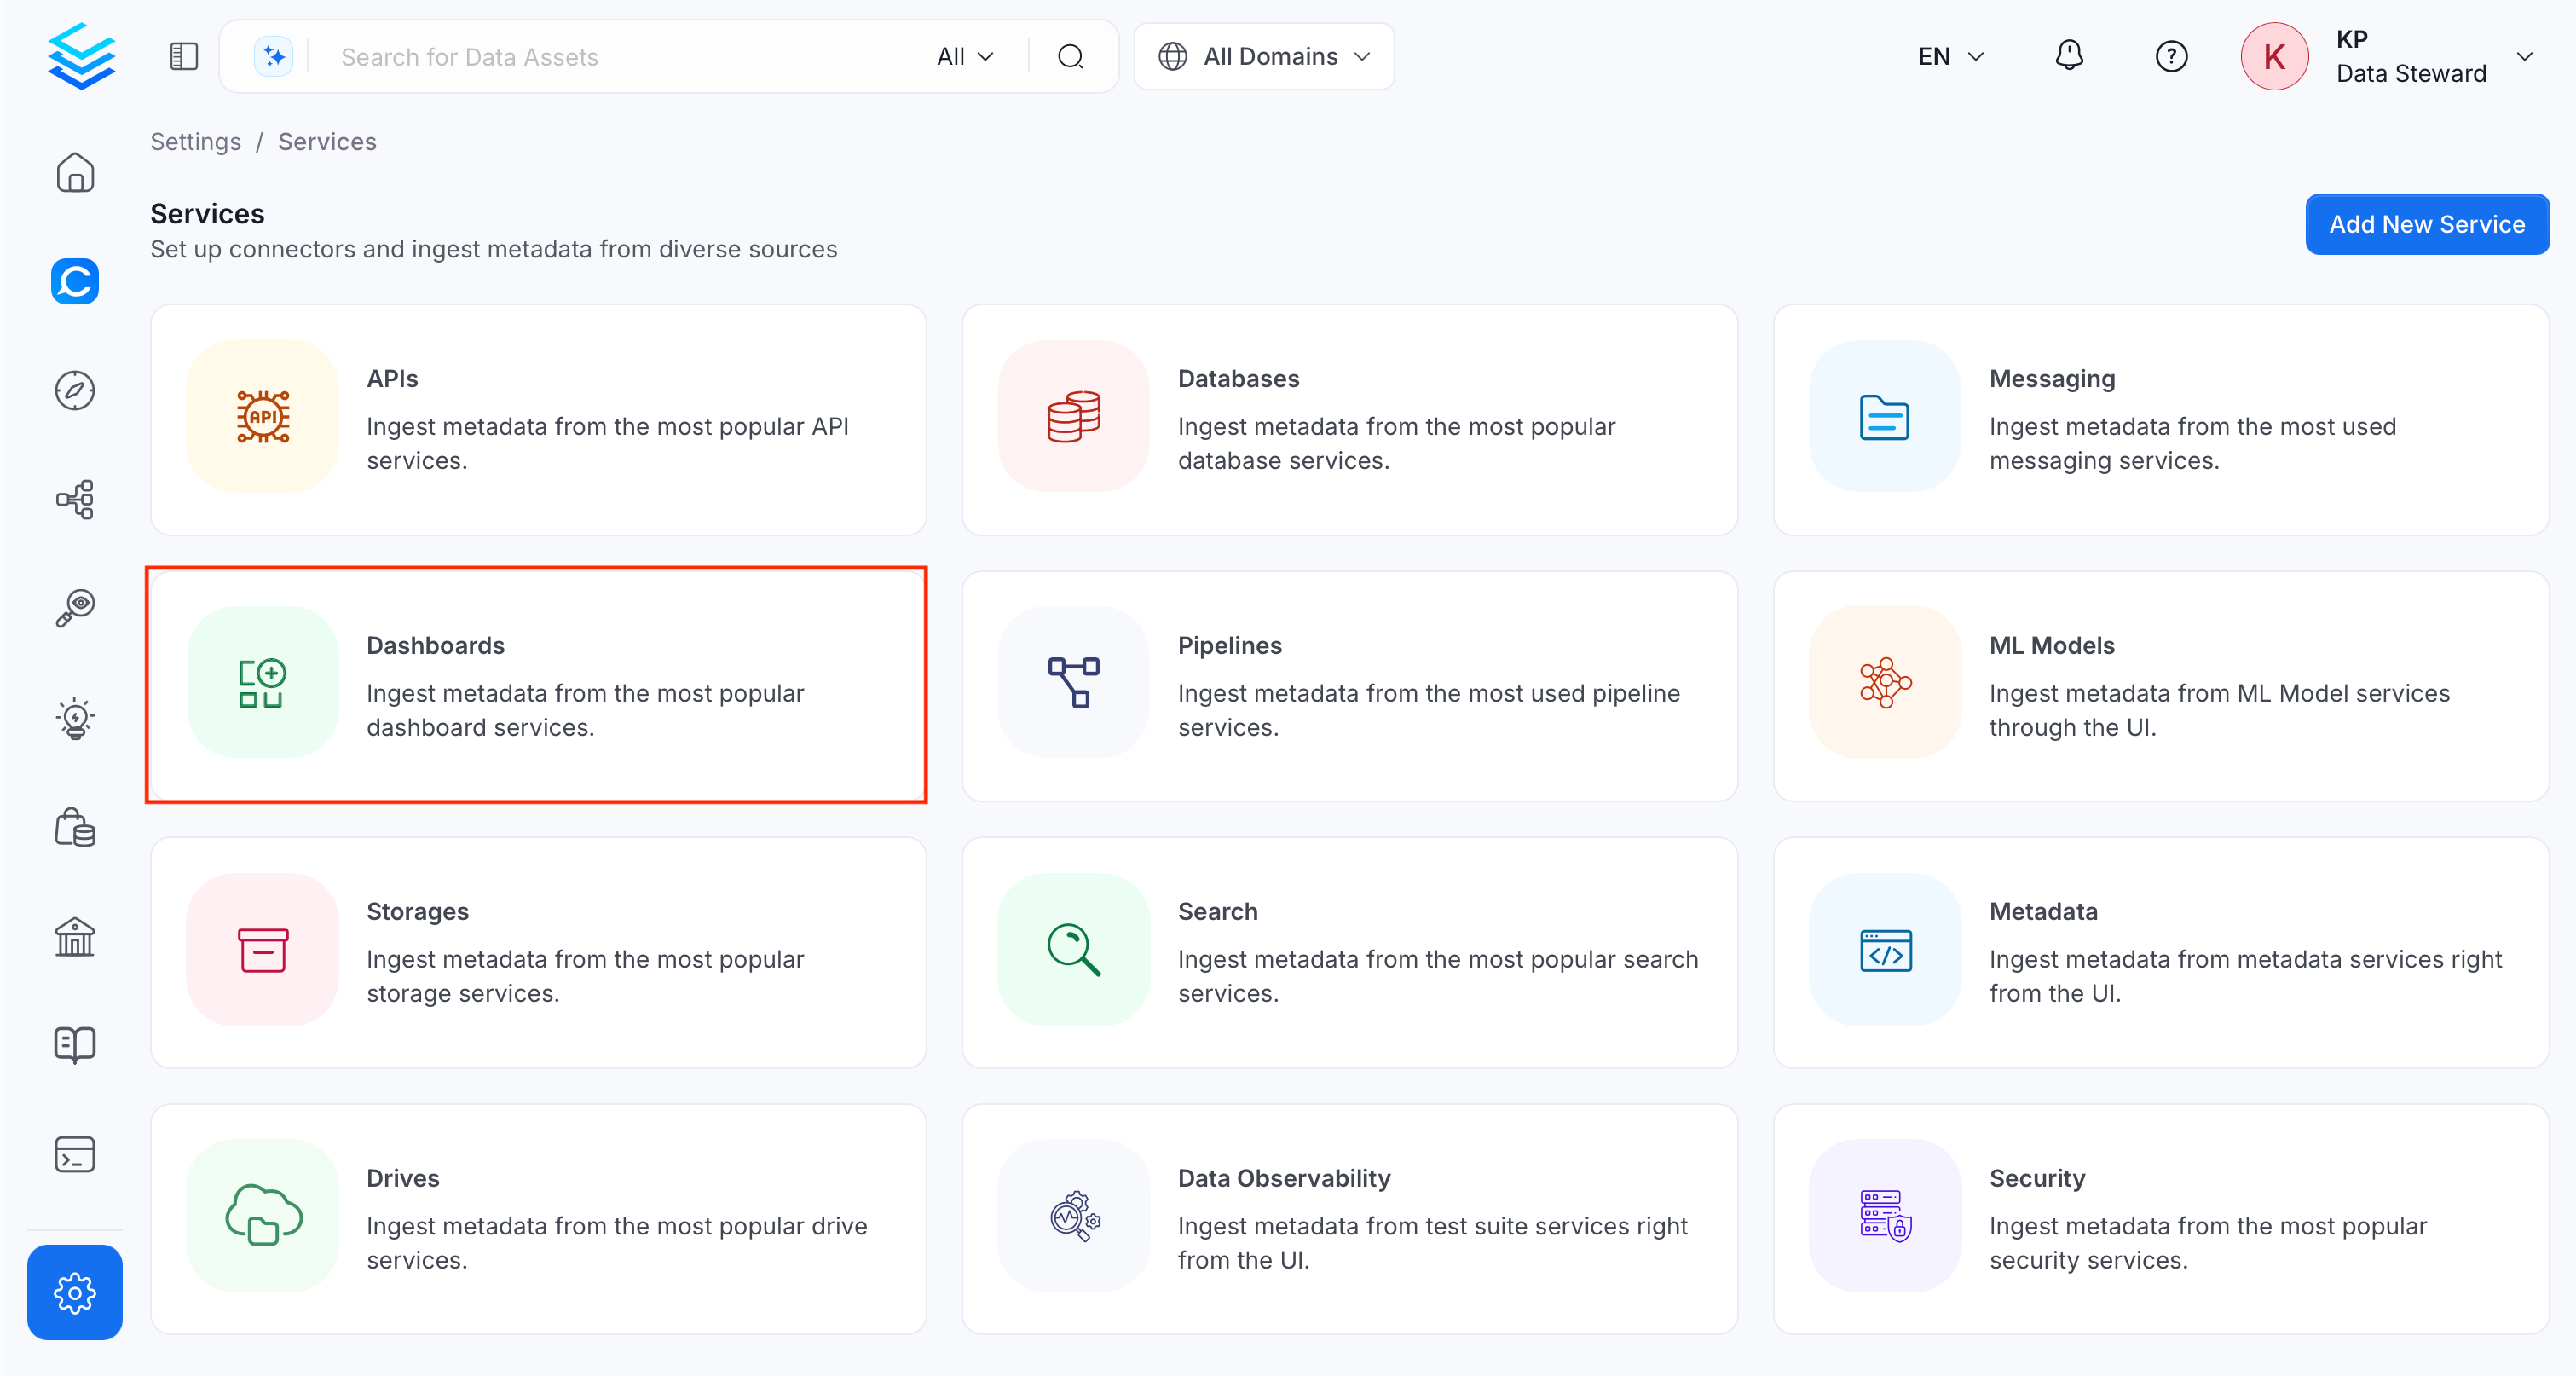
Navigate to Settings > Services and select Dashboard Services.
-
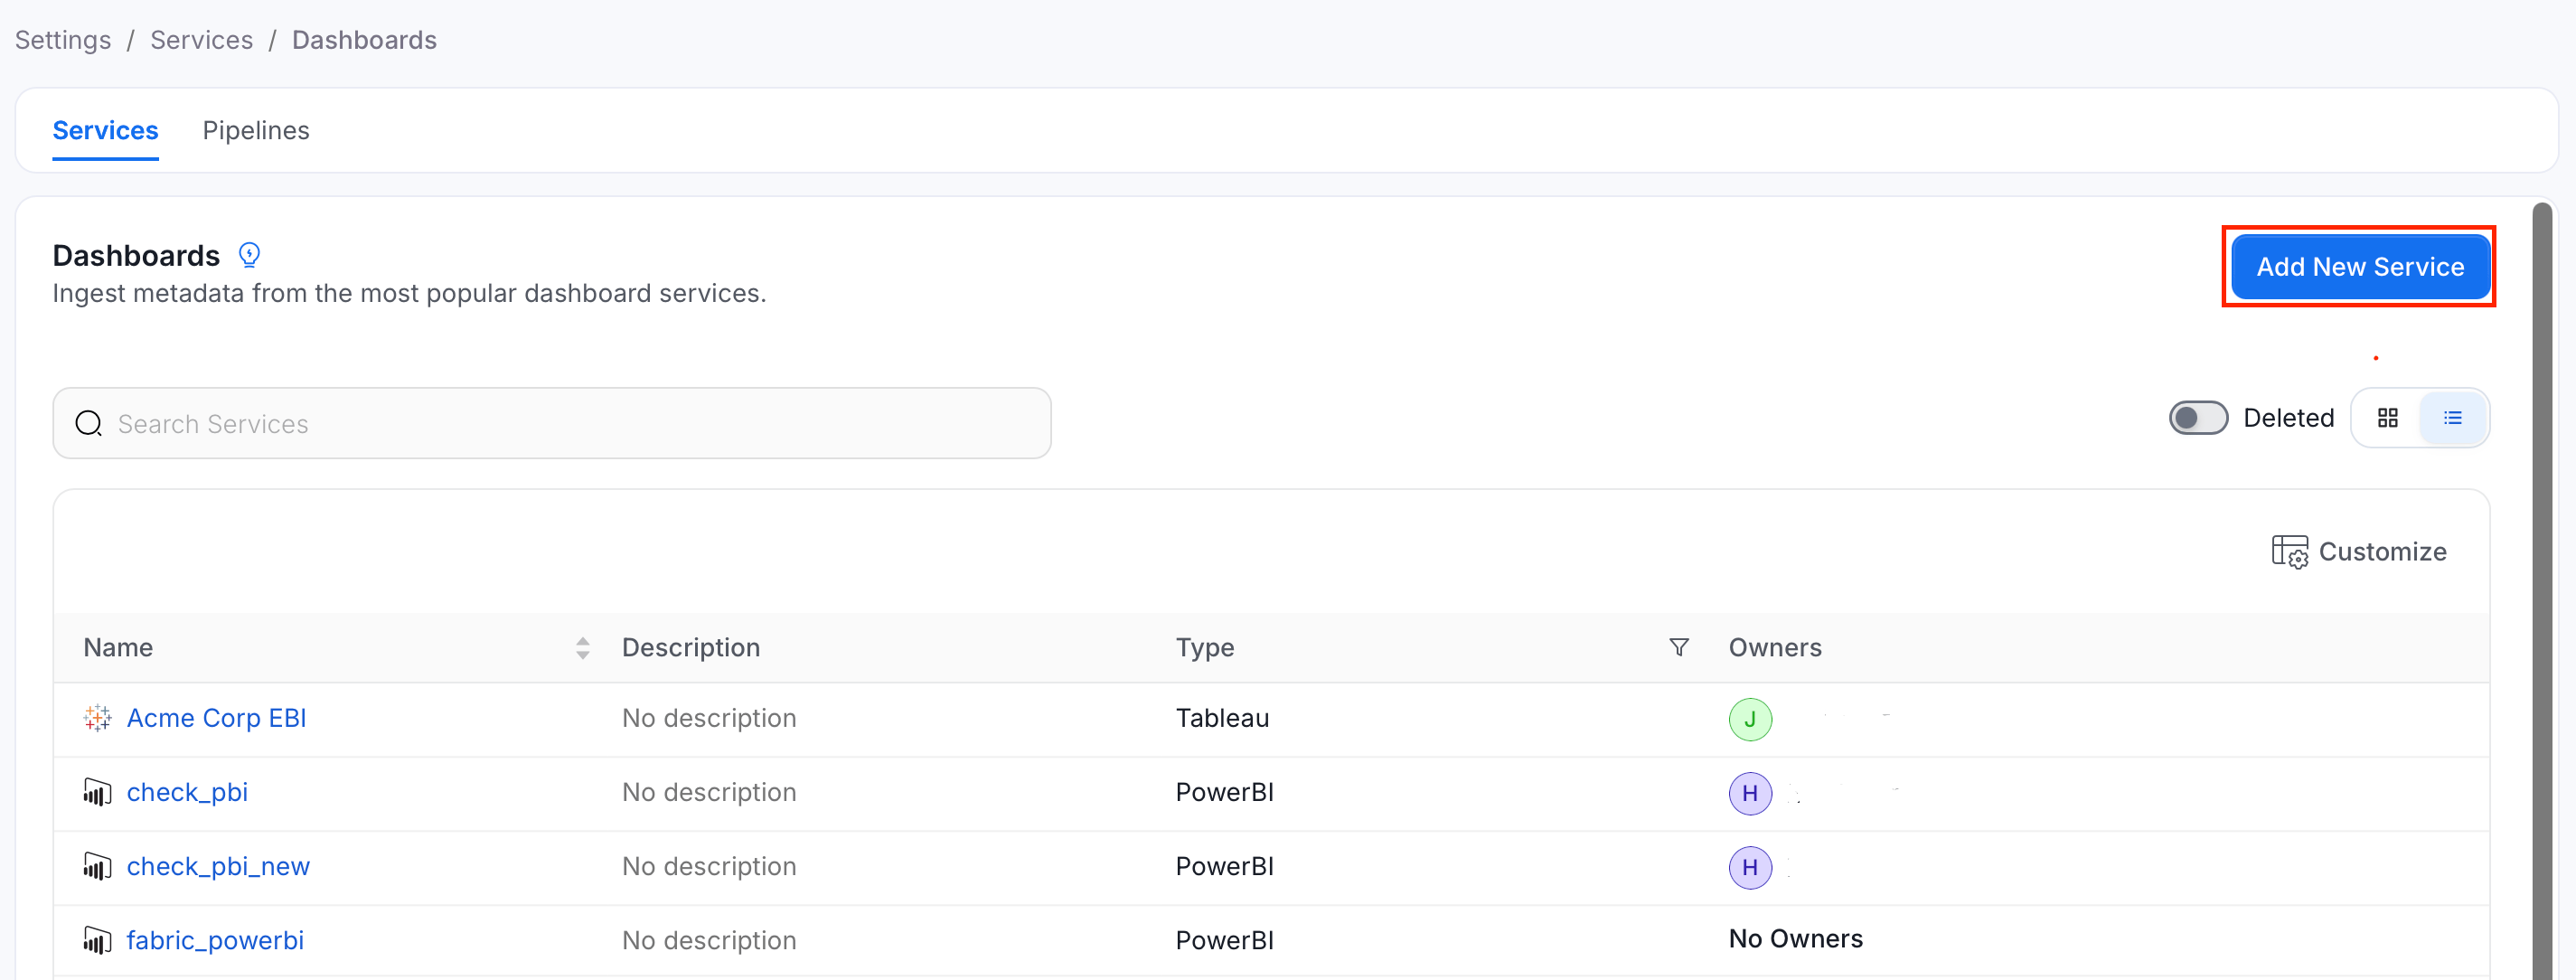
Click Add New Service.
Step 2: Select a Service and Connector
From the service type dropdown, select Dashboard Services, then click the Looker connector tile.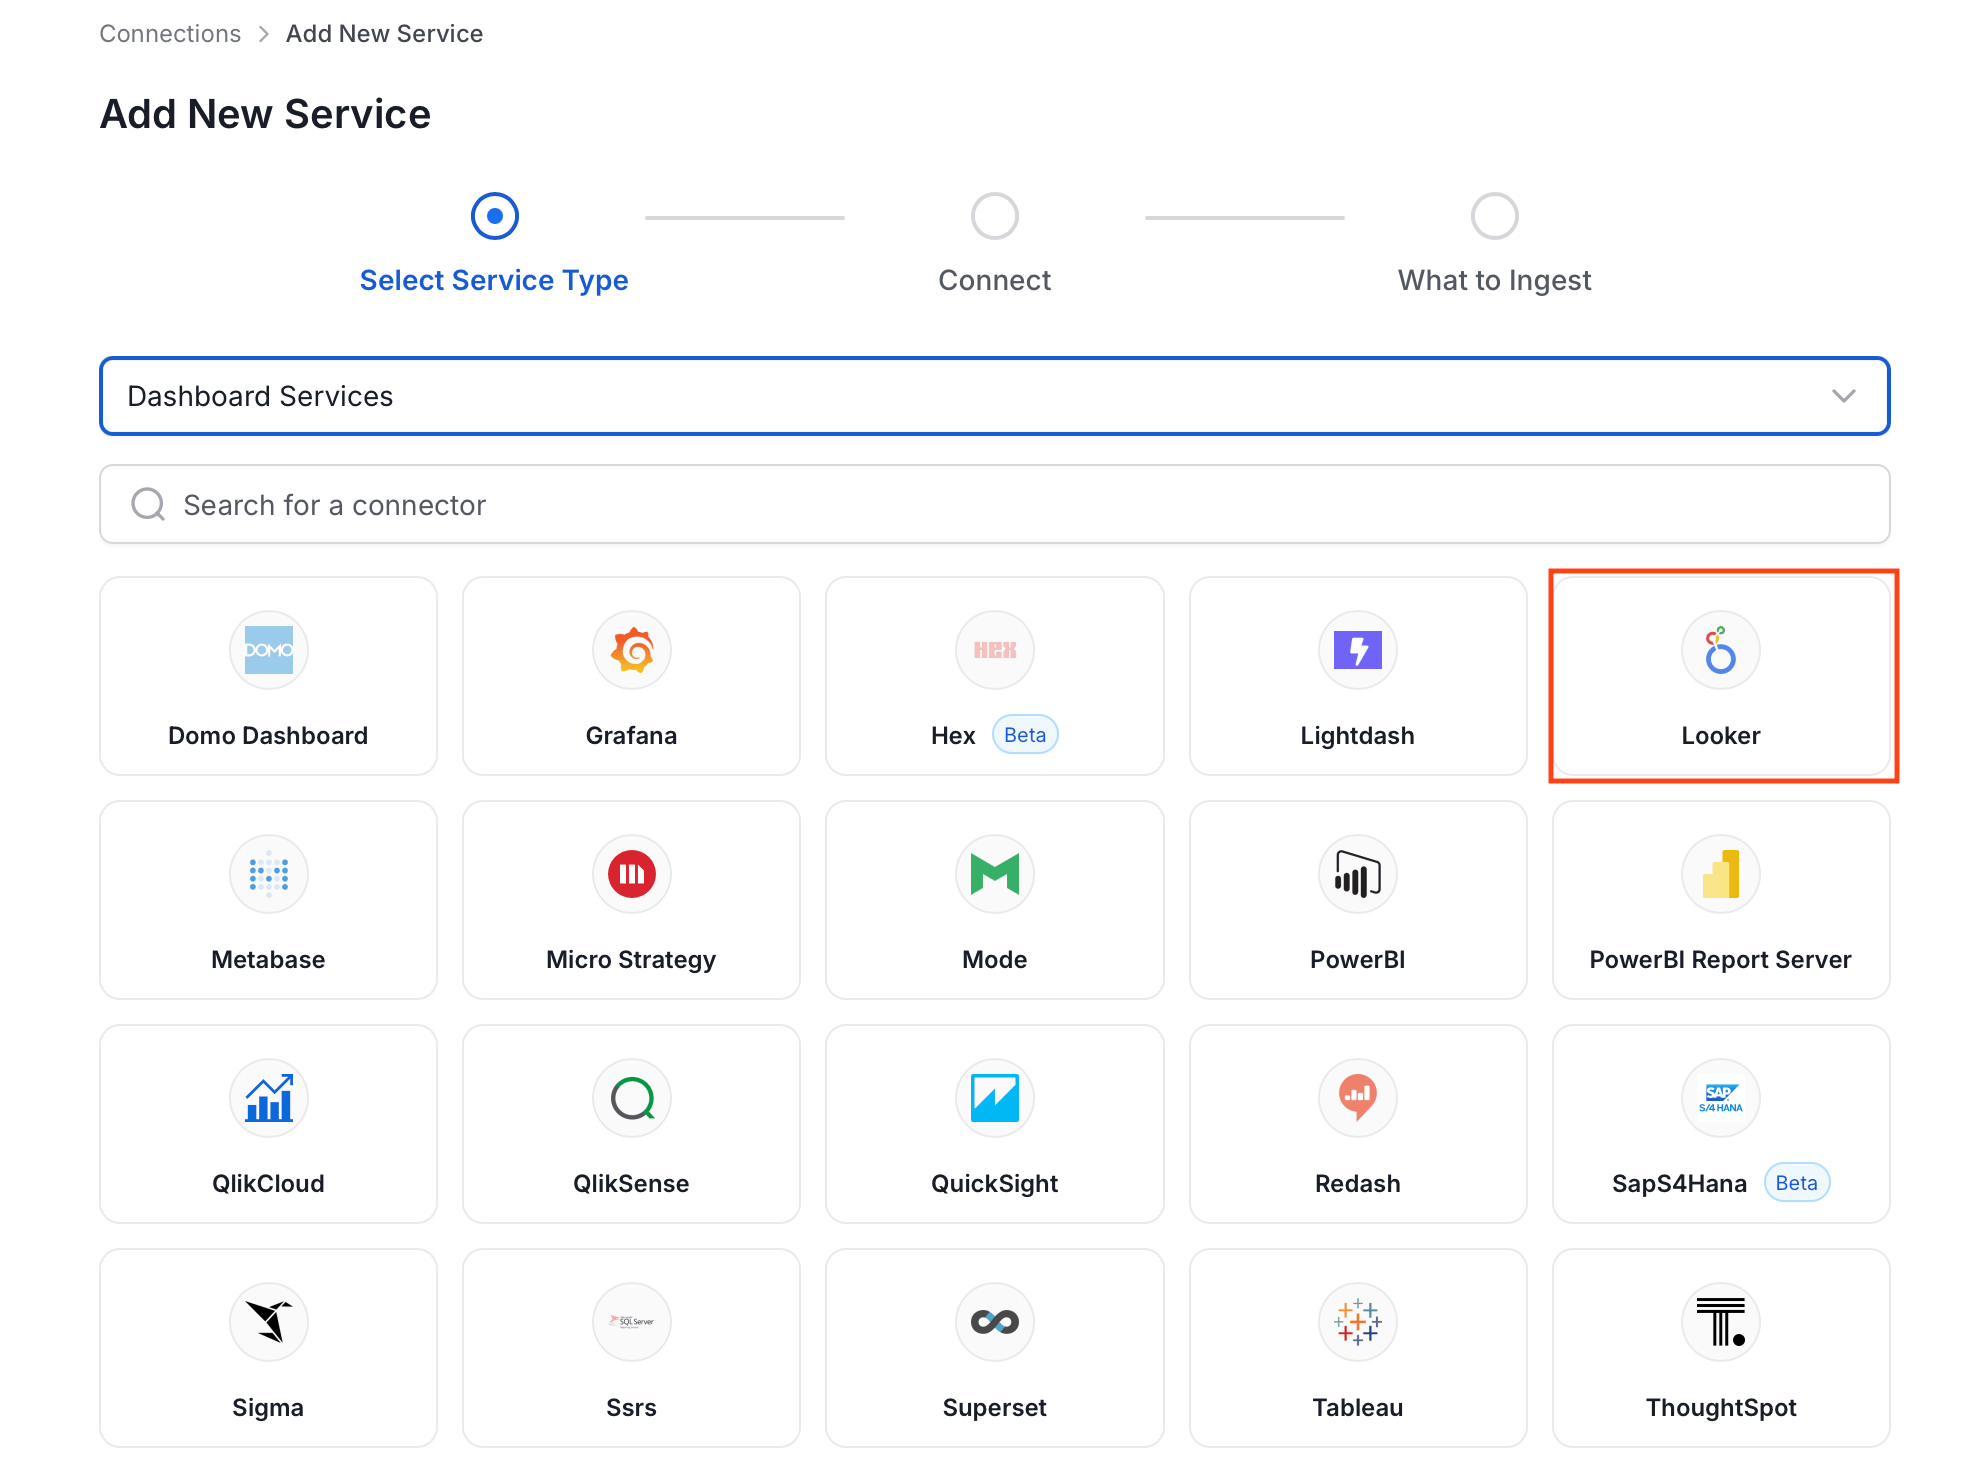
Step 3: Add Service Name and Description
- Enter a unique, descriptive Service Name. Collate identifies services by their service name. Enter a name that distinguishes this deployment from other Looker services you are ingesting metadata from.
- Optional: Enter a Description for the service.

Note: The service name can’t be changed after you set it.
Step 4: Configure Connection Options
Specify where ingestion runs, provide your source credentials, and verify the connection.Select Ingestion Runner
Select an Ingestion Runner: the runner where the ingestion pipeline will execute.
Enter Connection Details
Enter the connection details for Looker. The right-hand panel in the UI displays inline help for each field.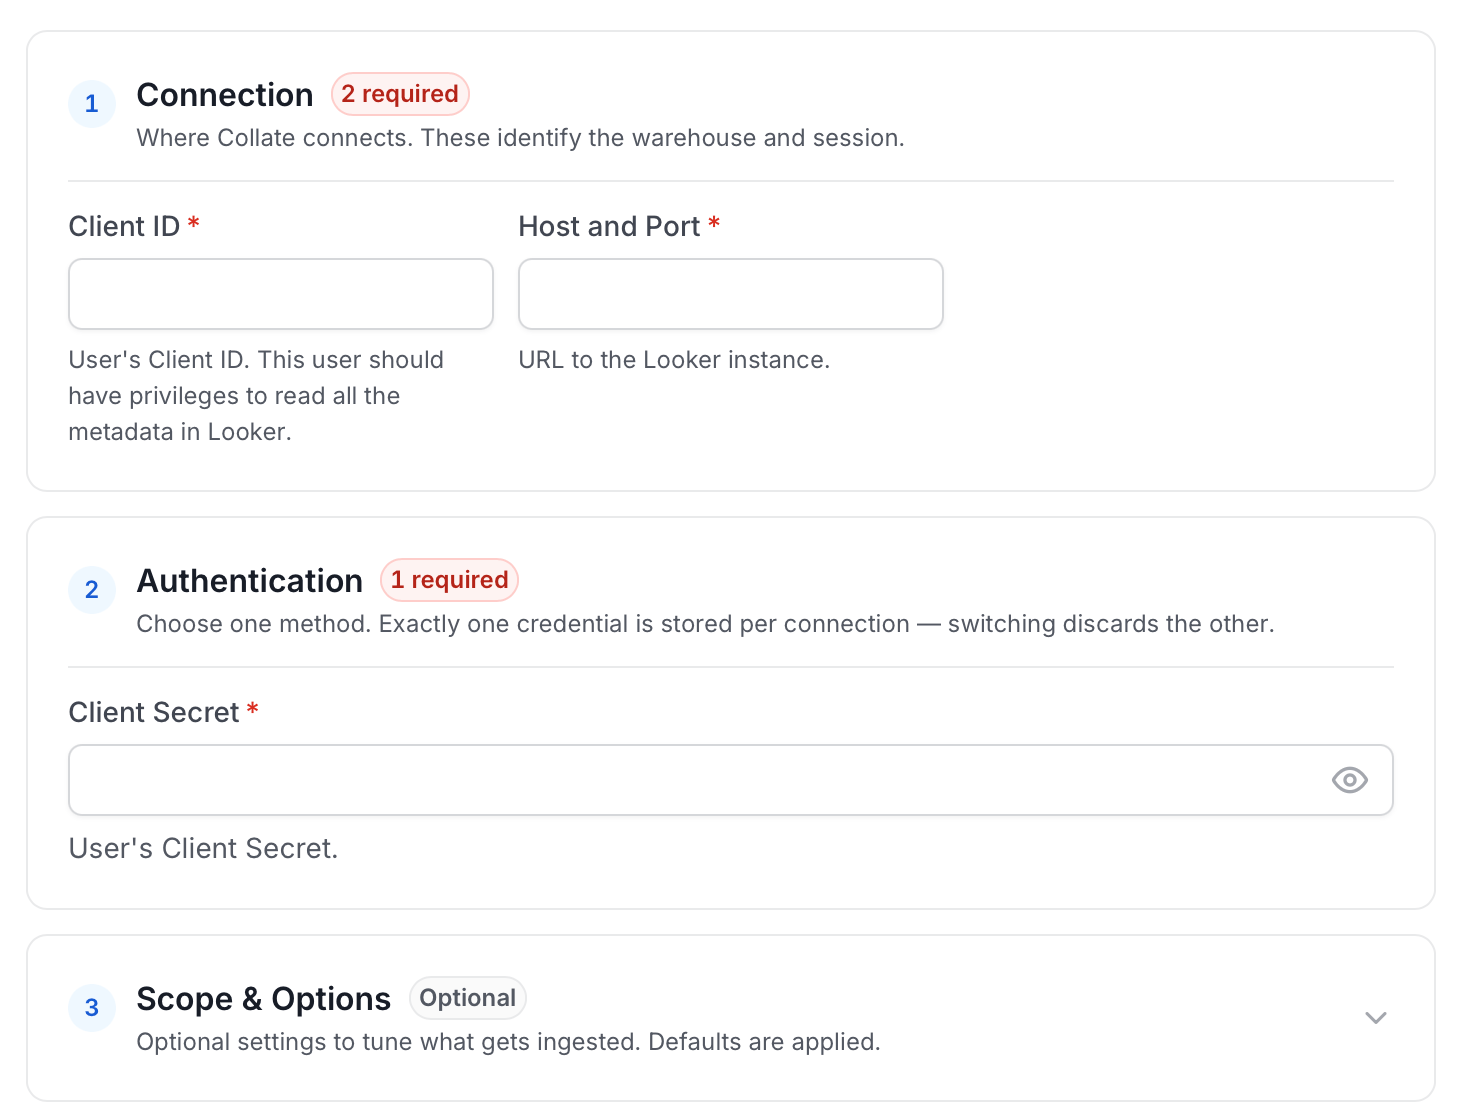
- Client ID: User’s Client ID to authenticate to the SDK. This user should have privileges to read all the metadata in Looker.
- Host and Port: URL to the Looker instance, for example,
https://my-company.region.looker.com.
- Client Secret: User’s Client Secret for the same ID provided.
- Git Credentials: Choose how to extract the
.lkmlfiles that hold your LookML views and their lineage to source tables:- No Git Credentials: Default option. Skips LookML view ingestion and lineage to source tables.
-
Local Path: Path to the repository on the local file system where the ingestion pipeline runs, for example
/opt/looker/repo. -
GitHub Credentials: Credentials for a GitHub repository.
- Git Host URL: GitHub instance URL. For GitHub.com, use
https://github.com. - Repository Owner: The owner (user or organization) of a GitHub repository. For example, in https://github.com/open-metadata/OpenMetadata, the owner is
open-metadata. - Repository Name: The name of a GitHub repository. For example, in https://github.com/open-metadata/OpenMetadata, the name is
OpenMetadata. To ingest LookML files from multiple repositories under the same owner, provide a comma-separated list, for examplelooker-main-repo,looker-secondary-repo,looker-analytics-repo. - API Token: Token to use the API. This is required for private repositories and to avoid hitting API rate limits.
Only select repositoriesand choose the one containing your LookML files. SetRepository PermissionstoRead-onlyforContents. - Git Host URL: GitHub instance URL. For GitHub.com, use
-
BitBucket Credentials: Credentials for a BitBucket repository.
- Git Host URL: BitBucket instance URL. For BitBucket Cloud, use
https://bitbucket.org. - Repository Owner: The owner (user or organization) of the repository.
- Repository Name: The name of the repository. To ingest LookML files from multiple repositories under the same owner, provide a comma-separated list, for example
looker-main-repo,looker-secondary-repo,looker-analytics-repo. - API Token: Token to use the API. This is required for private repositories and to avoid hitting API rate limits.
- Main Branch: Main production branch of the repository, for example
main. This field is required.
- Git Host URL: BitBucket instance URL. For BitBucket Cloud, use
-
GitLab Credentials: Credentials for a GitLab repository.
- Git Host URL: GitLab instance URL. For GitLab.com, use
https://gitlab.com. - Repository Owner: The owner (user or organization) of the repository.
- Repository Name: The name of the repository. To ingest LookML files from multiple repositories under the same owner, provide a comma-separated list, for example
looker-main-repo,looker-secondary-repo,looker-analytics-repo. - API Token: Token to use the API. This is required for private repositories and to avoid hitting API rate limits.
- Git Host URL: GitLab instance URL. For GitLab.com, use
Test Connection
- Click Test Connection to verify the credentials.
- After the test succeeds, click Save.

Step 5: Configure Ingestion Options
In the What to Ingest step, use filter patterns to control which assets Collate ingests from your dashboard service. Filter rules match asset names using the following match types.How Filter Patterns Work
- Include: Add one or more comma-separated values. Each value uses one of the following match types. Collate ingests only assets whose names match at least one rule. Leave blank to include all assets.
- Exclude: Add one or more comma-separated values. Each value uses one of the following match types. Collate skips any asset whose name matches a rule. Leave blank to exclude nothing.
- contains: matches any name containing the value. For example,
salesmatchesmy_sales_dataandsales_2024. - starts with: matches names beginning with the value. For example,
prod_matchesprod_dbandprod_schema. - ends with: matches names ending with the value. For example,
_rawmatchesevents_rawandlogs_raw. - is exactly: matches the exact name only. For example,
analyticsmatches onlyanalytics. - matches regex: matches names using a regular expression. For example,
^prod_.*_v\d+$matchesprod_events_v1.
Filter Options
The Dashboard and Chart sections each include the following filter options:- Dashboard: Controls which dashboards Collate ingests from the source.
- Chart: Controls which charts within the ingested dashboards are included.
- Scan Mode: Choose between the following scan modes:
- Scan all: Ingests every asset of that type the connector can access. This is the default.
- Only specific: Enables include rules so only assets matching at least one rule are ingested.
- Exclude system toggle: Use this toggle to filter out system-reserved names defined by the connector for that asset type.
- Always exclude: Add permanent exclusion rules (shown in red). Assets matching these rules are never ingested, regardless of include rules.
- Preview: Shows a real-time summary of what will be in scope based on your current rules.
- Include rules: In Only specific mode, click + Add to define a rule. Added rules appear as chips. An asset is included if it matches any rule.
Step 6: Create & Deploy
Click Create & Deploy to deploy the agent and start the first metadata ingestion run. Collate saves the service configuration and immediately begins pulling metadata from the source. To monitor ingestion progress or view the service you just added, go to Settings > Services and select your service.Configure Metadata Agent and Schedule Ingestion
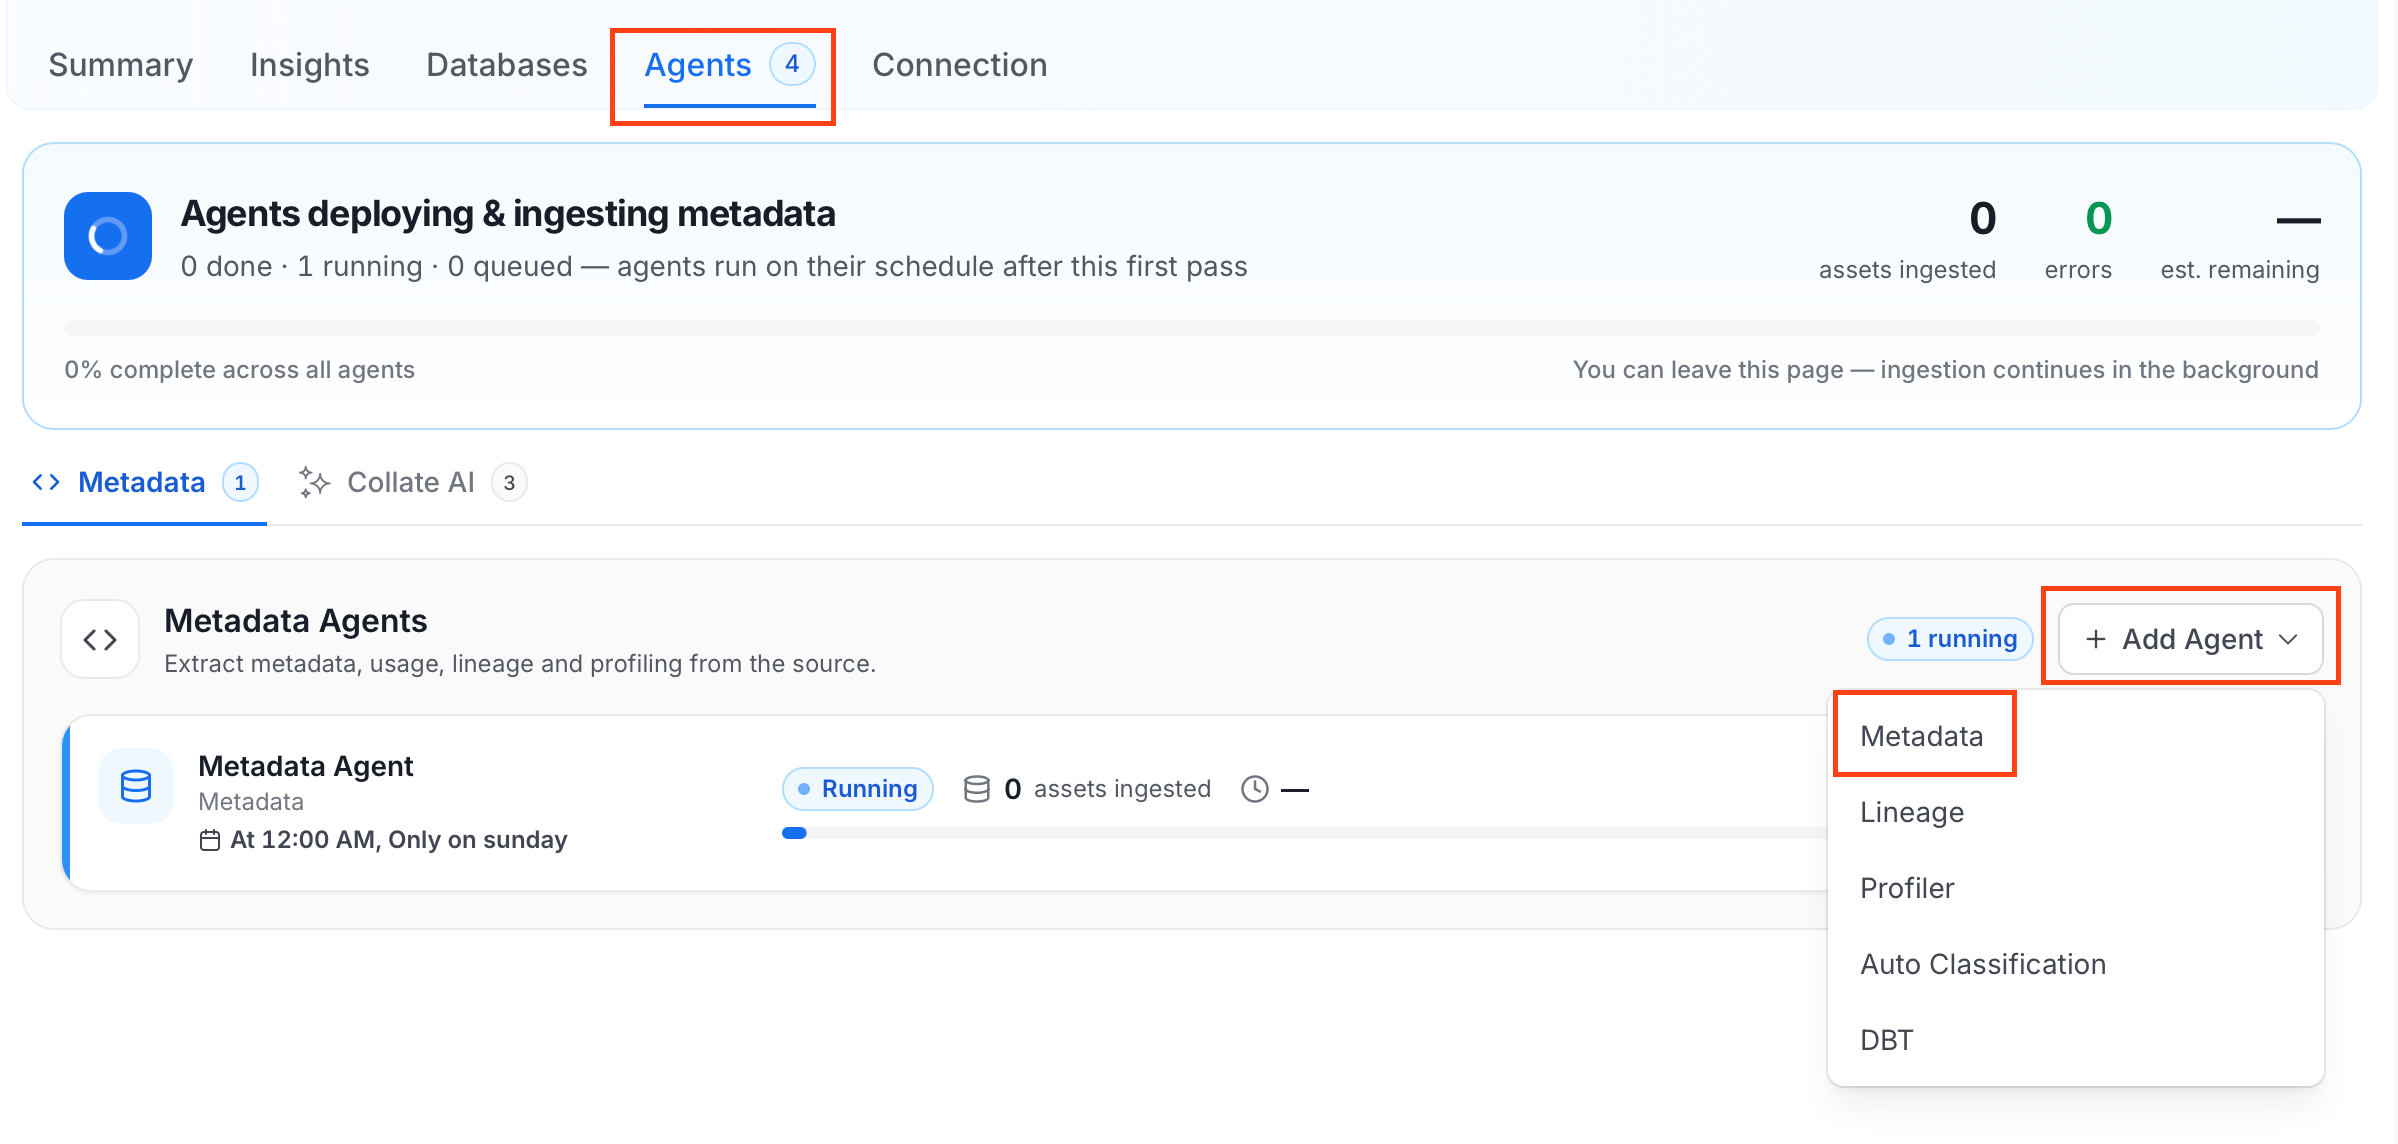
The Metadata Agent extracts dashboards, charts, data models, and other structural metadata from your source and keeps your Collate catalog in sync. It powers discovery, lineage, and governance across your data assets. When you click Create & Deploy, Collate automatically deploys a Metadata Agent for this service and triggers the first ingestion run. View its status and run history from the Agents tab on the service detail page. To configure the additional Metadata Agent and schedule ingestion, follow these steps:- Navigate to Settings > Services and select the Dashboards service.
- Select your service and click the Agents tab.
-
Click Add Agent and select Metadata from the dropdown.
-
On the Configure Ingestion page, do the following and click Next.
-
Name this Ingestion: Enter a unique, recognizable name for this ingestion pipeline.

-
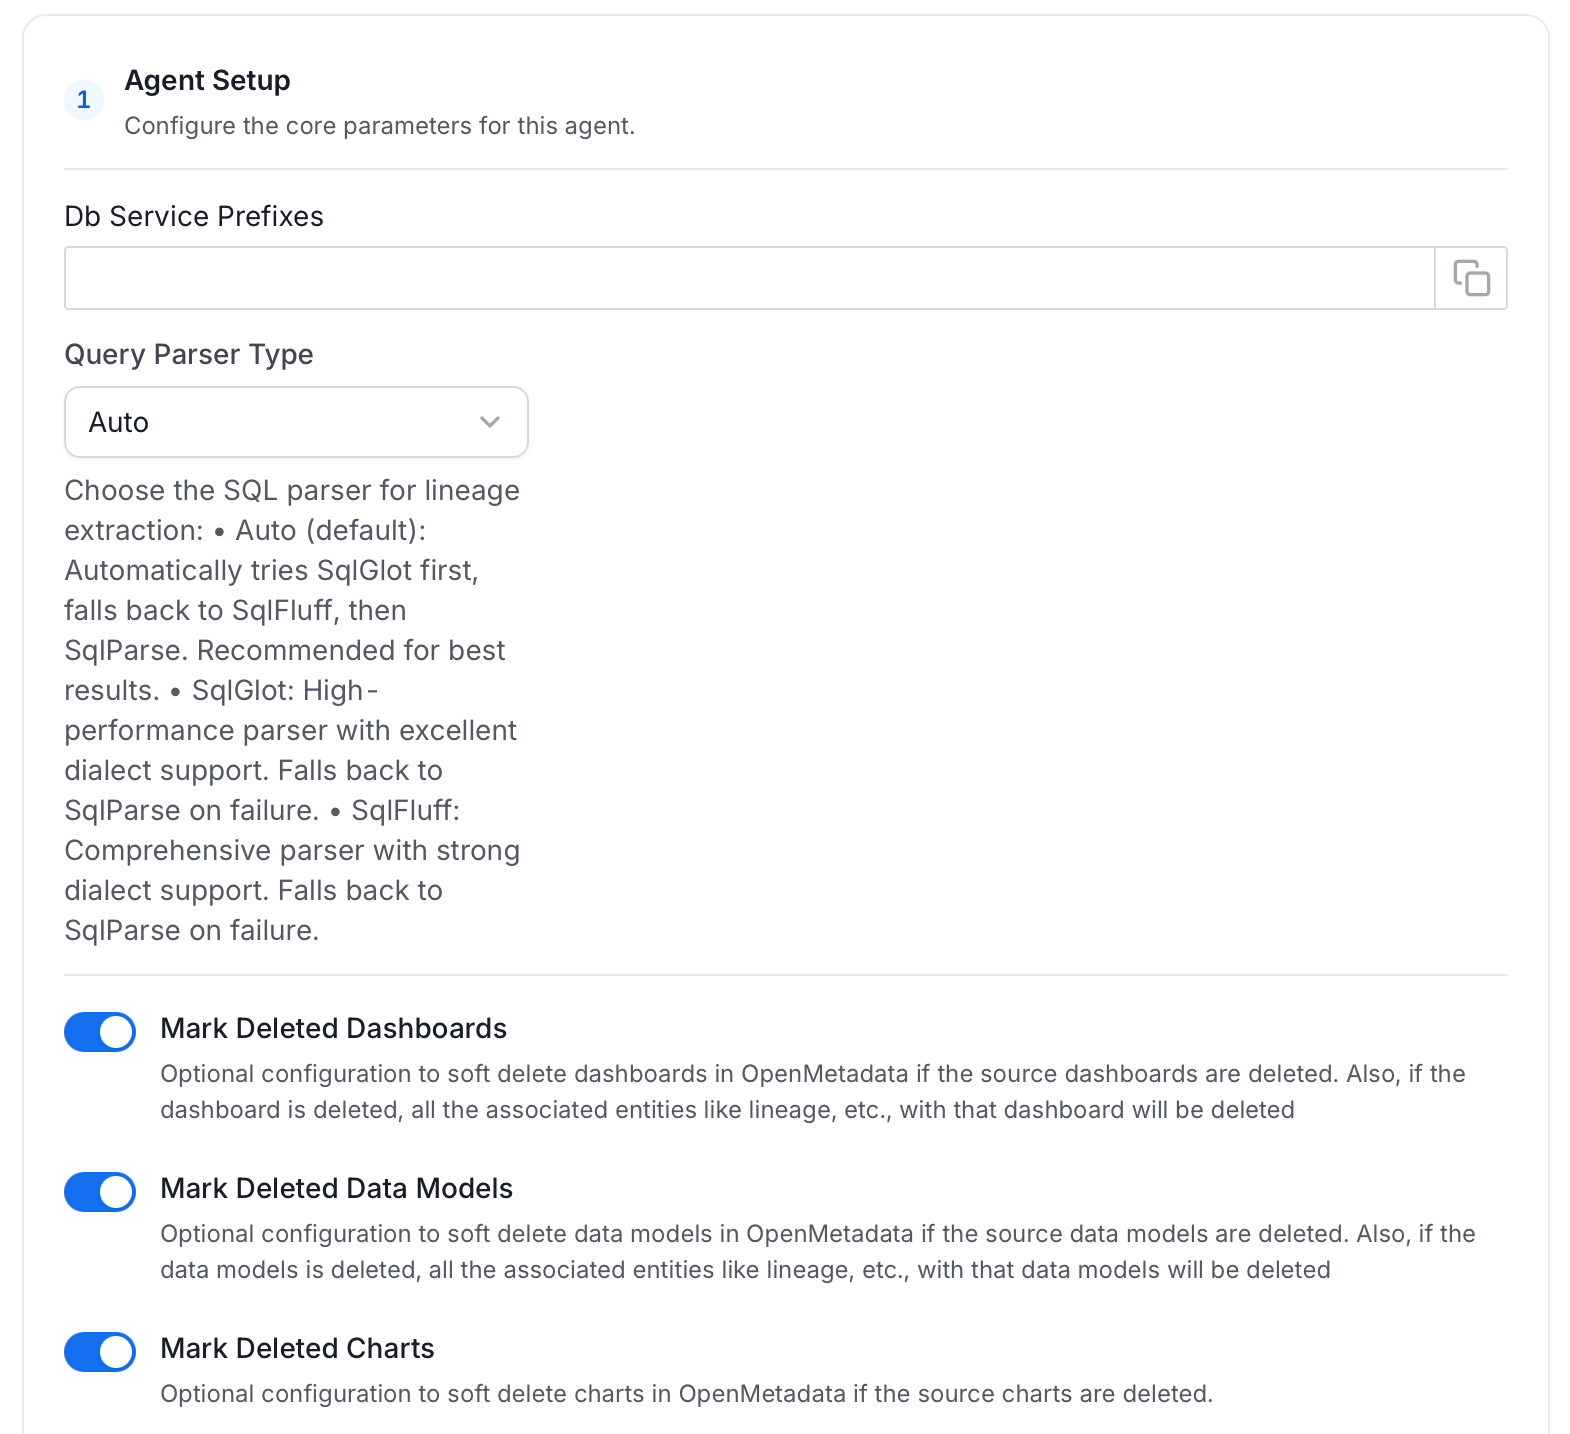
Agent Setup: Configure ingestion parameters. The following fields are available:
-
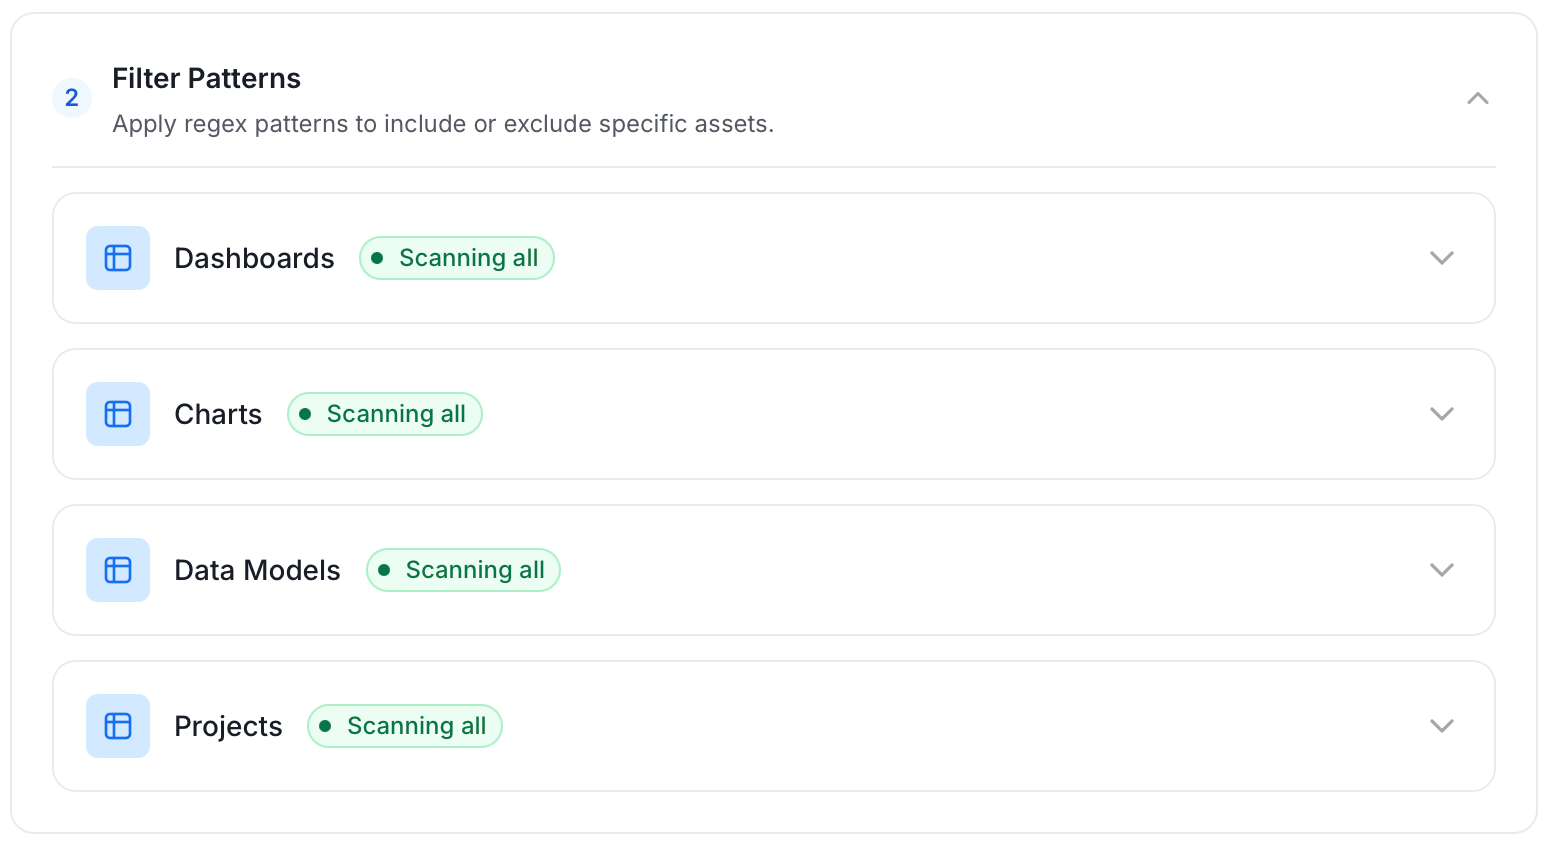
Filter Patterns: Apply include or exclude rules to scope which dashboards, charts, data models, and projects this agent ingests. These follow the same filter options described in Step 5.
-
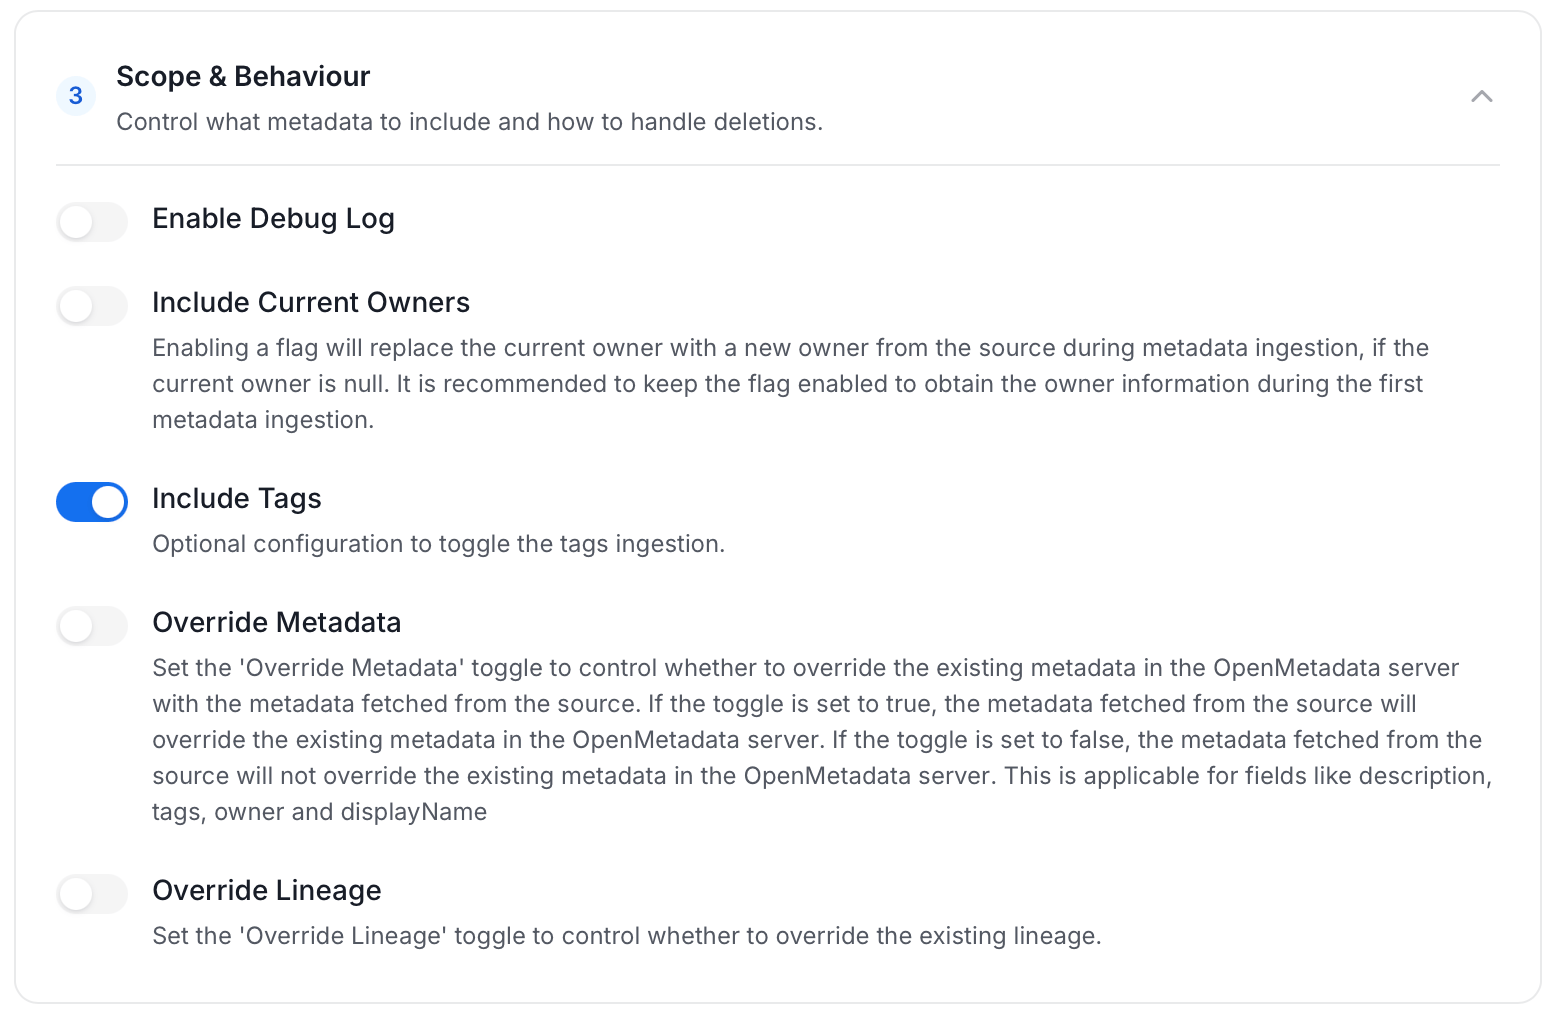
Scope & Behaviour: Control what metadata to include and how to handle deletions. Toggle each option on or off based on your needs:
-
Name this Ingestion: Enter a unique, recognizable name for this ingestion pipeline.
-
On the Schedule Interval page, set when the agent runs:
- Schedule: Choose a preset interval (Hourly, Daily, Weekly, Monthly) or enter a custom cron expression.
- On-Demand: No automatic schedule. Trigger the agent manually when needed.
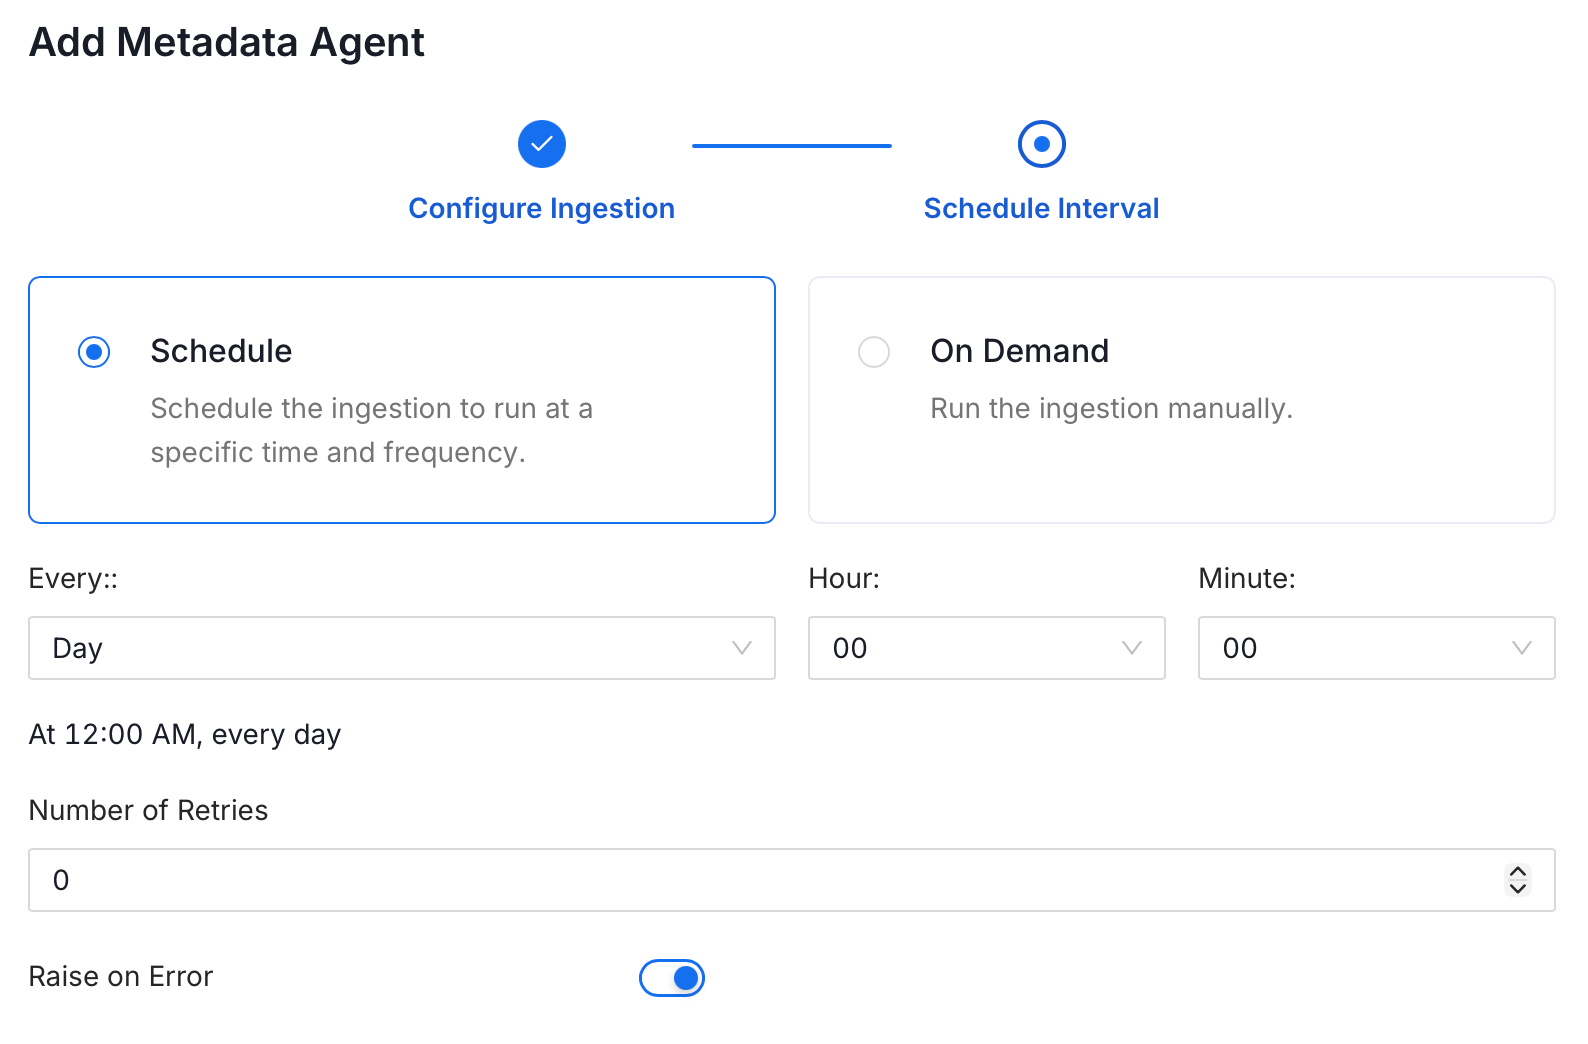
- Click Add to deploy the agent.
Lineage
Lineage
Lineage in Collate shows you which database tables power each dashboard. When lineage is set up, you can trace any dashboard back to the exact source tables in your database. There is no separate lineage agent or lineage pipeline—lineage is collected as part of the same metadata ingestion workflow. Configuring the Db Service Prefixes field (covered below) is optional but recommended — it restricts table matching to specific database services. If left blank, Collate attempts to match source tables across all ingested database services.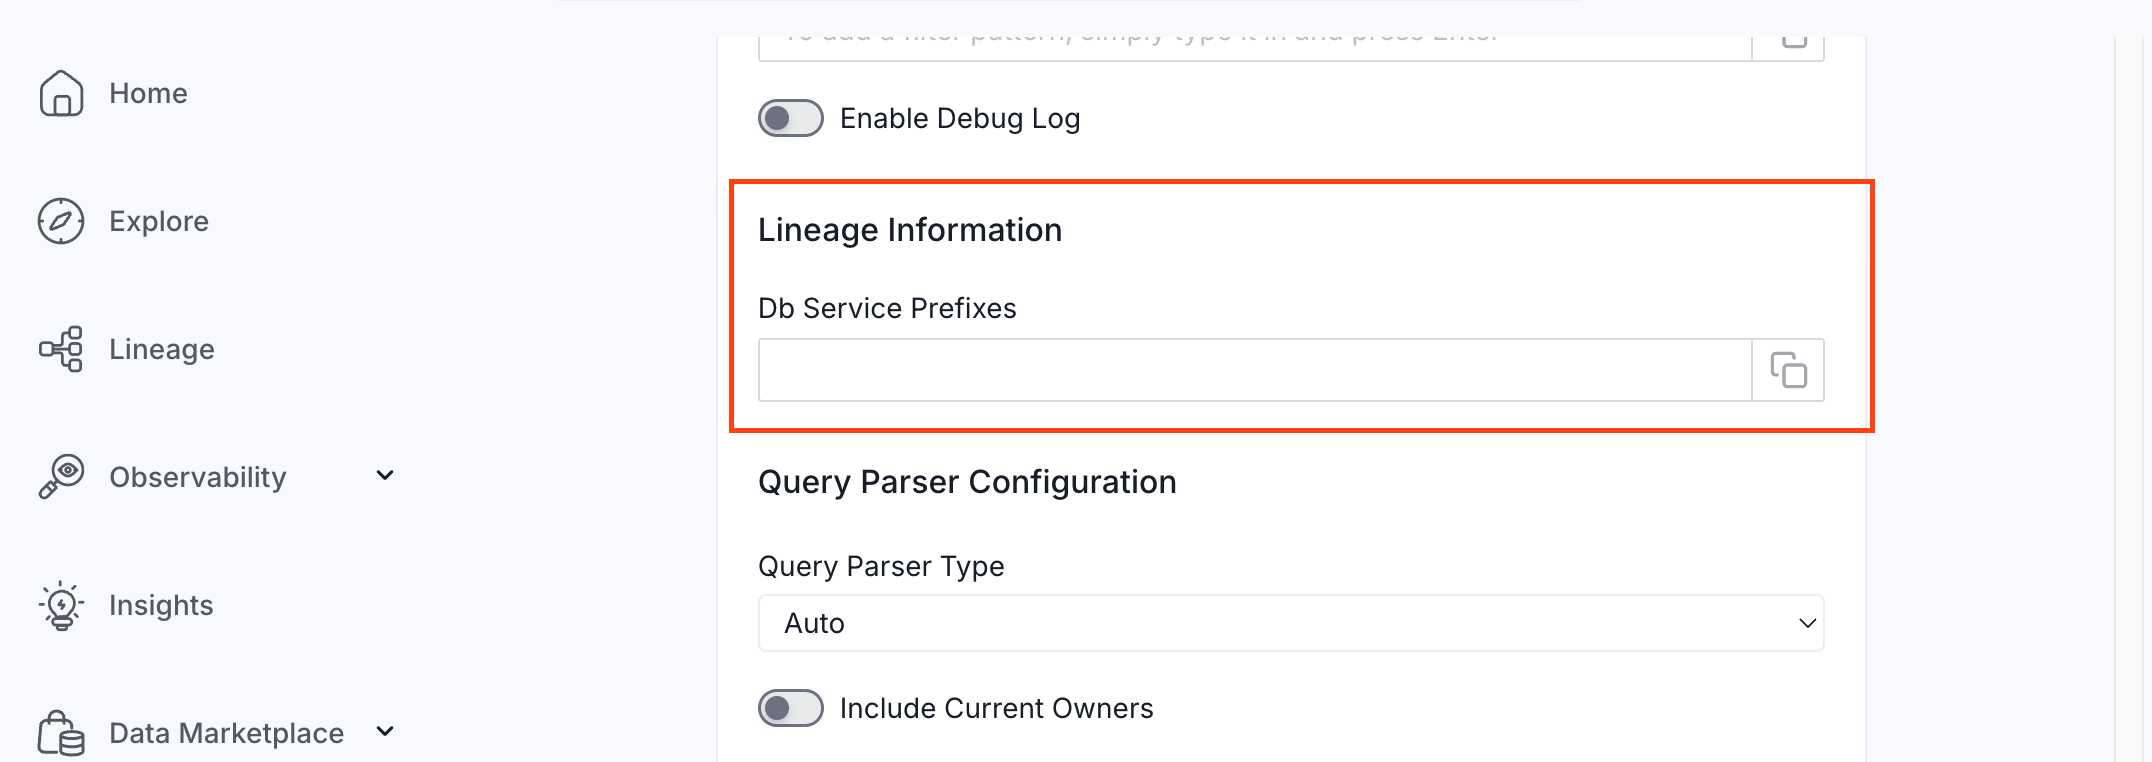
How to Set Up Lineage
- Go to Settings > Services > Dashboards.
- Click the dashboard service you’ve added.
- Go to the Agents tab, then select Add Agent > Add Metadata Agent. If a metadata agent already exists, select the three-dot context menu (⋮) next to it and select Edit.
- In the Configure Ingestion step, scroll down to the Lineage Information section.
- Optionally enter one or more database service names in the Db Service Prefixes field to restrict table matching to specific services. If left blank, Collate searches across all ingested database services.
Troubleshooting
Looker Troubleshooting
Learn more about how to troubleshoot common Looker connector issues and resolve configuration or ingestion errors.