Here you will find information about the supported metrics for the different types.A Metric is a computation that Collate can run on top of a Table or Column to receive a value back. They are the primary building block of Collate’s Profiler.
Metrics define the queries and computations generically. They do not aim at specific columns or database dialects. Instead, they are expressions built with SQLAlchemy that should run everywhere.
A Profiler is the binding between a set of metrics and the external world. The Profiler contains the Table and Session information and is in charge of executing the metrics.
On this page, you will learn all the metrics that Collate currently supports and their meaning. The namings are based on the definitions on the JSON Schemas.
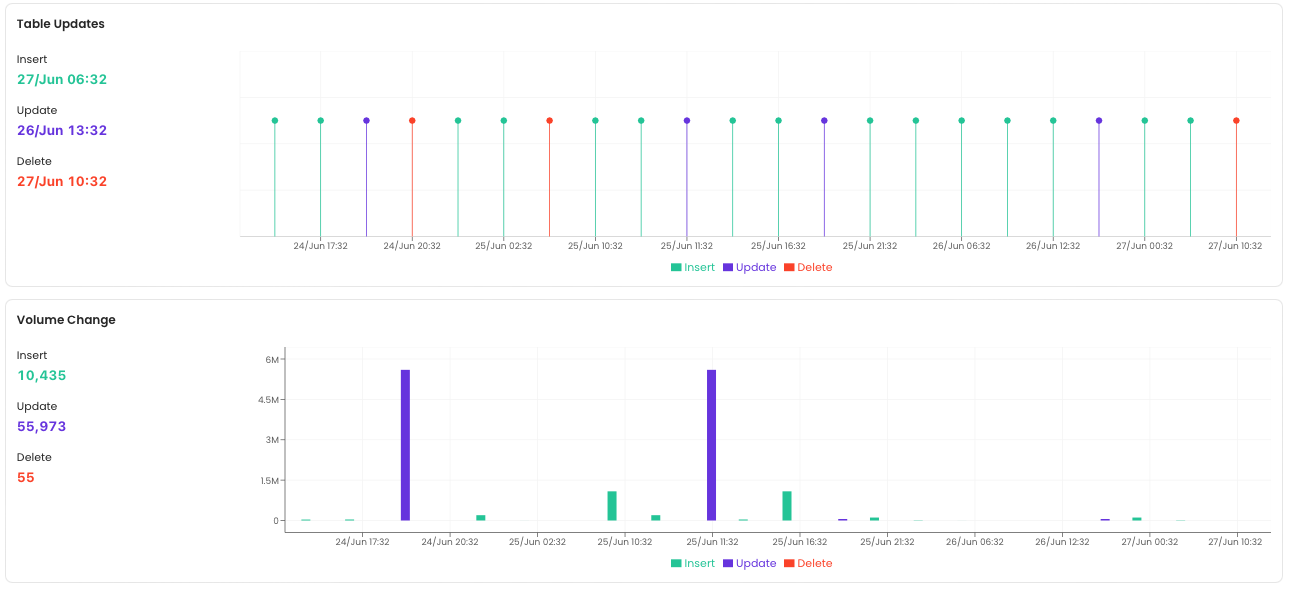
System metrics provide information related to DML operations performed on the table. These metrics present a concise view of your data freshness. In a typical data processing flow tables are updated at a certain frequency. Table freshness will be monitored by confirming a set of operations has been performed against the table. To increase trust in your data assets, Collate will monitor the INSERT, UPDATE and DELETE operations performed against your table to showcase 2 metrics related to freshness (see below for more details). With this information, you are able to see when a specific operation was last perform and how many rows it affected.These metrics are available for BigQuery, Redshift and Snowflake. Other database engines are currently not supported so the computation of the system metrics will be skipped.
The number of null values plus empty-string values in a column that can contain strings. Unlike Null Count, this also treats empty strings as missing values. The exact empty-string behavior depends on the profiler backend and column type.
Null Missing Count is not part of the default profiler metric set. In the Profiler Settings metrics picker, selecting it currently has no effect because the backend registers it as nullMissingCount but reports its result as nullCount. Use a custom profiler configuration only if you can account for that result name until the identifier is corrected.
Count in Set, Like Count, Case-Insensitive Like Count, Not Like Count, Regex Count, and Not Regex Count each require an additional runtime property that isn’t exposed in the Profiler Settings metrics picker. When listed without values or expression, the ingestion profiler skips them. Configure them in a custom profiler workflow with add_props(values=...) for Count in Set or add_props(expression=...) for the pattern-based metrics. In the Collate Spark implementation, Case-Insensitive Like Count currently uses case-sensitive regular-expression (rlike) matching, so do not rely on case-insensitive matching until that implementation is corrected.
Counts the number of values in a column matching a specified pattern, ignoring case. Requires a pattern. The Collate Spark implementation currently evaluates the pattern with case-sensitive regular-expression (rlike) semantics; see the warning above.
Counts rows whose value does not match a specified SQL LIKE pattern. SQL-backed runs count NULL values as non-matches, while Spark-backed runs do not count NULL results from the negated predicate.
Counts rows whose value does not match a specified regular expression. SQL-backed runs count NULL values as non-matches, while Spark-backed runs do not count NULL results from the negated predicate. The current Pandas implementation counts matching values instead, so do not use this metric with a Pandas profiler until that implementation is corrected.
The histogram returns a dictionary of the different bins and the number of values found for that bin. It will be computed only if the Inter Quartile Range value is available.
Collate uses the QUERY_HISTORY_BY_WAREHOUSE view of the INFORMATION_SCHEMA to collect metrics about DML operations. The QUERY ID is passed to the RESULT_SCAN function to get the number of rows affected by the operation. Ensure the user running the profiler workflow has access to this view and this function.Collate will look at the past 24 hours to fetch the operations that were performed against a table.Important
For the Snowflake system, the system will parse the DDL query and attempt to match database, schema, and table name to entities in Collate. If the DDL query does not include all 3 elements Collate will not be able to ingest this metric.
Collate uses the following to fetch DML operations as well as the number of rows affected by these operations.
SVV_TABLE_INFO, STL_INSERT, and STL_DELETE in Provisioned Cluster
SYS_QUERY_DETAIL in Serverless instance
Ensure the user running the profiler workflow has access to these views and tables.Collate will look at the previous day to fetch the operations that were performed against a table.
BigQuery uses the JOBS table of the INFORMATION_SCHEMA to fetch DML operations as well as the number of rows affected by these operations. Make sure your data location is properly set when creating your BigQuery service connection in Collate.Collate will look at the previous day to fetch the operations that were performed against a table filter on the creation_time partition field to limit the size of data scanned.