
How to Run the Connector Externally
To run the Ingestion via the UI you’ll need to use the OpenMetadata Ingestion Container, which comes shipped with custom Airflow plugins to handle the workflow deployment. If, instead, you want to manage your workflows externally on your preferred orchestrator, you can check the following docs to run the Ingestion Framework anywhere.External Schedulers
Get more information about running the Ingestion Framework Externally
Requirements
The PowerBI Report Server should be accessible from the ingestion environment.Metadata Ingestion
To ingest metadata from PowerBI Report Server, you need to create a service connection. The service connects PowerBI Report Server with Collate. Once you create a service, Collate automatically starts ingesting metadata.Step 1: Add New Service
Open the Services page and start a new service.-
Navigate to Settings > Services and select Dashboard Services.
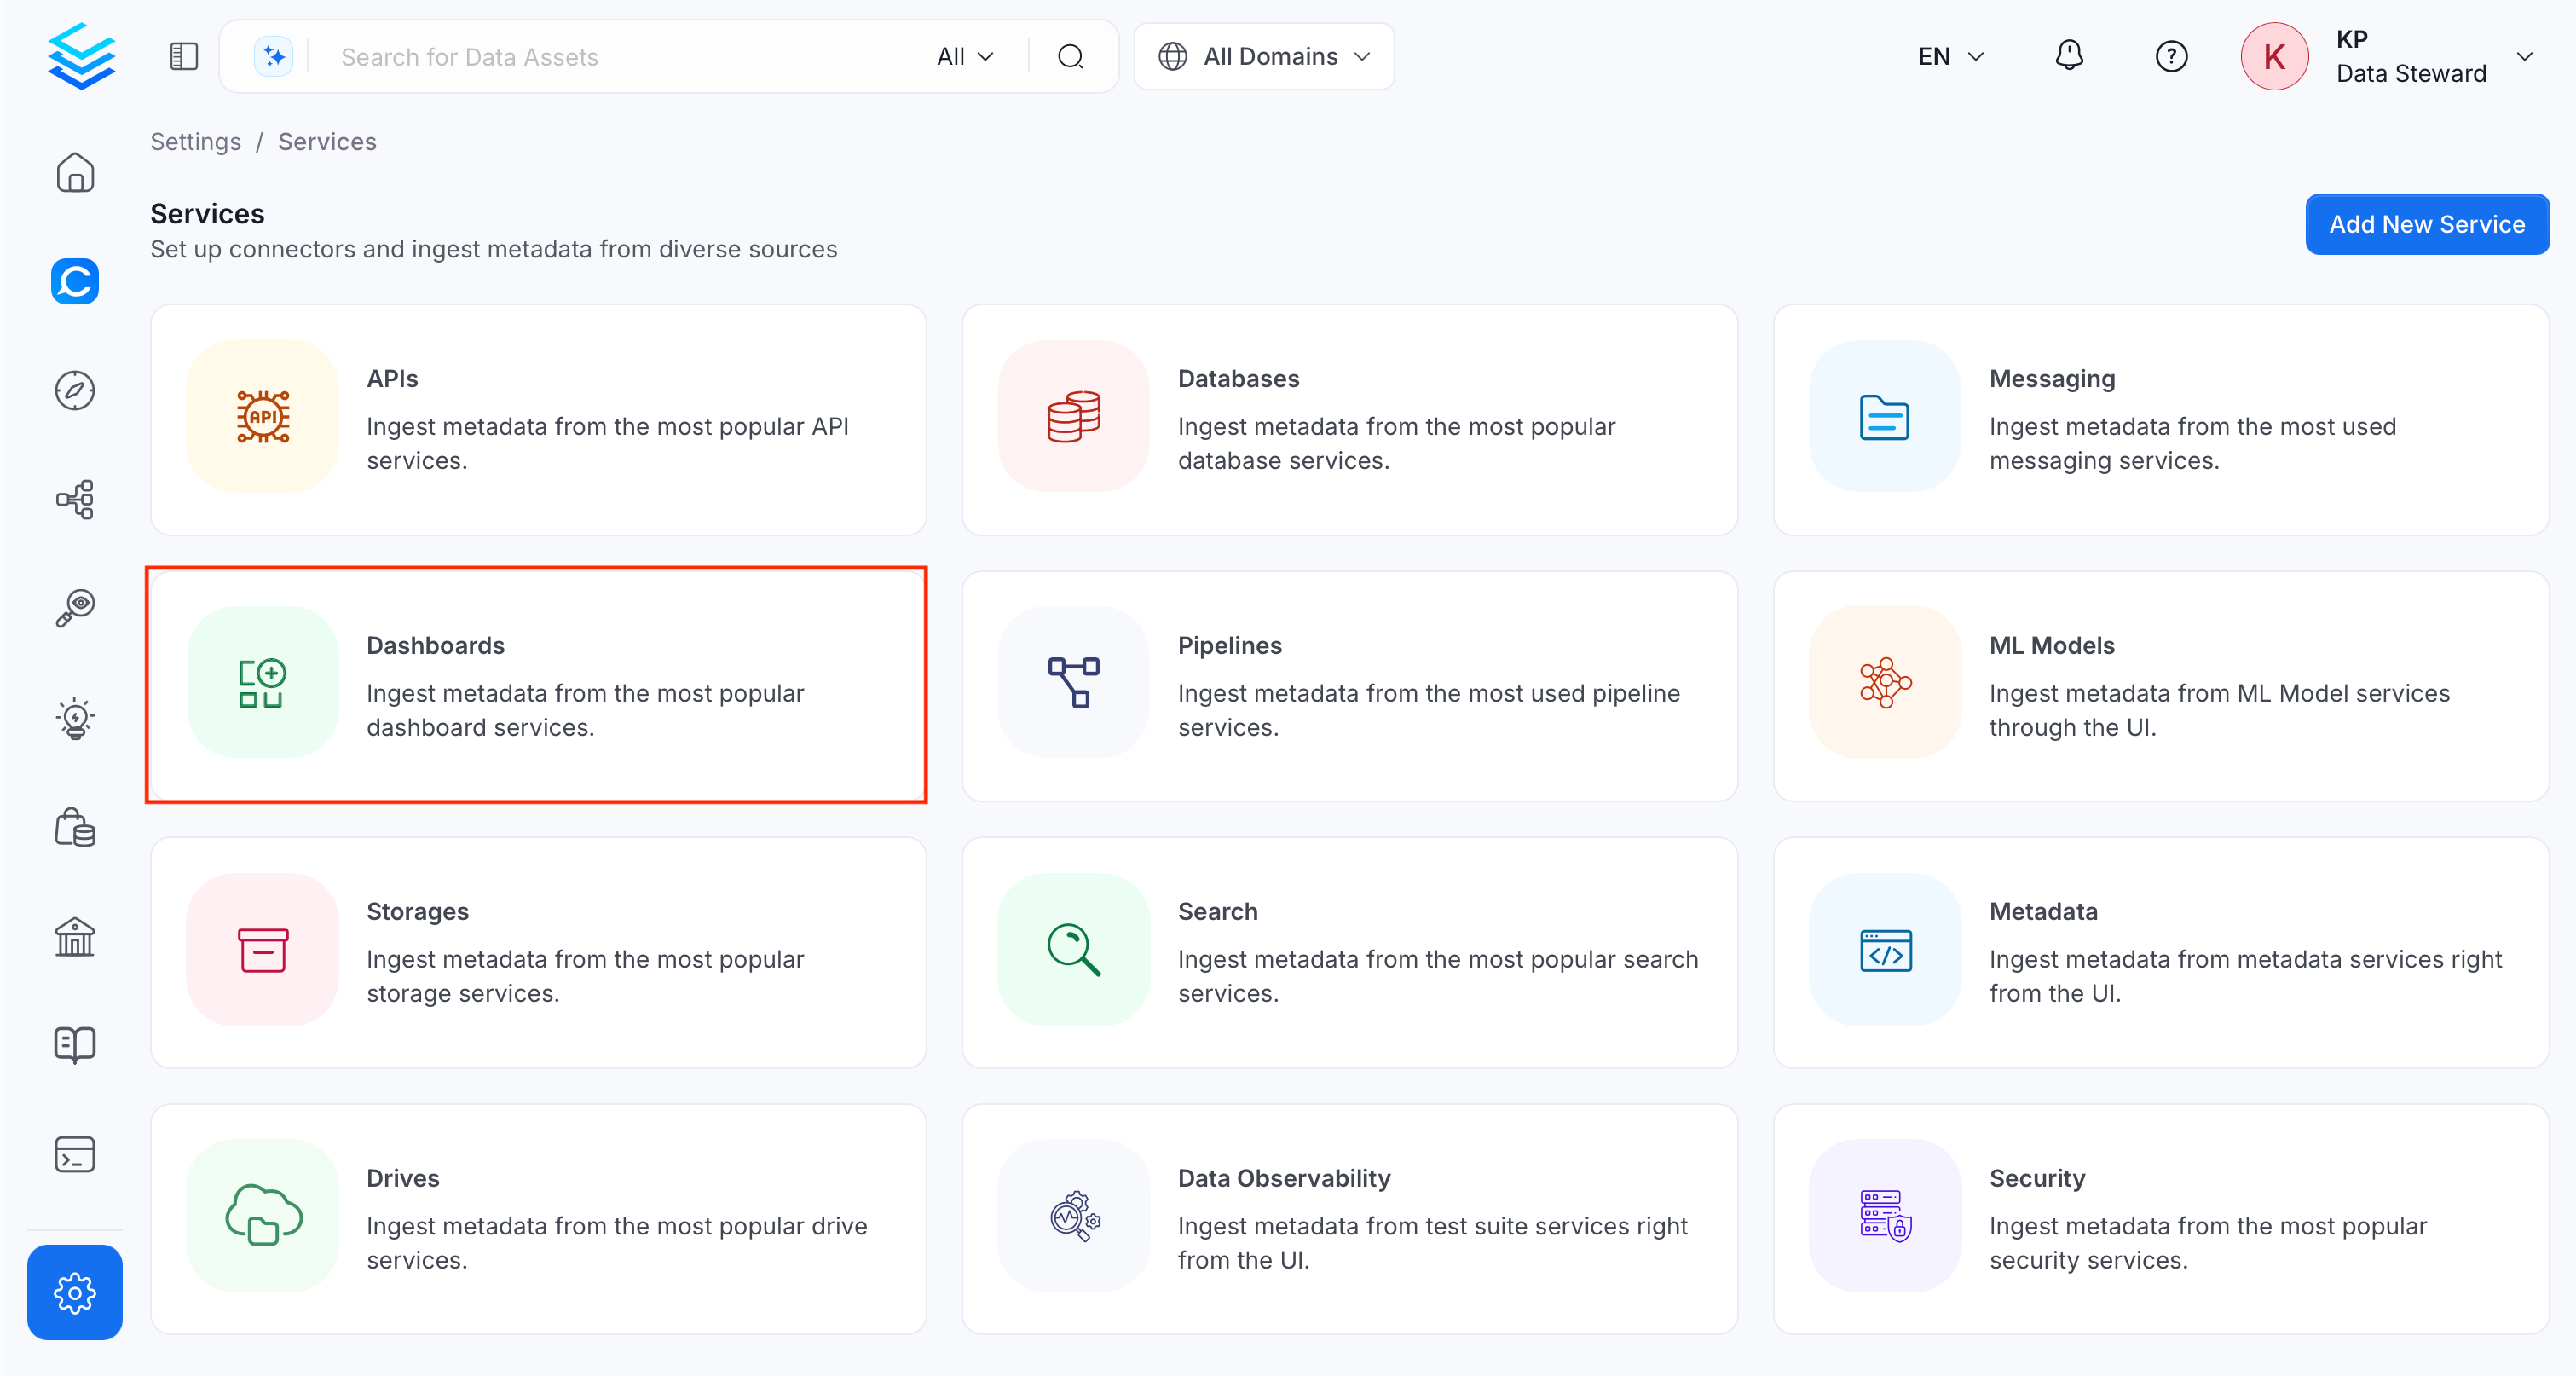
-
Click Add New Service.
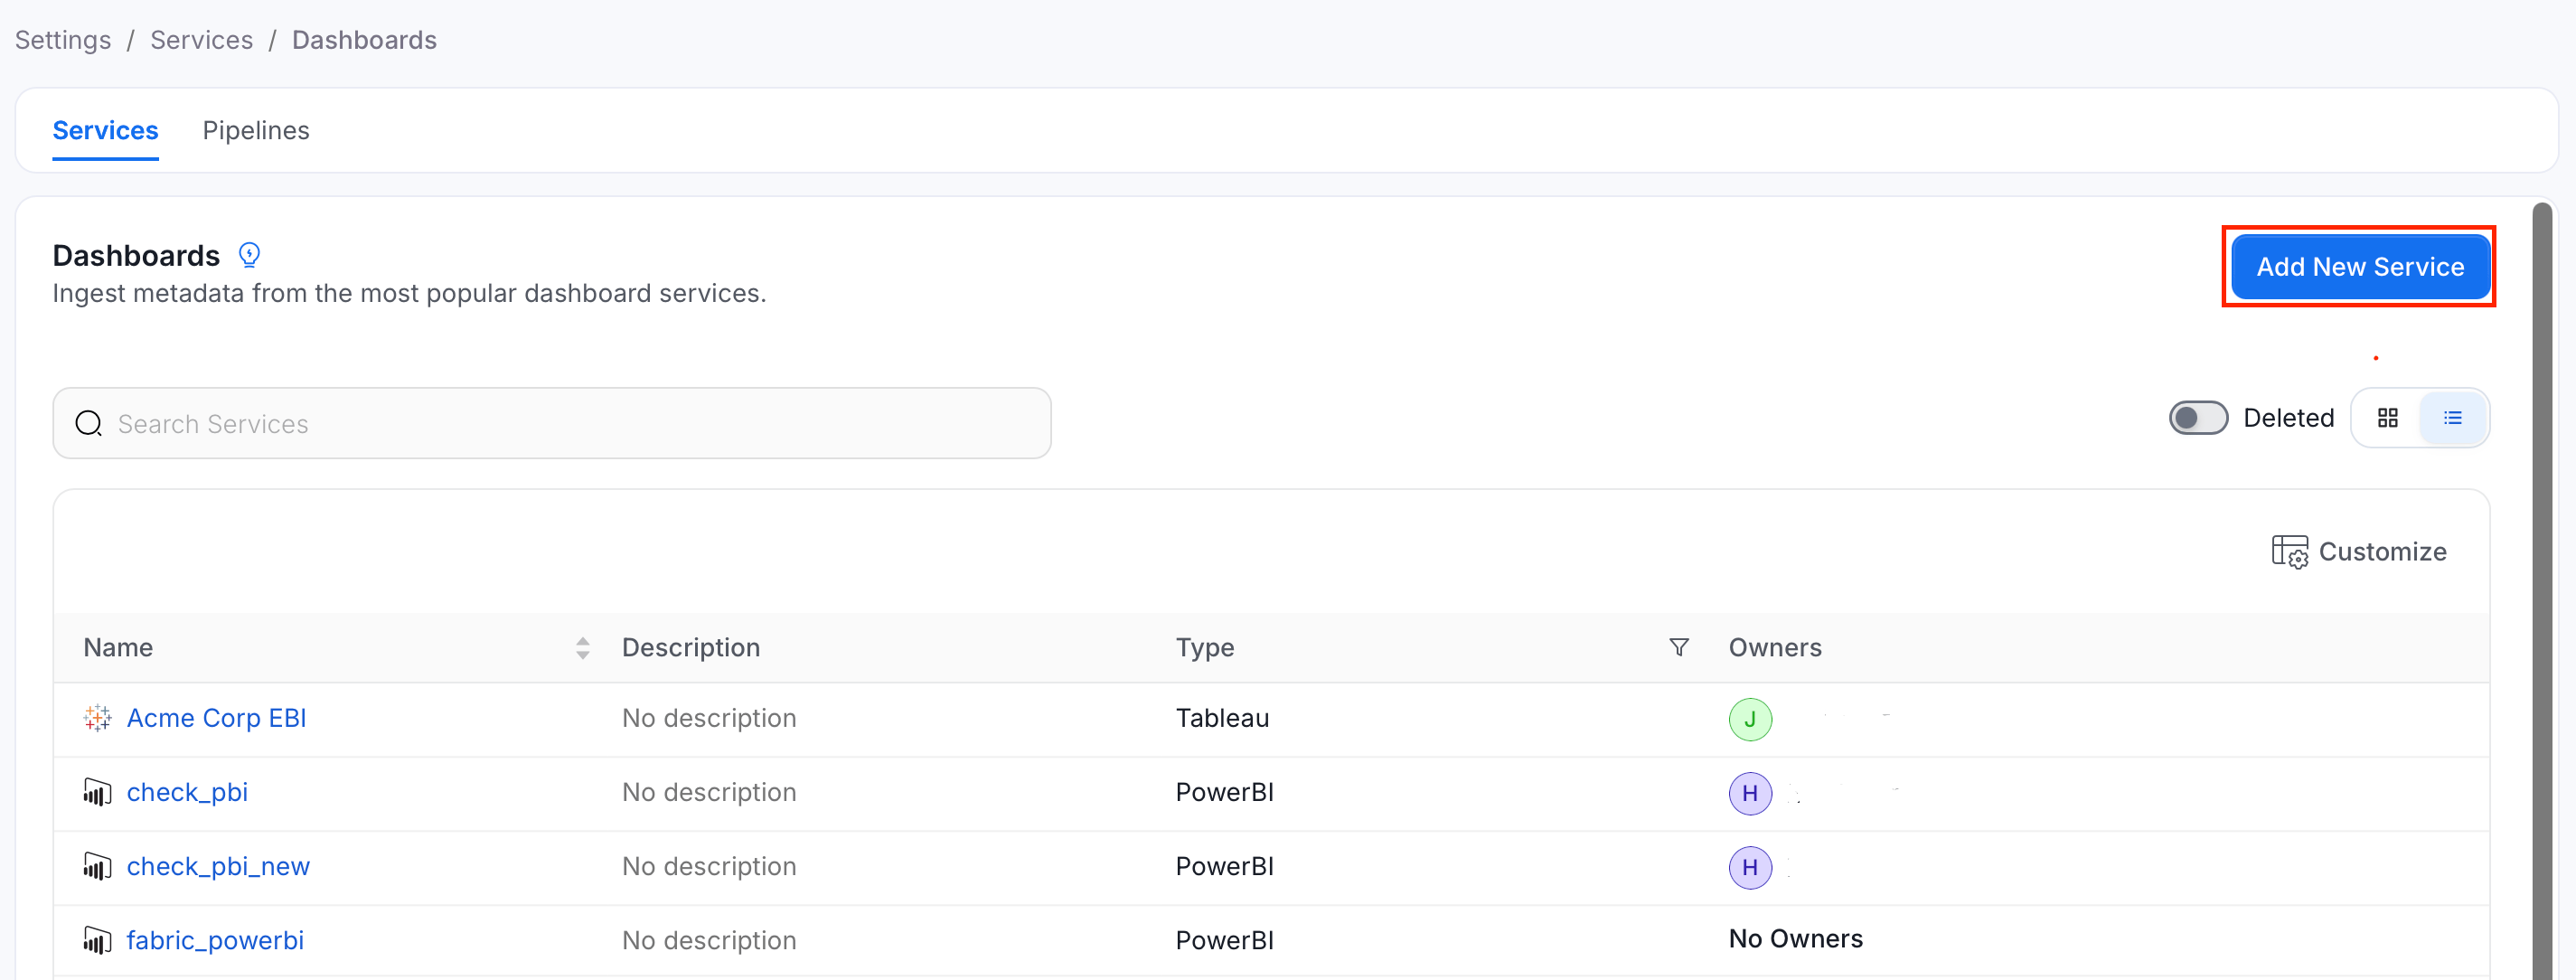
Step 2: Select a Service and Connector
From the service type dropdown, select Dashboard Services, then click the PowerBI Report Server connector tile.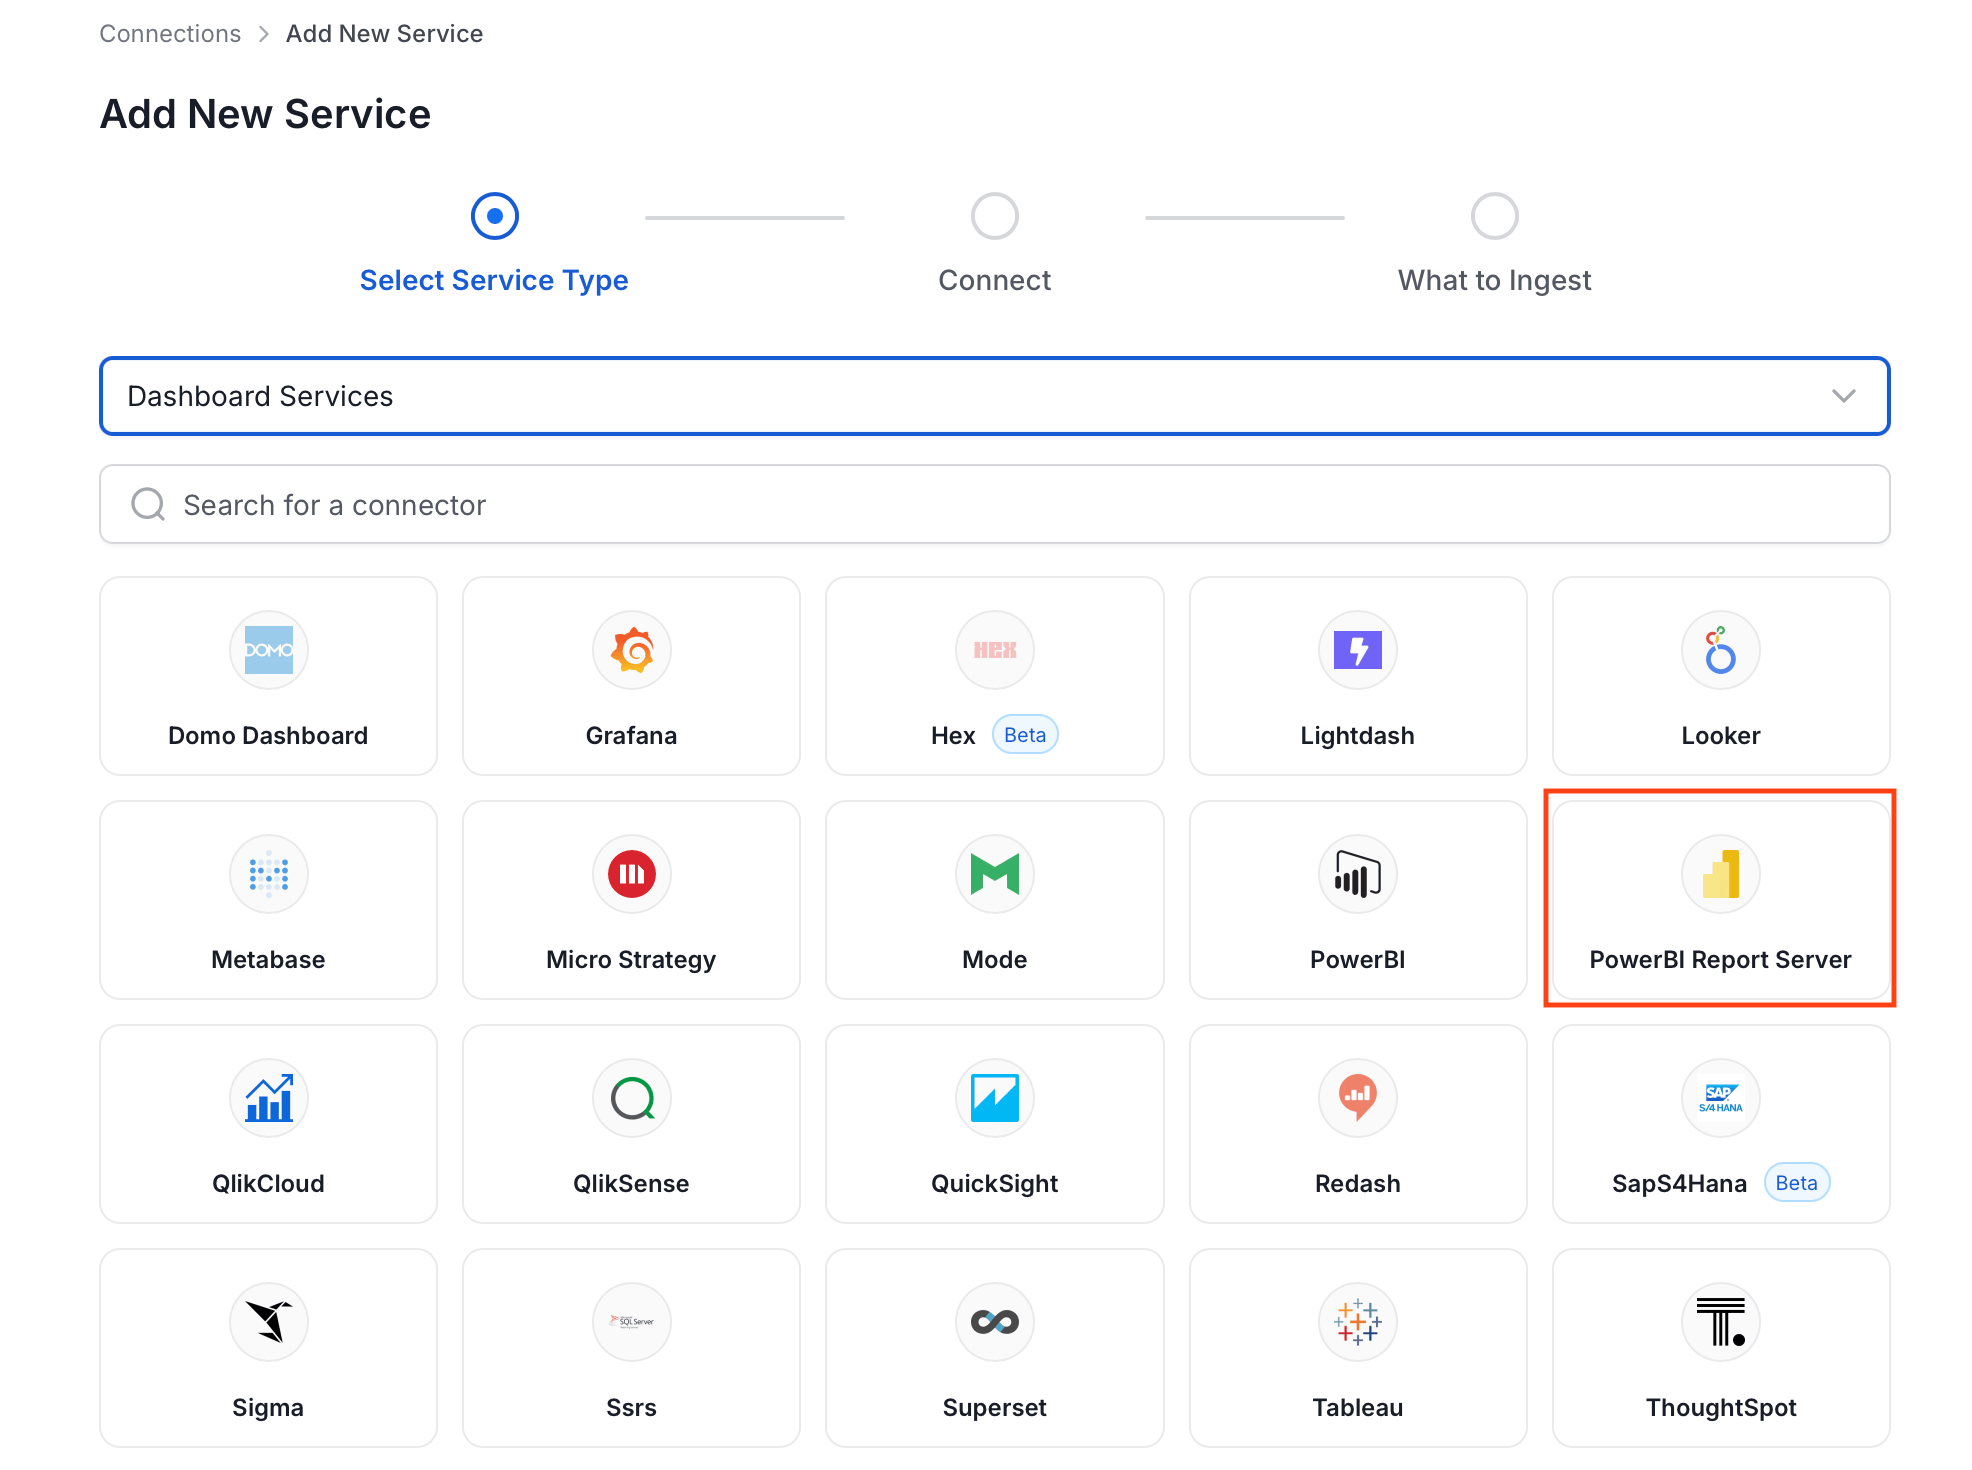
Step 3: Add Service Name and Description
- Enter a unique, descriptive Service Name. Collate identifies services by their service name. Enter a name that distinguishes this deployment from other PowerBI Report Server services you are ingesting metadata from.
- Optional: Enter a Description for the service.

Note: The service name can’t be changed after you set it.
Step 4: Configure Connection Options
Specify where ingestion runs, provide your source credentials, and verify the connection.Select Ingestion Runner
Select an Ingestion Runner: the runner where the ingestion pipeline will execute.
Enter Connection Details
Enter the connection details for PowerBI Report Server. The right-hand panel in the UI displays inline help for each field.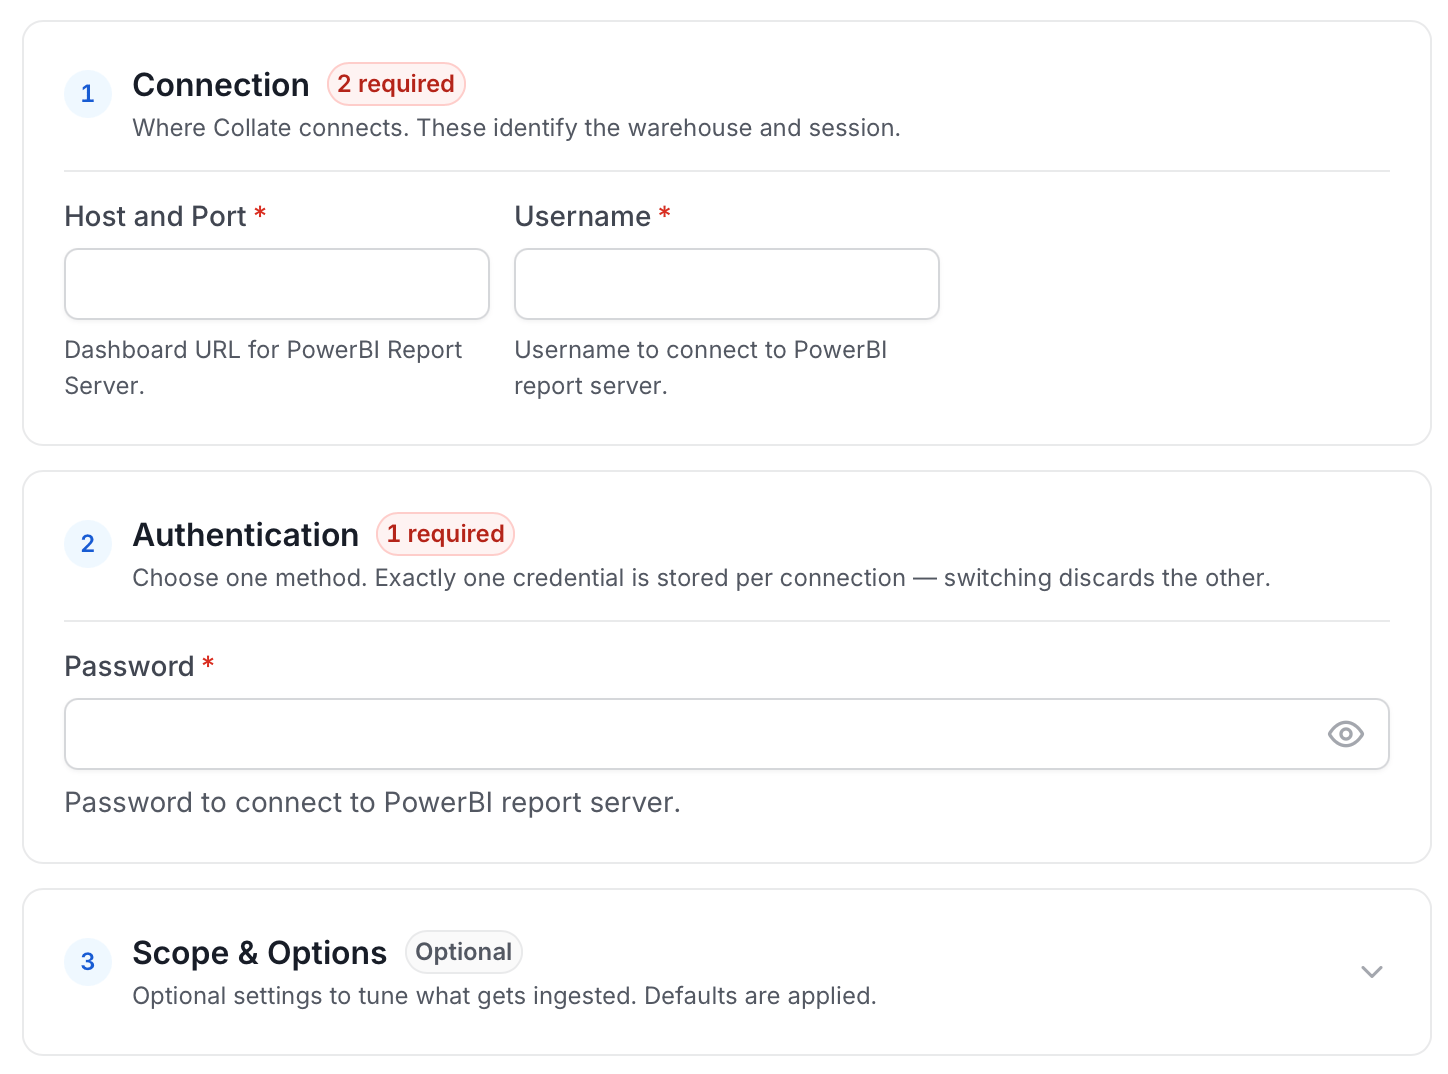
- Host and Port: This parameter specifies the host and port of the PowerBI Report Server instance. This should be specified as a URI string in the format
http://hostname:portorhttps://hostname:port. For example, you might set it tohttp://192.168.1.1:80. - Username: Username to connect to PowerBI Report Server.
- Password: Password to connect to PowerBI Report Server.
- Web Portal Virtual Directory Name: Web Portal Virtual Directory name which you have configured in your PowerBI Report Server configuration manager.
Test Connection
- Click Test Connection to verify the credentials.
- After the test succeeds, click Save.

Step 5: Configure Ingestion Options
In the What to Ingest step, use filter patterns to control which assets Collate ingests from your dashboard service. Filter rules match asset names using the following match types.How Filter Patterns Work
- Include: Add one or more comma-separated values. Each value uses one of the following match types. Collate ingests only assets whose names match at least one rule. Leave blank to include all assets.
- Exclude: Add one or more comma-separated values. Each value uses one of the following match types. Collate skips any asset whose name matches a rule. Leave blank to exclude nothing.
- contains: matches any name containing the value. For example,
salesmatchesmy_sales_dataandsales_2024. - starts with: matches names beginning with the value. For example,
prod_matchesprod_dbandprod_schema. - ends with: matches names ending with the value. For example,
_rawmatchesevents_rawandlogs_raw. - is exactly: matches the exact name only. For example,
analyticsmatches onlyanalytics. - matches regex: matches names using a regular expression. For example,
^prod_.*_v\d+$matchesprod_events_v1.
Filter Options
The Dashboard and Chart sections each include the following filter options:- Dashboard: Controls which dashboards Collate ingests from the source.
- Chart: Controls which charts within the ingested dashboards are included.
- Scan Mode: Choose between the following scan modes:
- Scan all: Ingests every asset of that type the connector can access. This is the default.
- Only specific: Enables include rules so only assets matching at least one rule are ingested.
- Exclude system toggle: Use this toggle to filter out system-reserved names defined by the connector for that asset type.
- Always exclude: Add permanent exclusion rules (shown in red). Assets matching these rules are never ingested, regardless of include rules.
- Preview: Shows a real-time summary of what will be in scope based on your current rules.
- Include rules: In Only specific mode, click + Add to define a rule. Added rules appear as chips. An asset is included if it matches any rule.
Step 6: Create & Deploy
Click Create & Deploy to deploy the agent and start the first metadata ingestion run. Collate saves the service configuration and immediately begins pulling metadata from the source. To monitor ingestion progress or view the service you just added, go to Settings > Services and select your service.Configure Metadata Agent and Schedule Ingestion
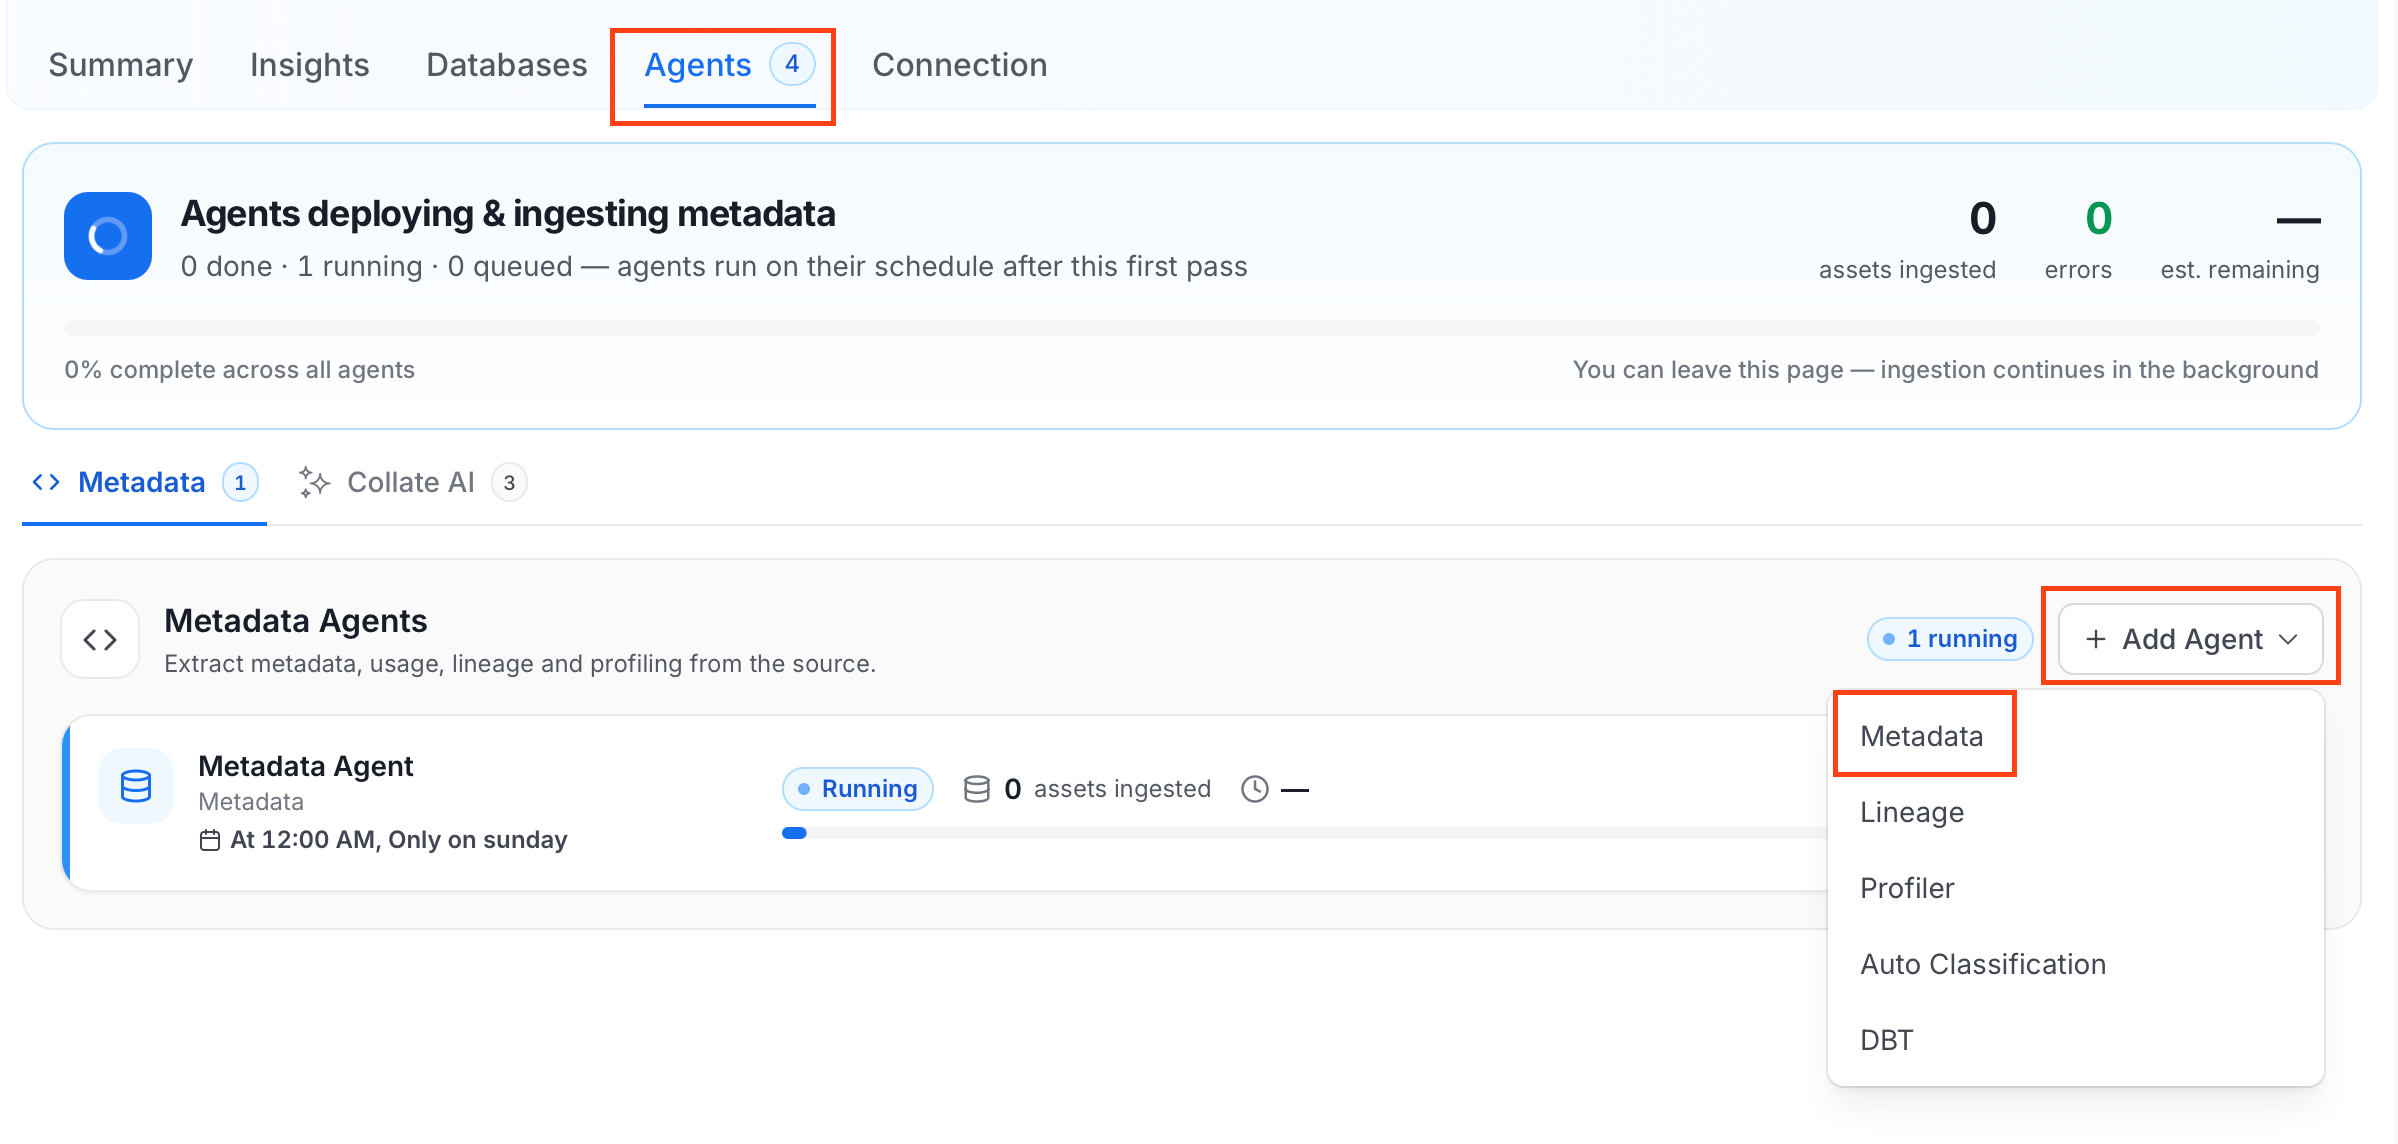
The Metadata Agent extracts dashboards, charts, data models, and other structural metadata from your source and keeps your Collate catalog in sync. It powers discovery, lineage, and governance across your data assets. When you click Create & Deploy, Collate automatically deploys a Metadata Agent for this service and triggers the first ingestion run. View its status and run history from the Agents tab on the service detail page. To configure the additional Metadata Agent and schedule ingestion, follow these steps:- Navigate to Settings > Services and select the Dashboards service.
- Select your service and click the Agents tab.
-
Click Add Agent and select Metadata from the dropdown.
-
On the Configure Ingestion page, do the following and click Next.
-
Name this Ingestion: Enter a unique, recognizable name for this ingestion pipeline.

-
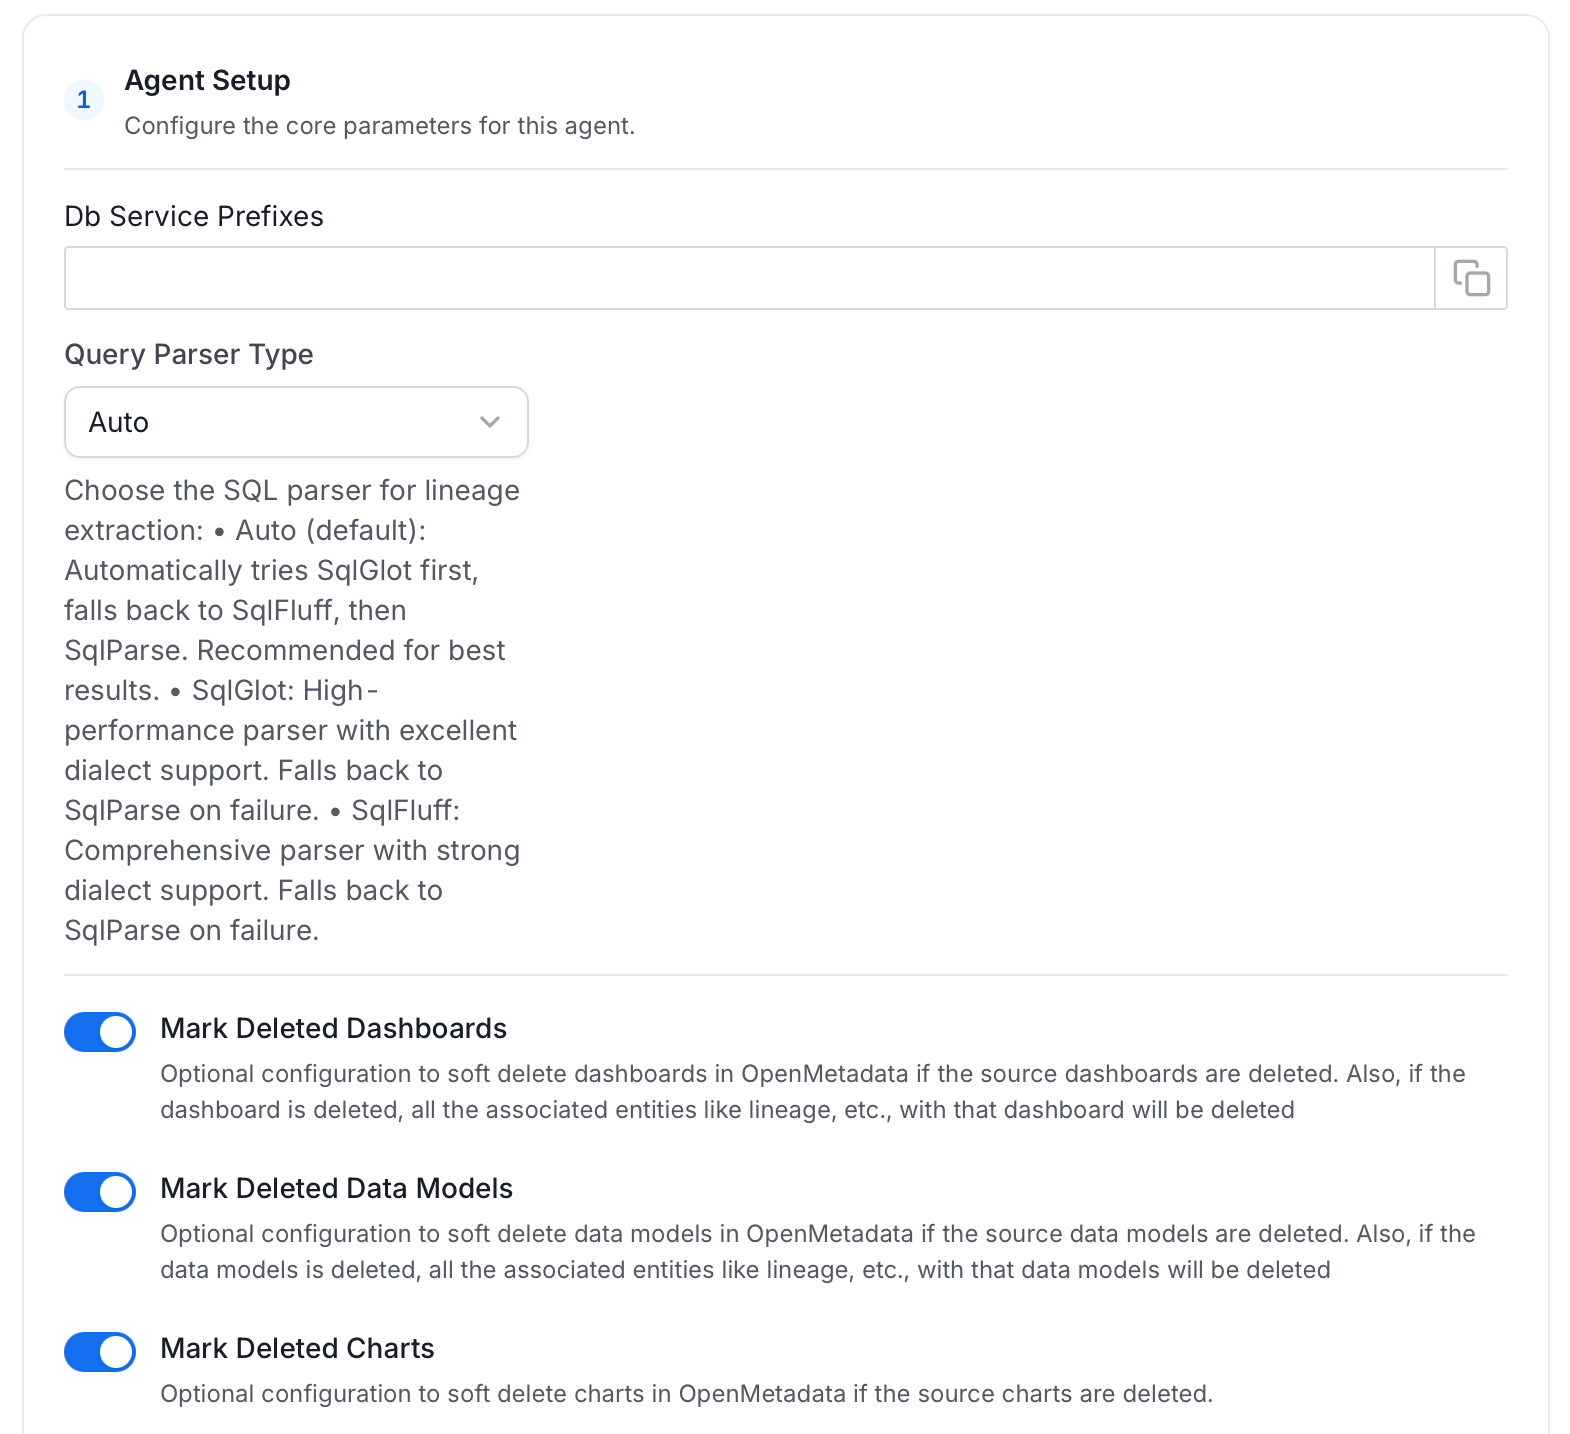
Agent Setup: Configure ingestion parameters. The following fields are available:
-
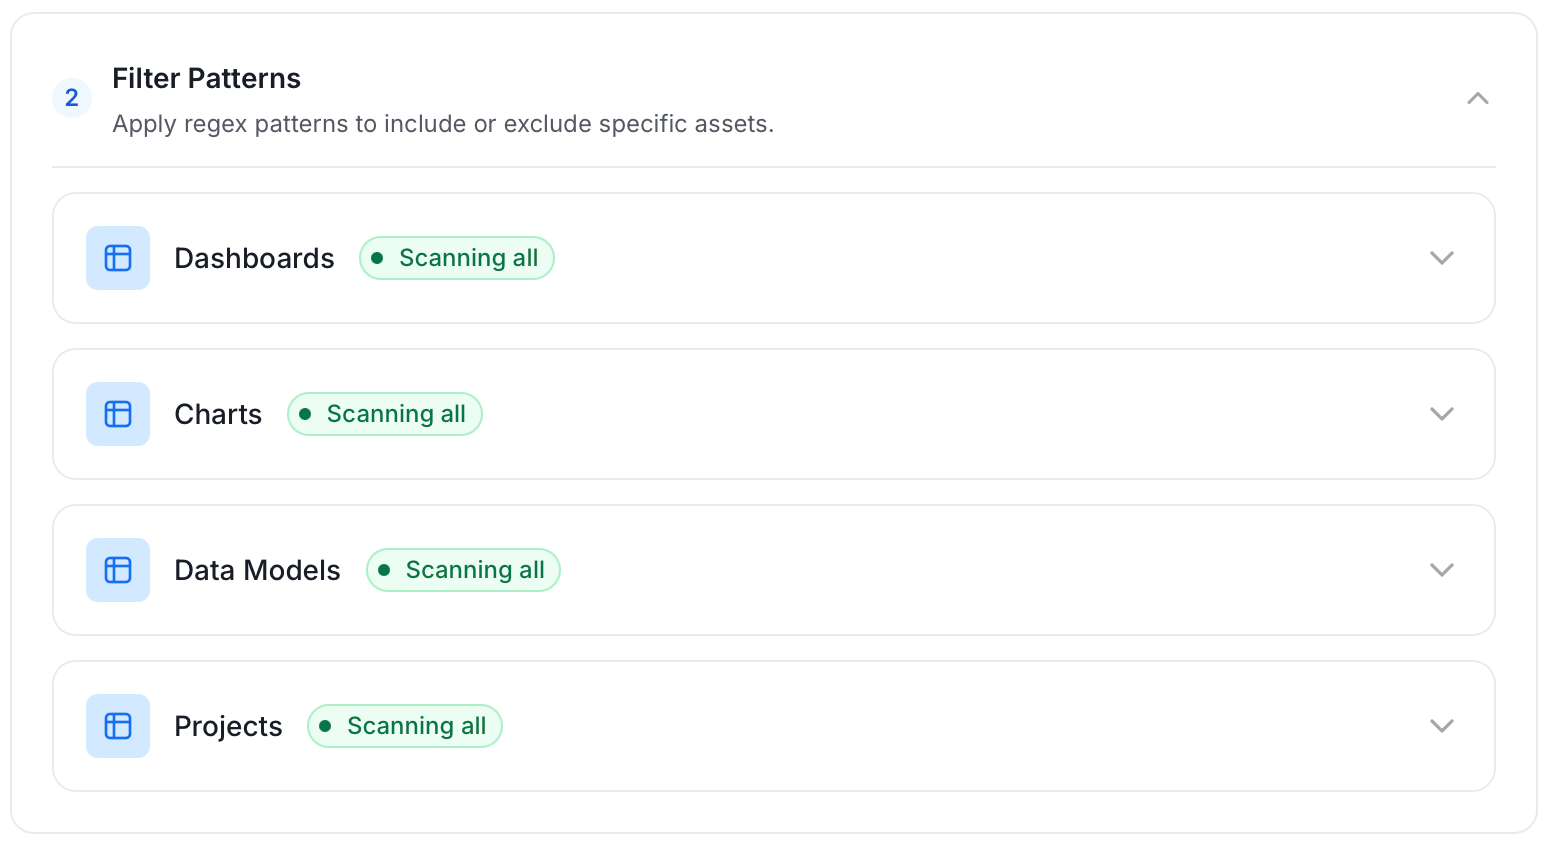
Filter Patterns: Apply include or exclude rules to scope which dashboards, charts, data models, and projects this agent ingests. These follow the same filter options described in Step 5.
-
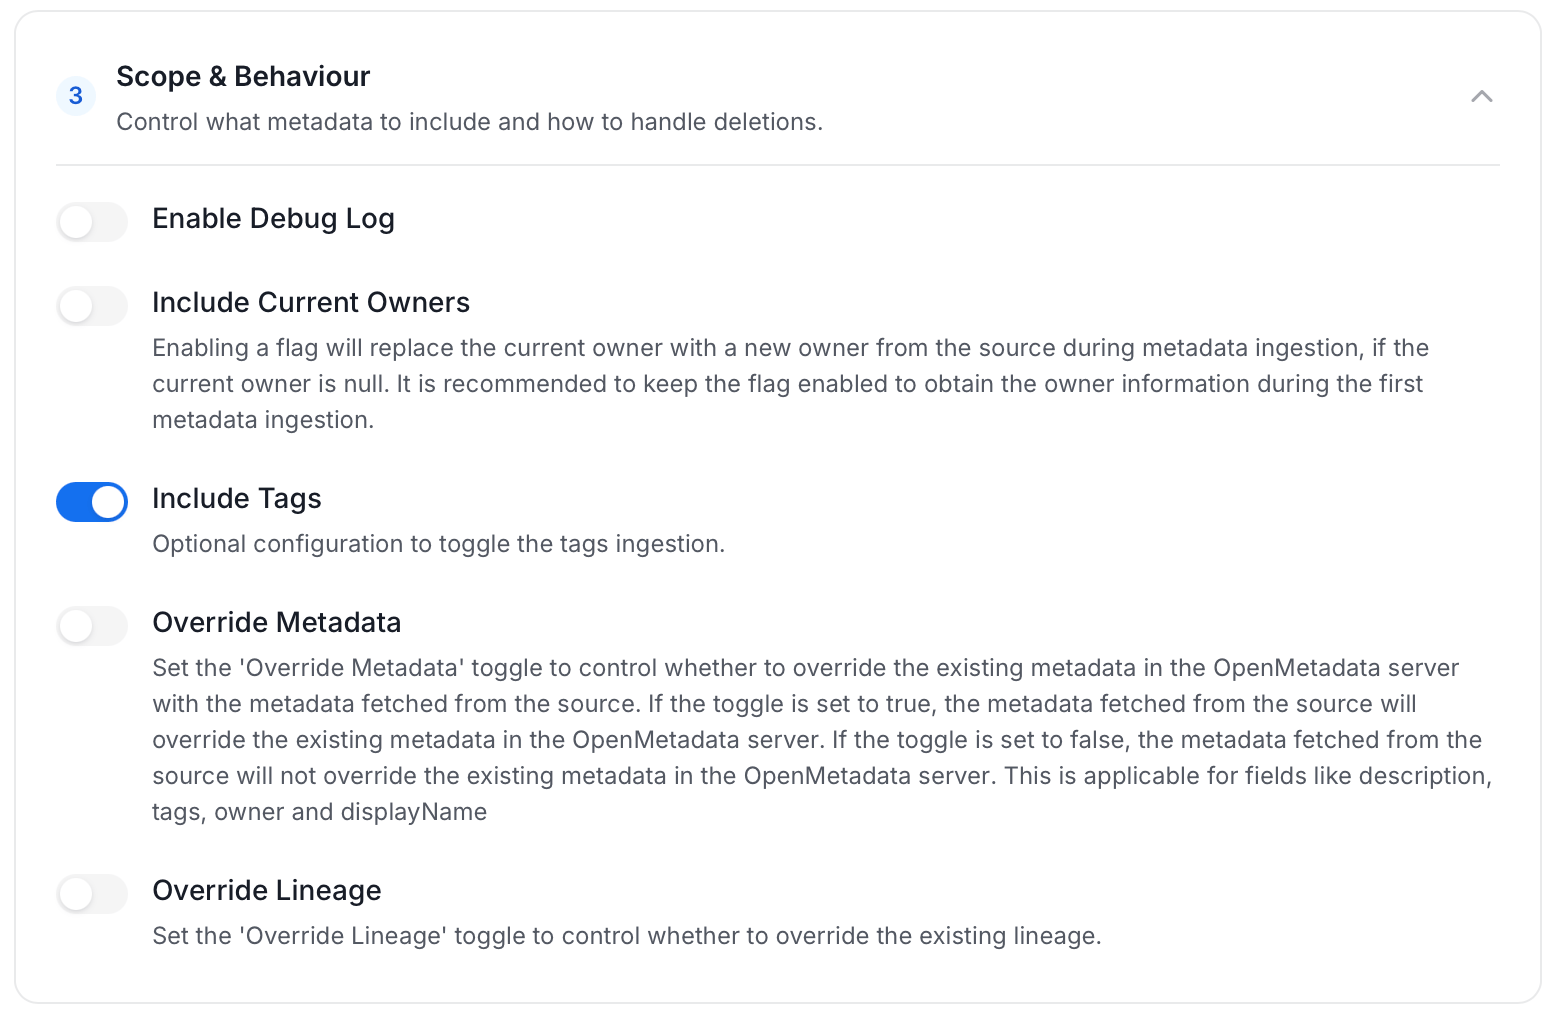
Scope & Behaviour: Control what metadata to include and how to handle deletions. Toggle each option on or off based on your needs:
-
Name this Ingestion: Enter a unique, recognizable name for this ingestion pipeline.
-
On the Schedule Interval page, set when the agent runs:
- Schedule: Choose a preset interval (Hourly, Daily, Weekly, Monthly) or enter a custom cron expression.
- On-Demand: No automatic schedule. Trigger the agent manually when needed.
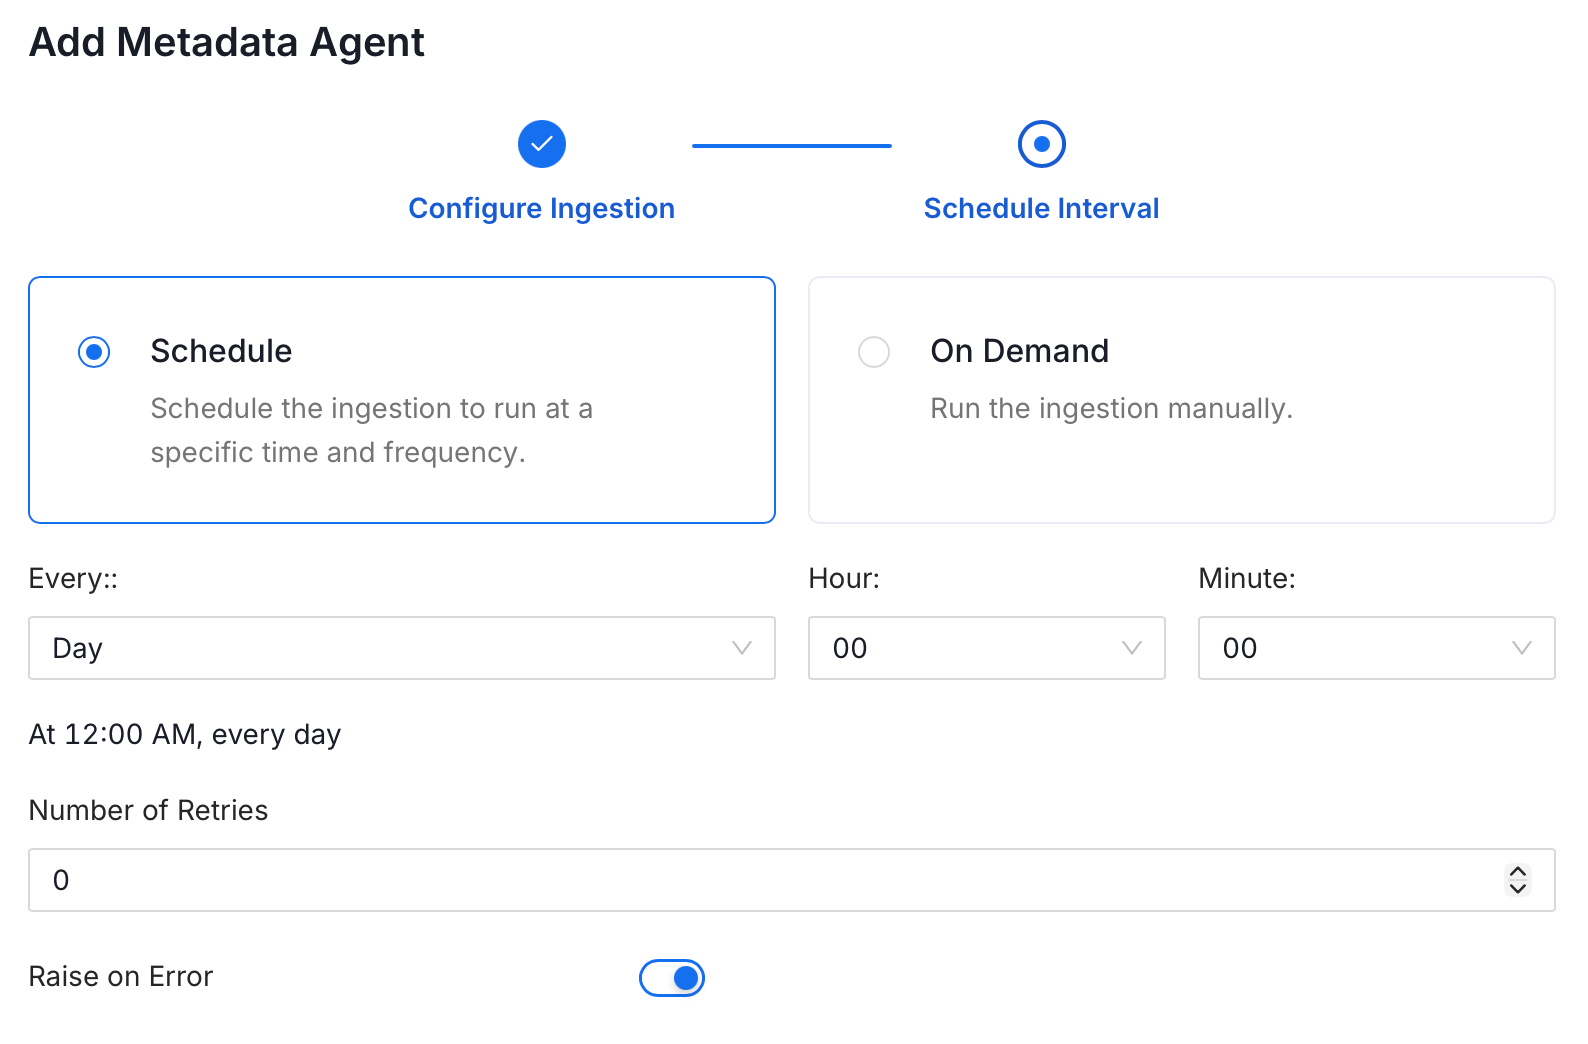
- Click Add to deploy the agent.
Troubleshooting
PowerBI Report Server Troubleshooting
Learn more about how to troubleshoot common PowerBI Report Server connector issues and resolve configuration or ingestion errors.