> ## Documentation Index
> Fetch the complete documentation index at: https://docs.getcollate.io/llms.txt
> Use this file to discover all available pages before exploring further.
# Data Observability Dashboards | Collate
> Monitor data health, test performance, and incident metrics through Collate's Data Quality observability dashboards.
# Data Observability Dashboards
The **Data Quality** page under **Observability** provides a platform-level view of your data health and test performance. It helps you monitor trends, identify issues, and track how your data quality evolves over time.
## Access the Dashboard
Navigate to **Observability > Data Quality** from the left navigation. The page opens on the **Summary** tab by default.
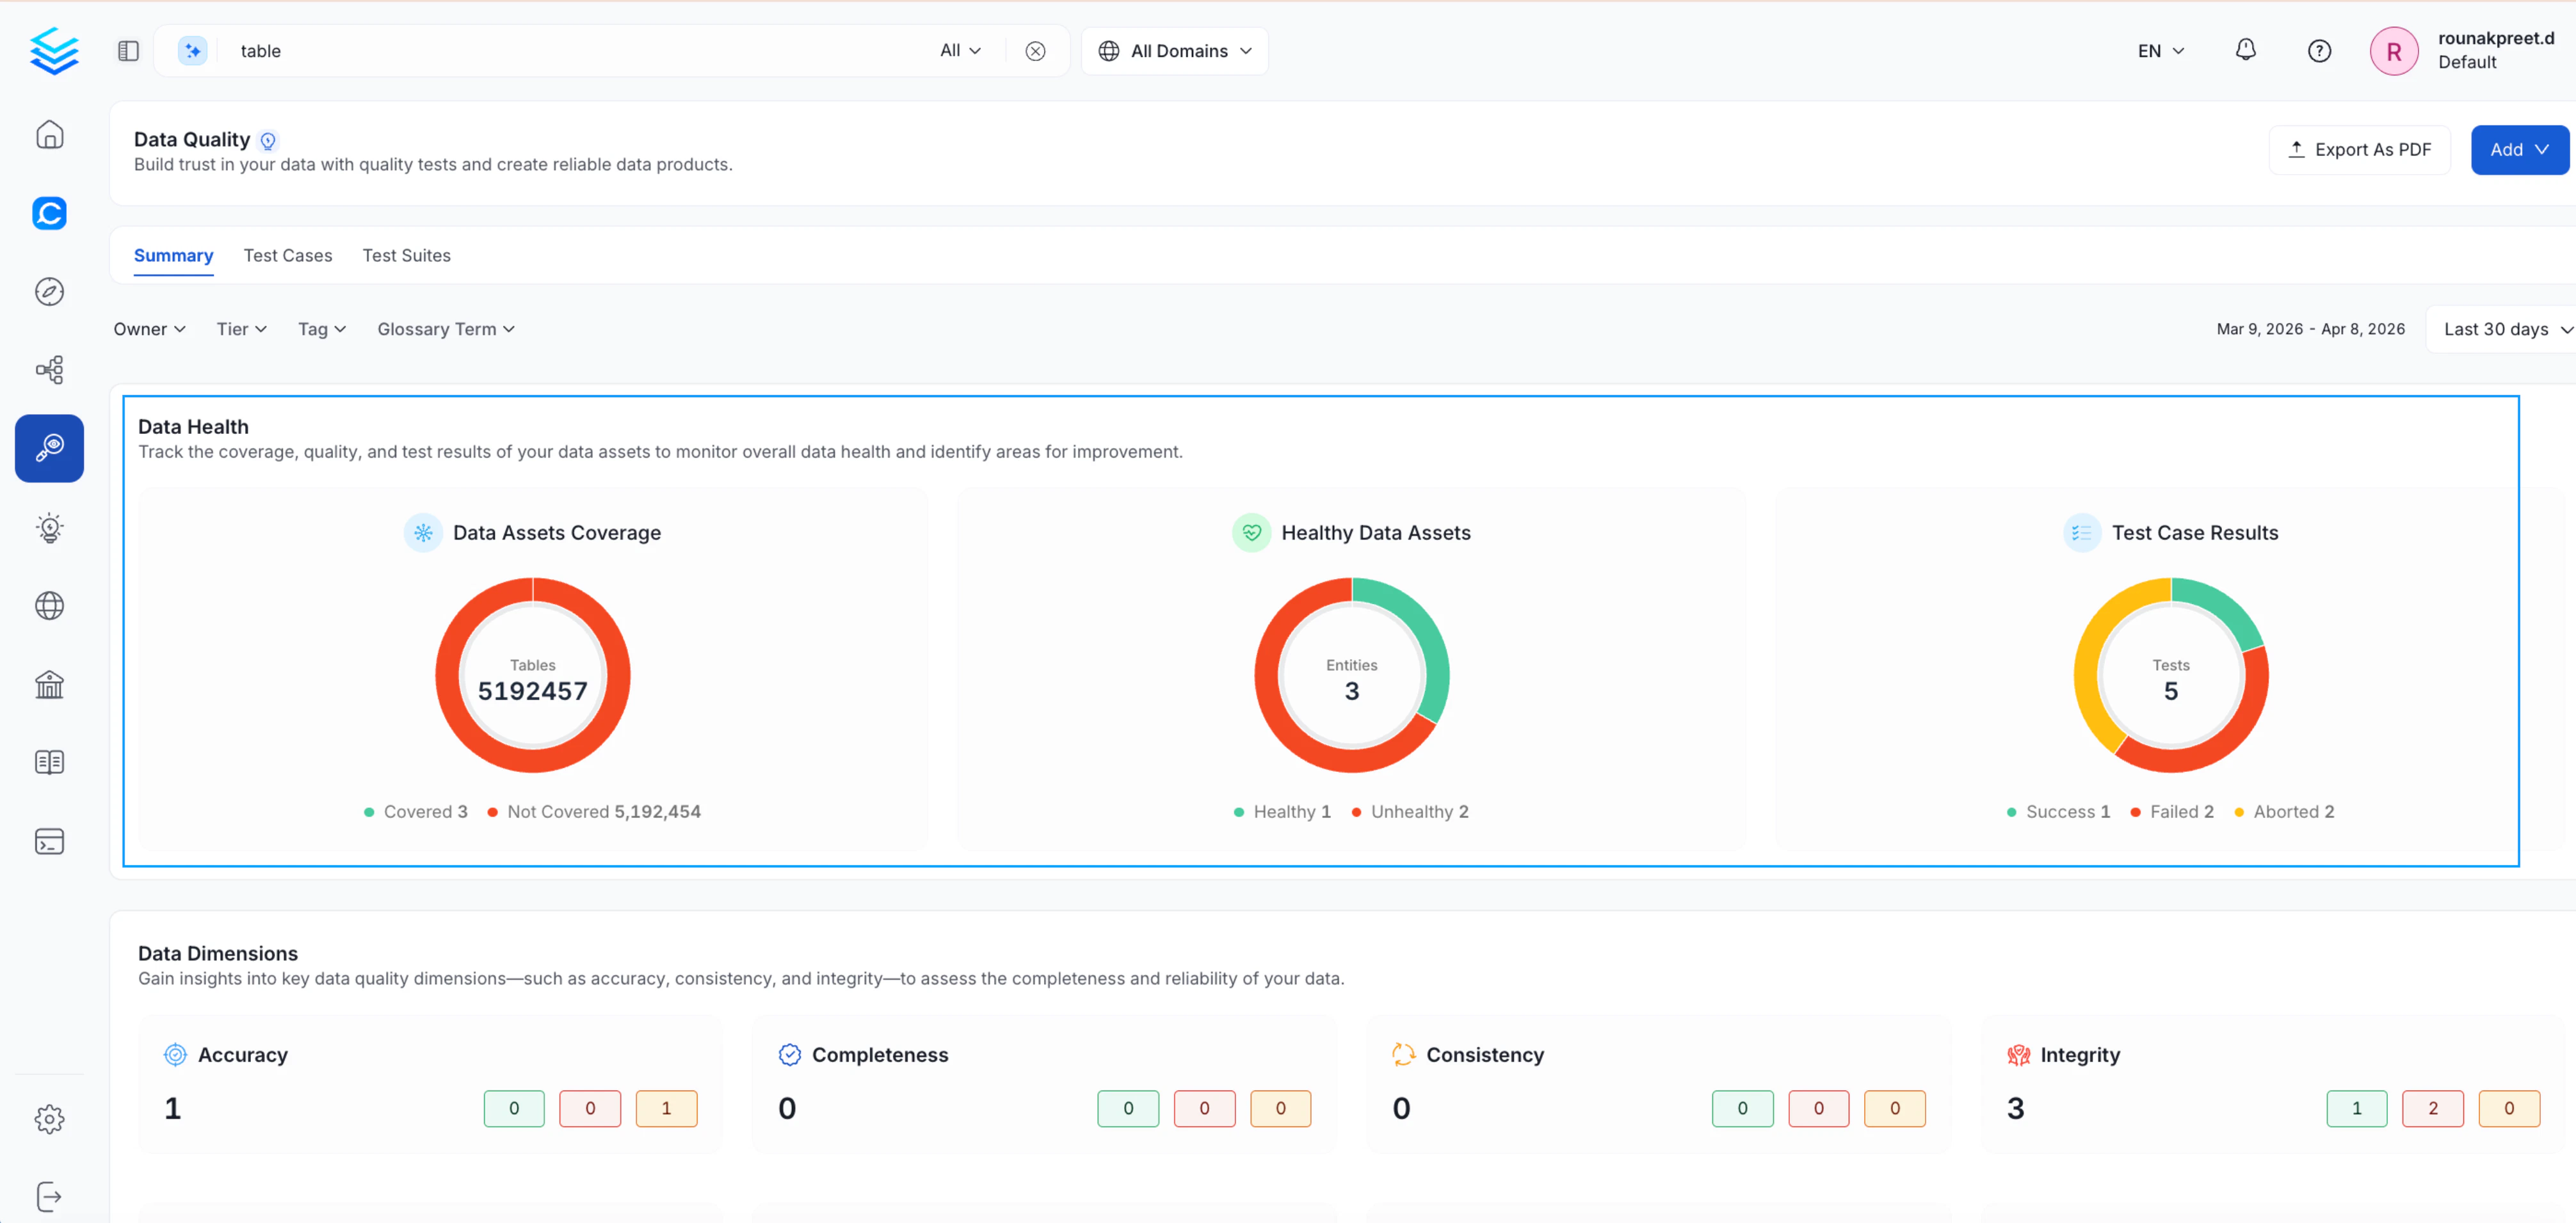
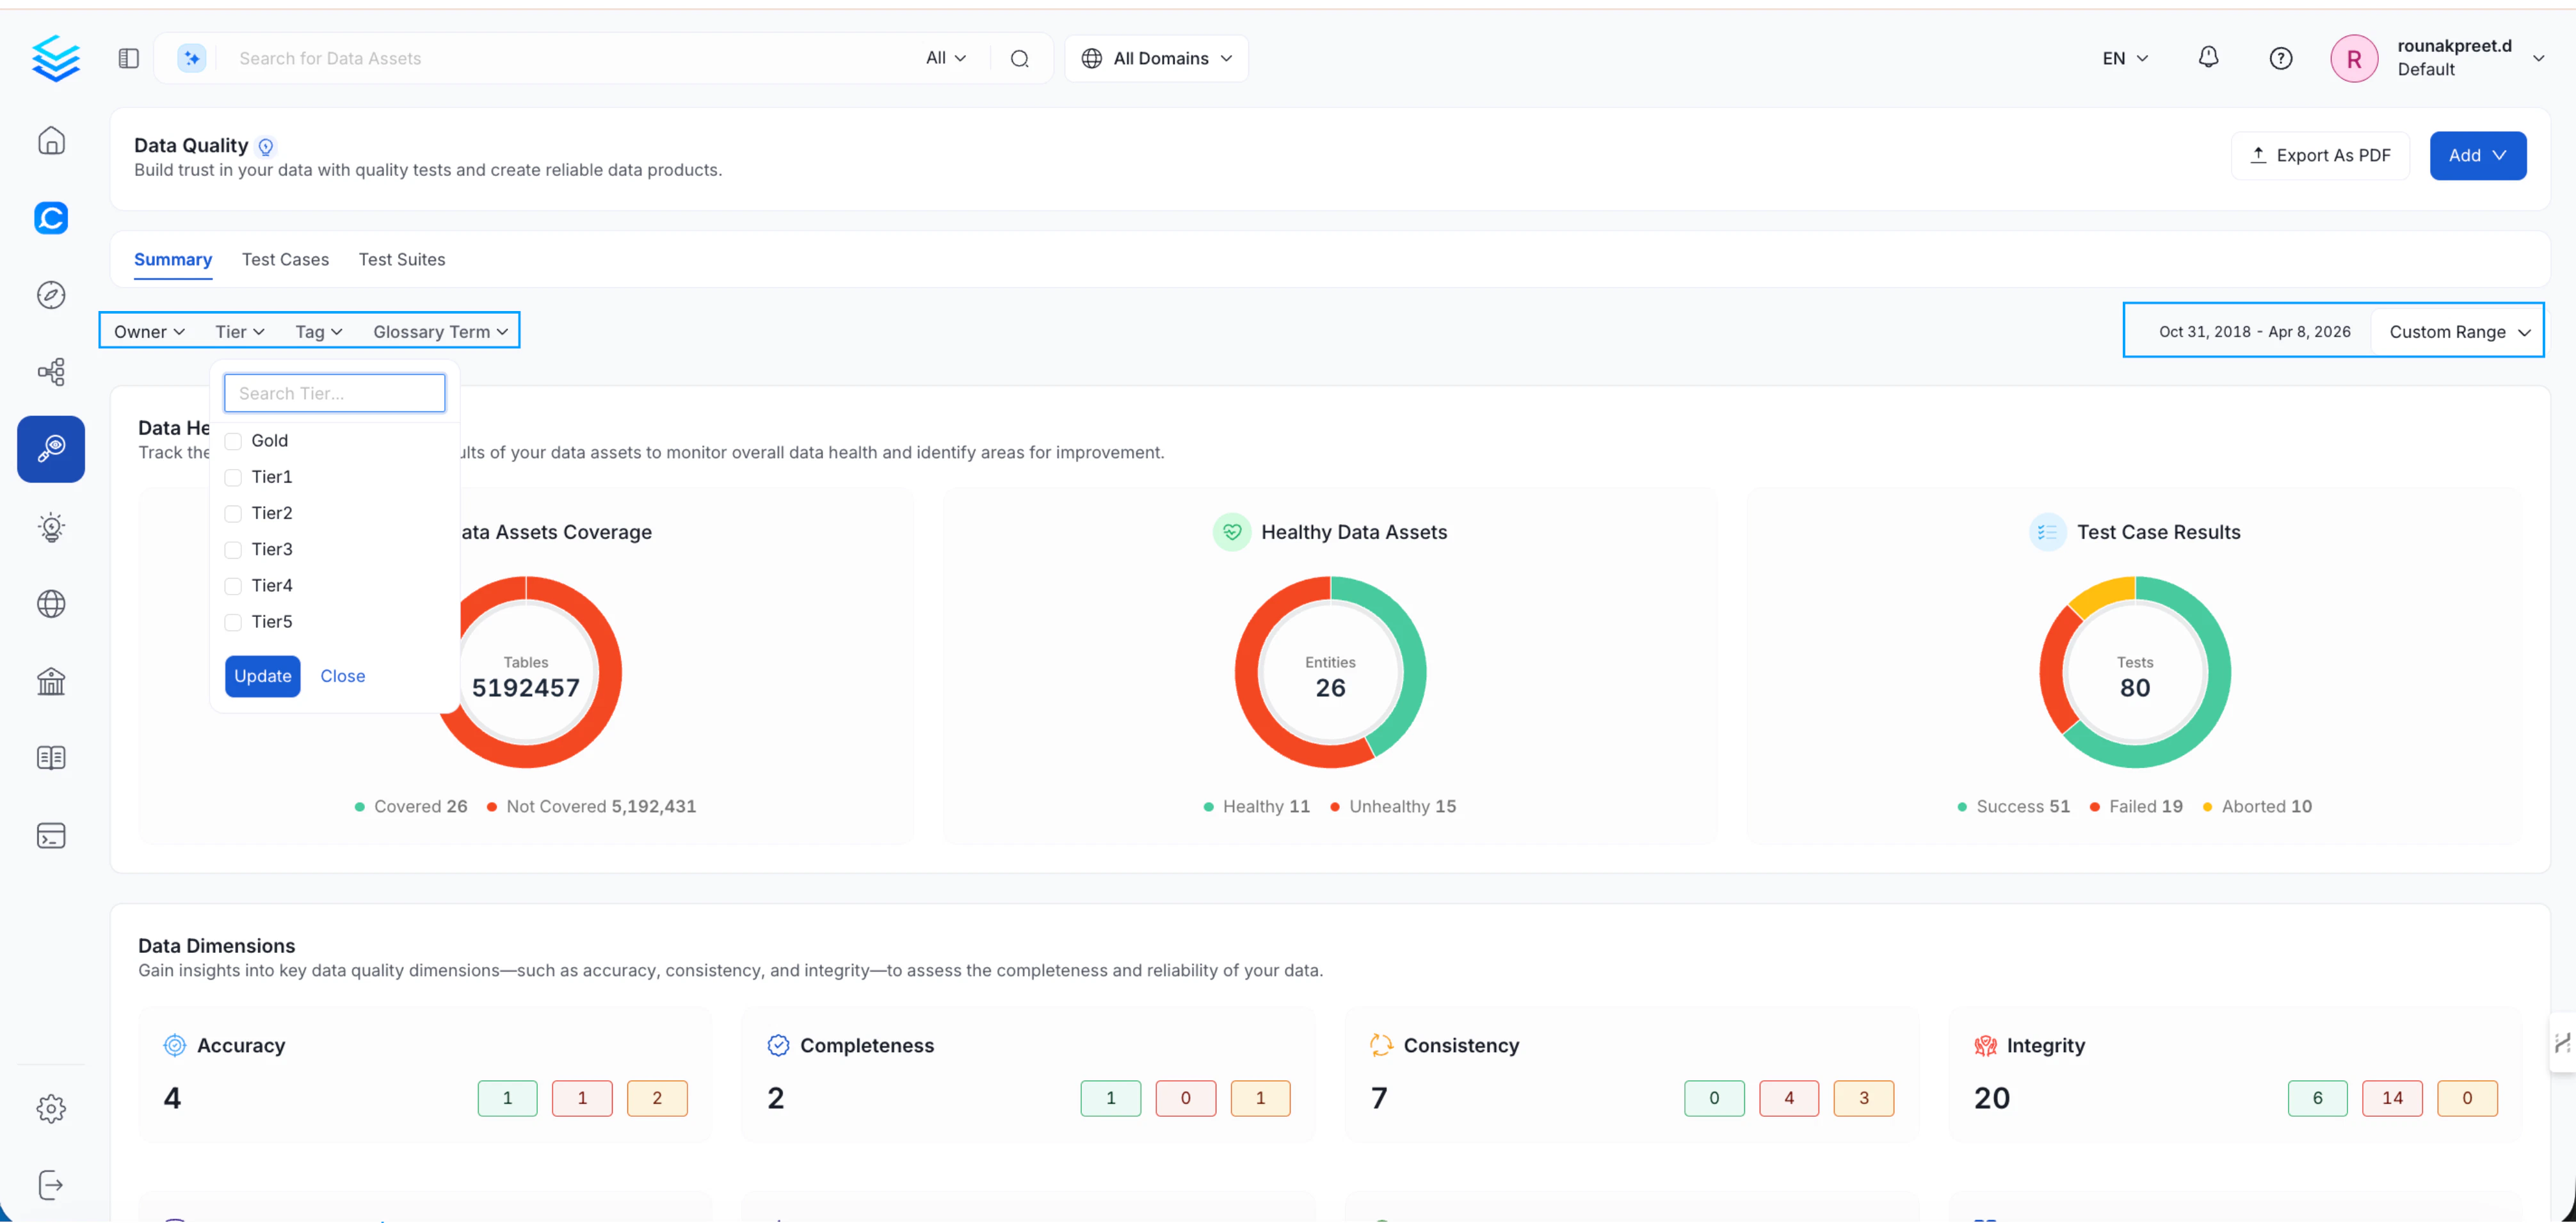
## Summary Dashboard
The **Summary** tab gives you a consolidated view of platform-wide data quality metrics.
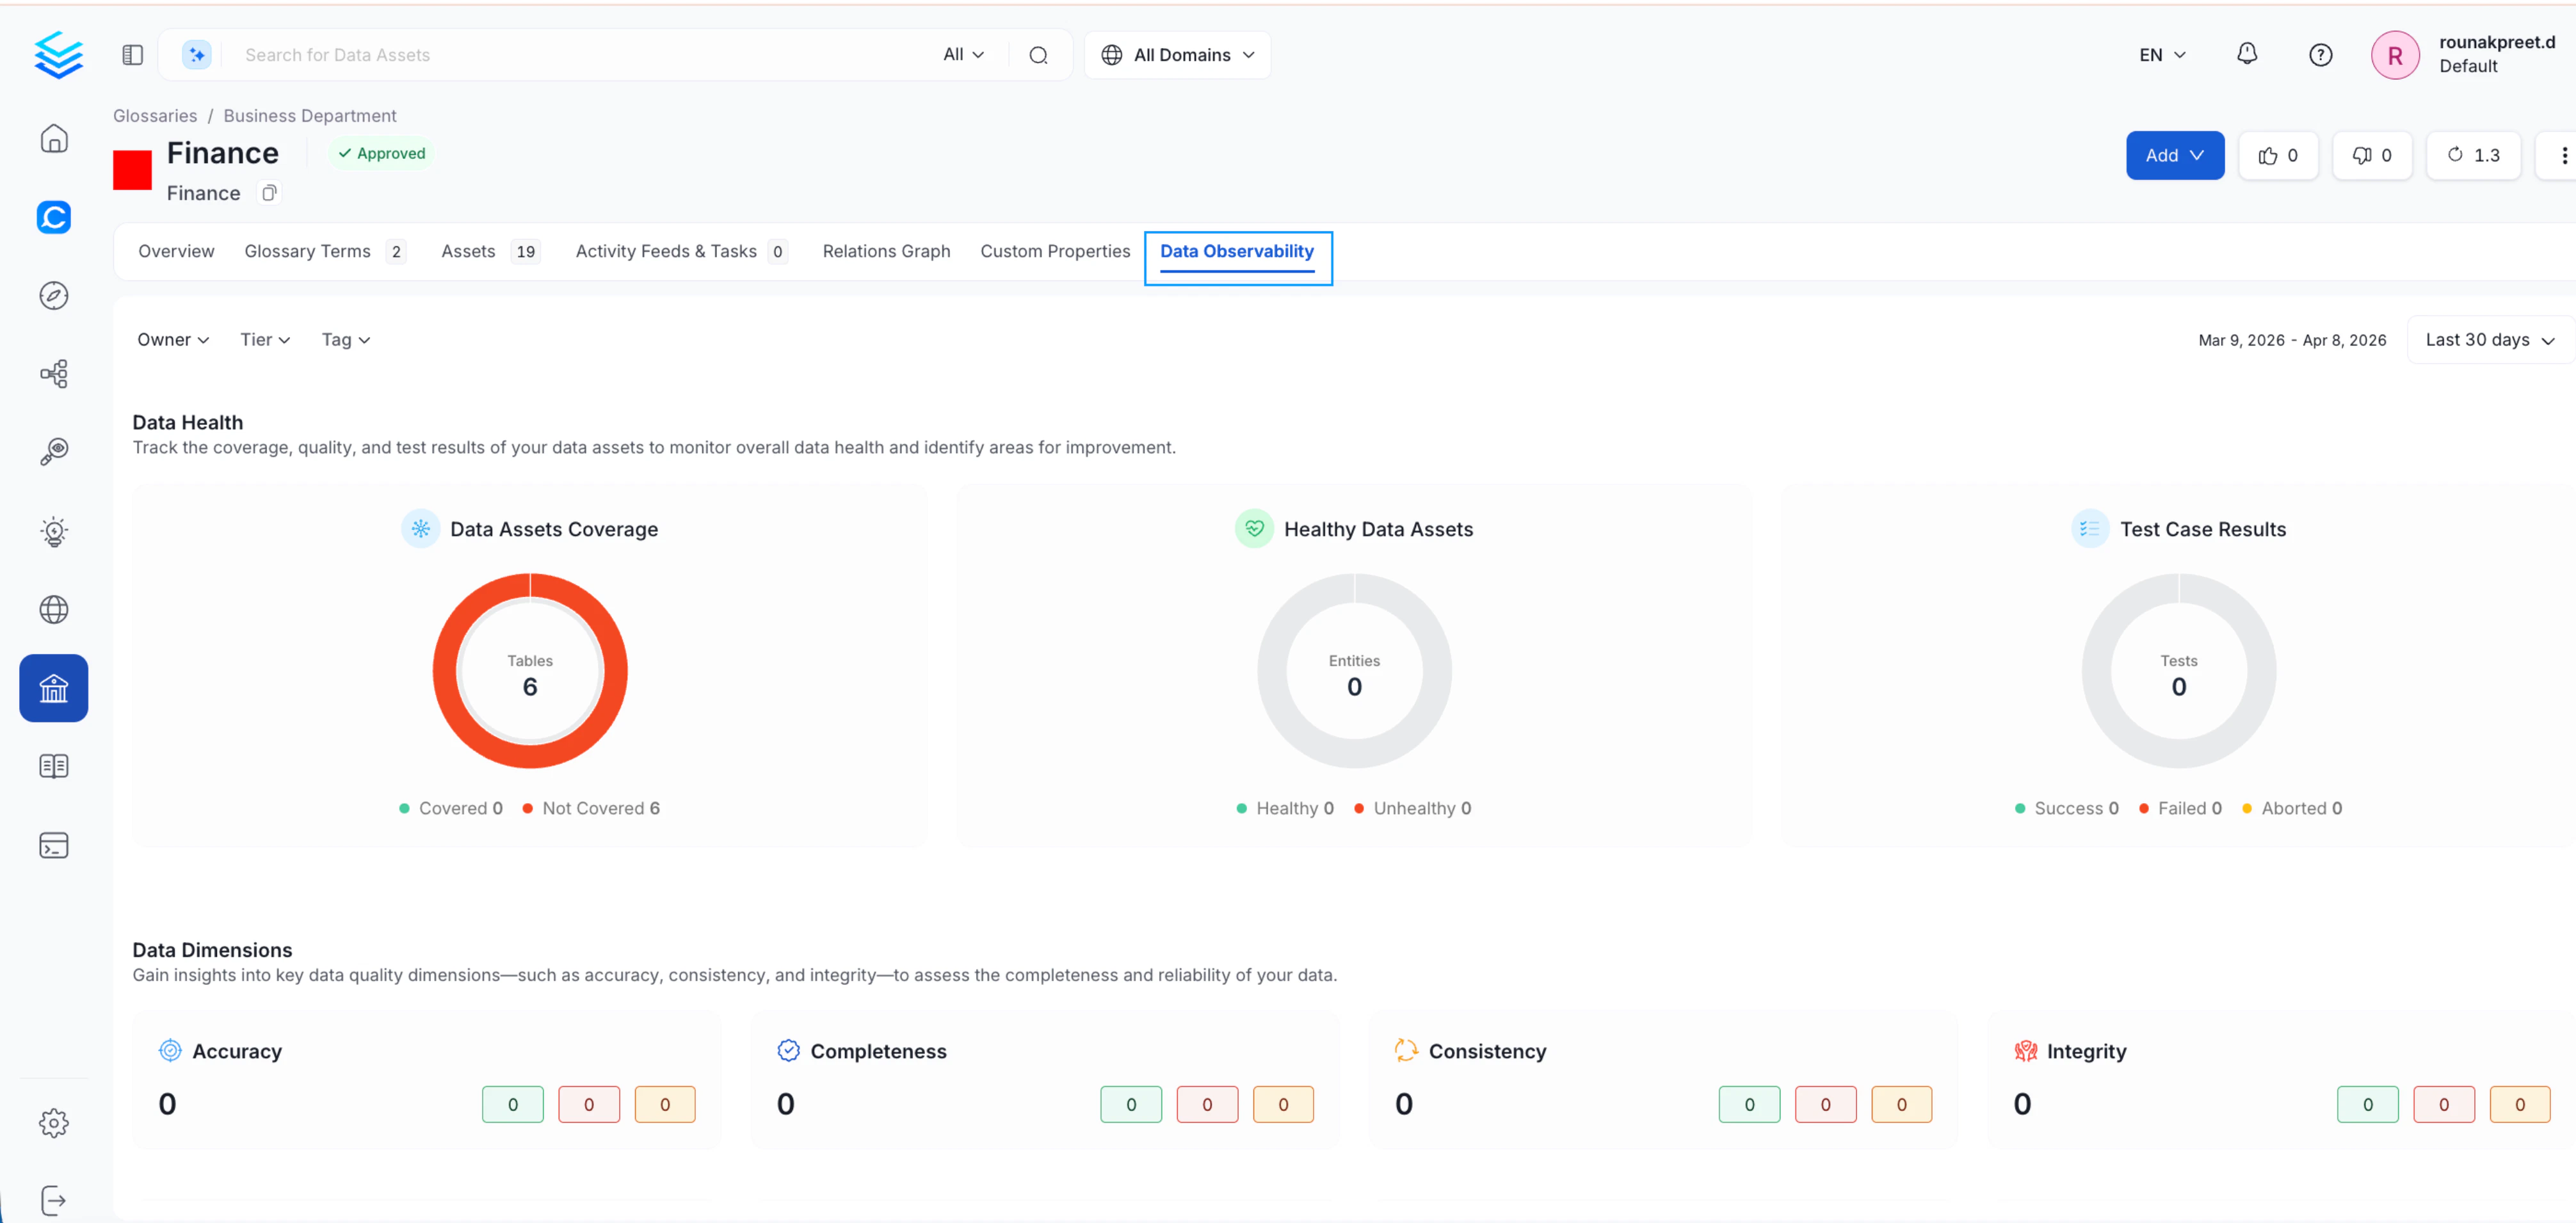
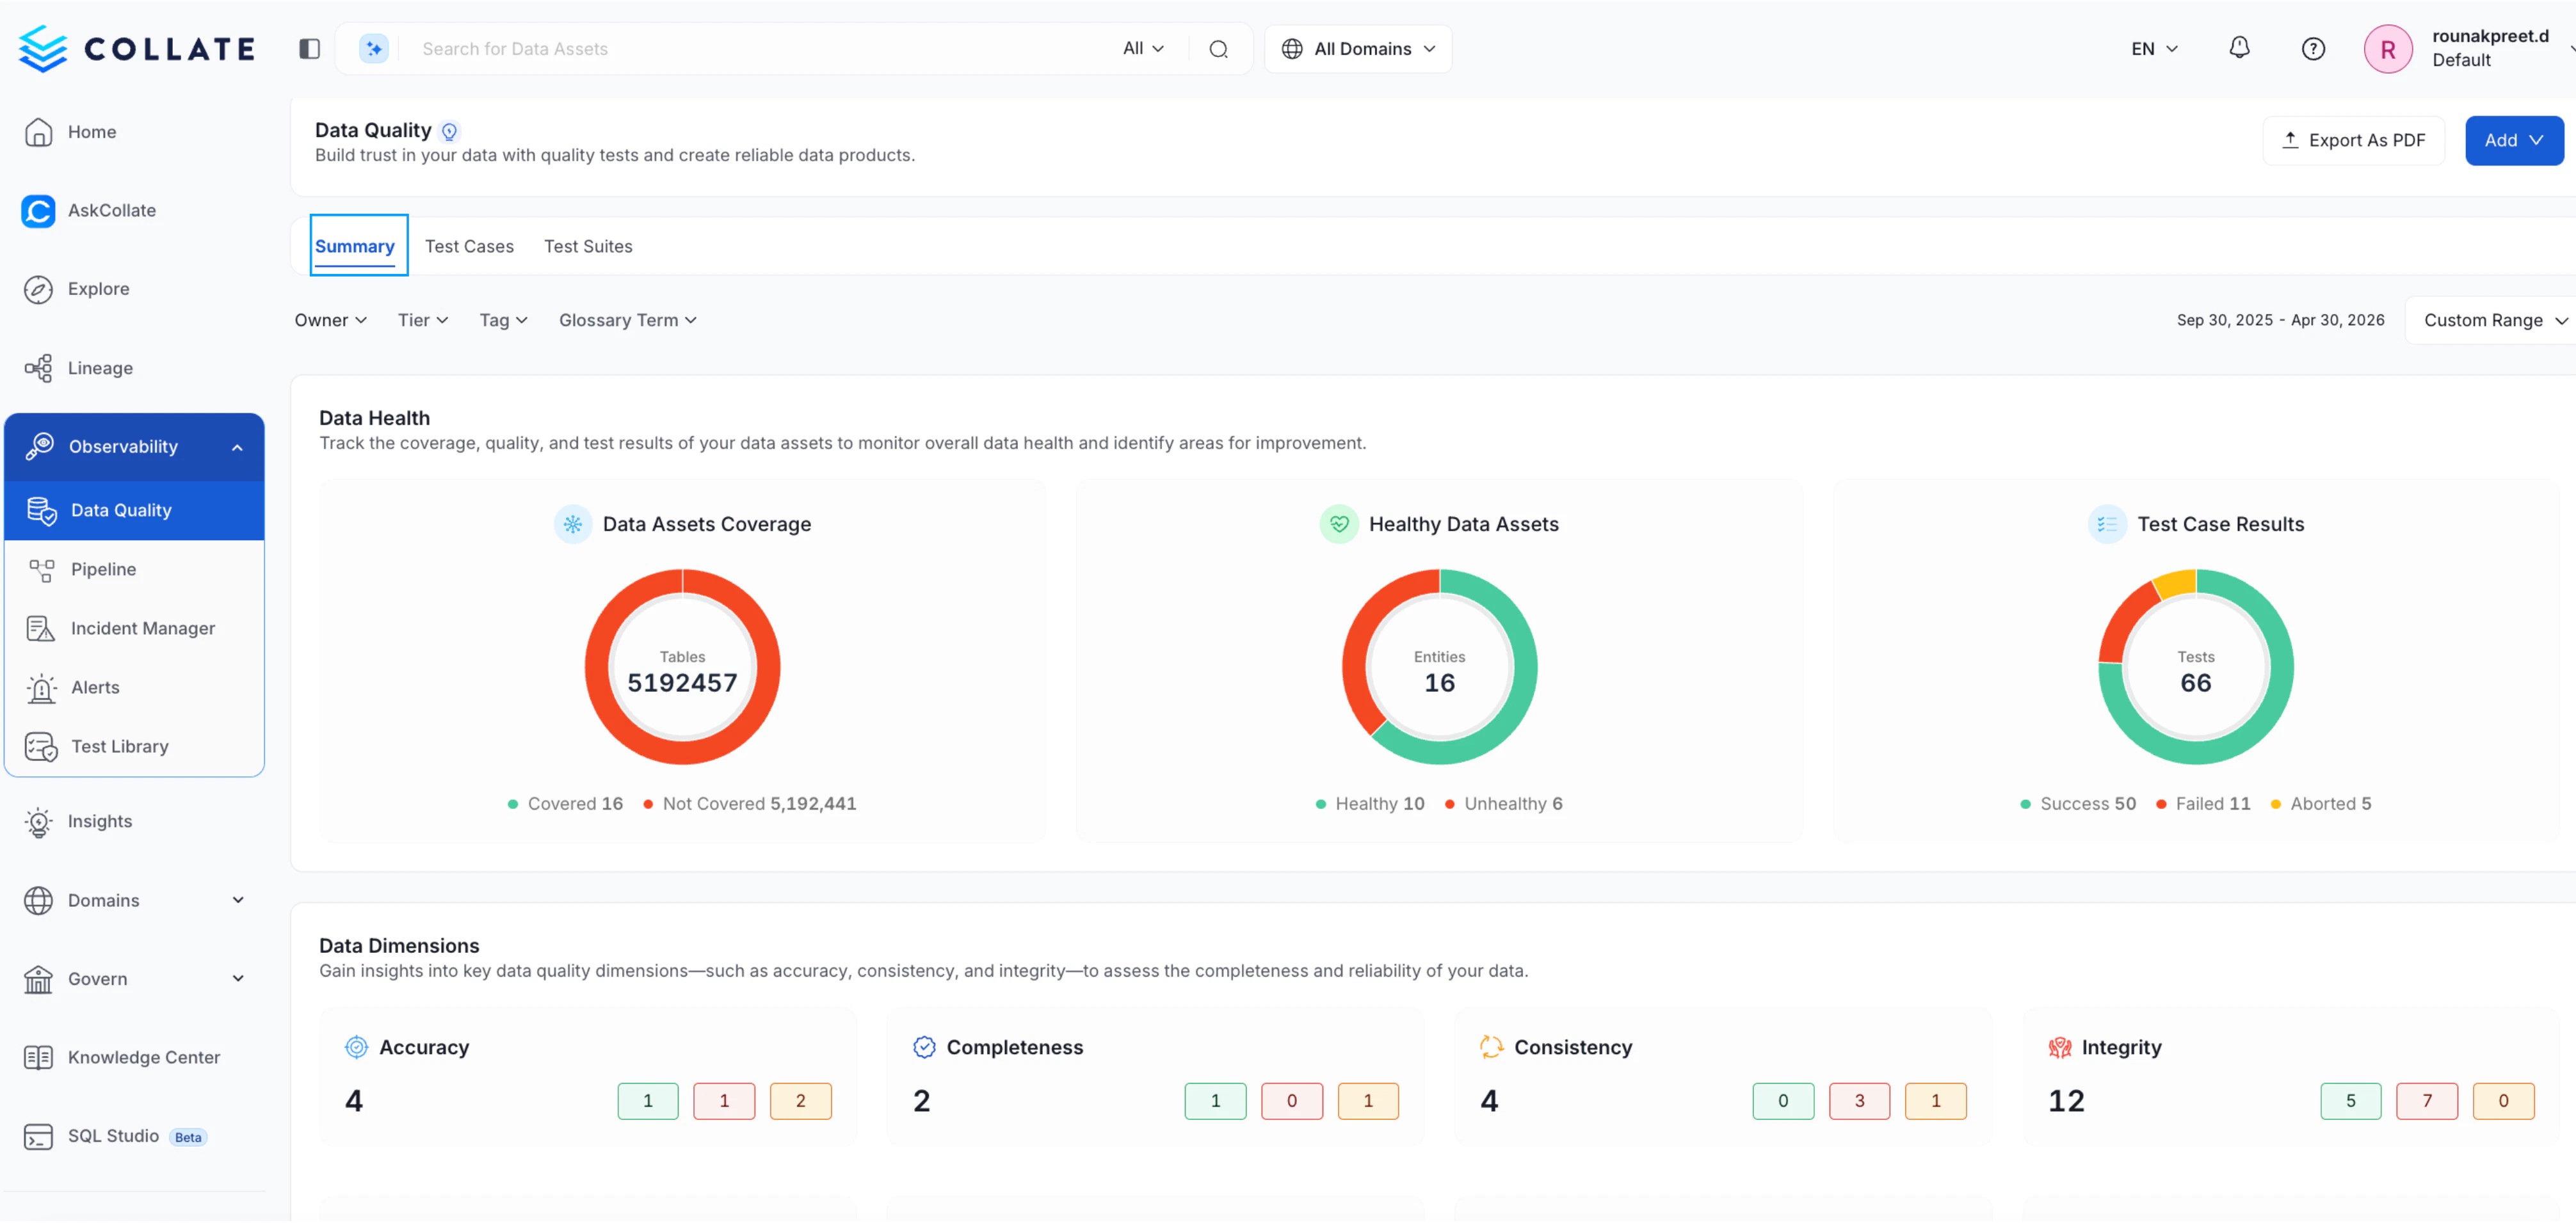 ### Data Health
Understand the overall state of your data assets, including:
* **Data Assets Coverage** — Total assets tracked vs. those not yet covered
* **Healthy Data Assets** — Count of assets passing their quality checks
* **Test Case Results** — Breakdown of successful, failed, and aborted test cases
### Data Health
Understand the overall state of your data assets, including:
* **Data Assets Coverage** — Total assets tracked vs. those not yet covered
* **Healthy Data Assets** — Count of assets passing their quality checks
* **Test Case Results** — Breakdown of successful, failed, and aborted test cases
 ### Data Dimensions
Analyze test results grouped by data quality dimensions such as Accuracy, Completeness, Consistency, and Integrity, helping you identify specific areas of concern.
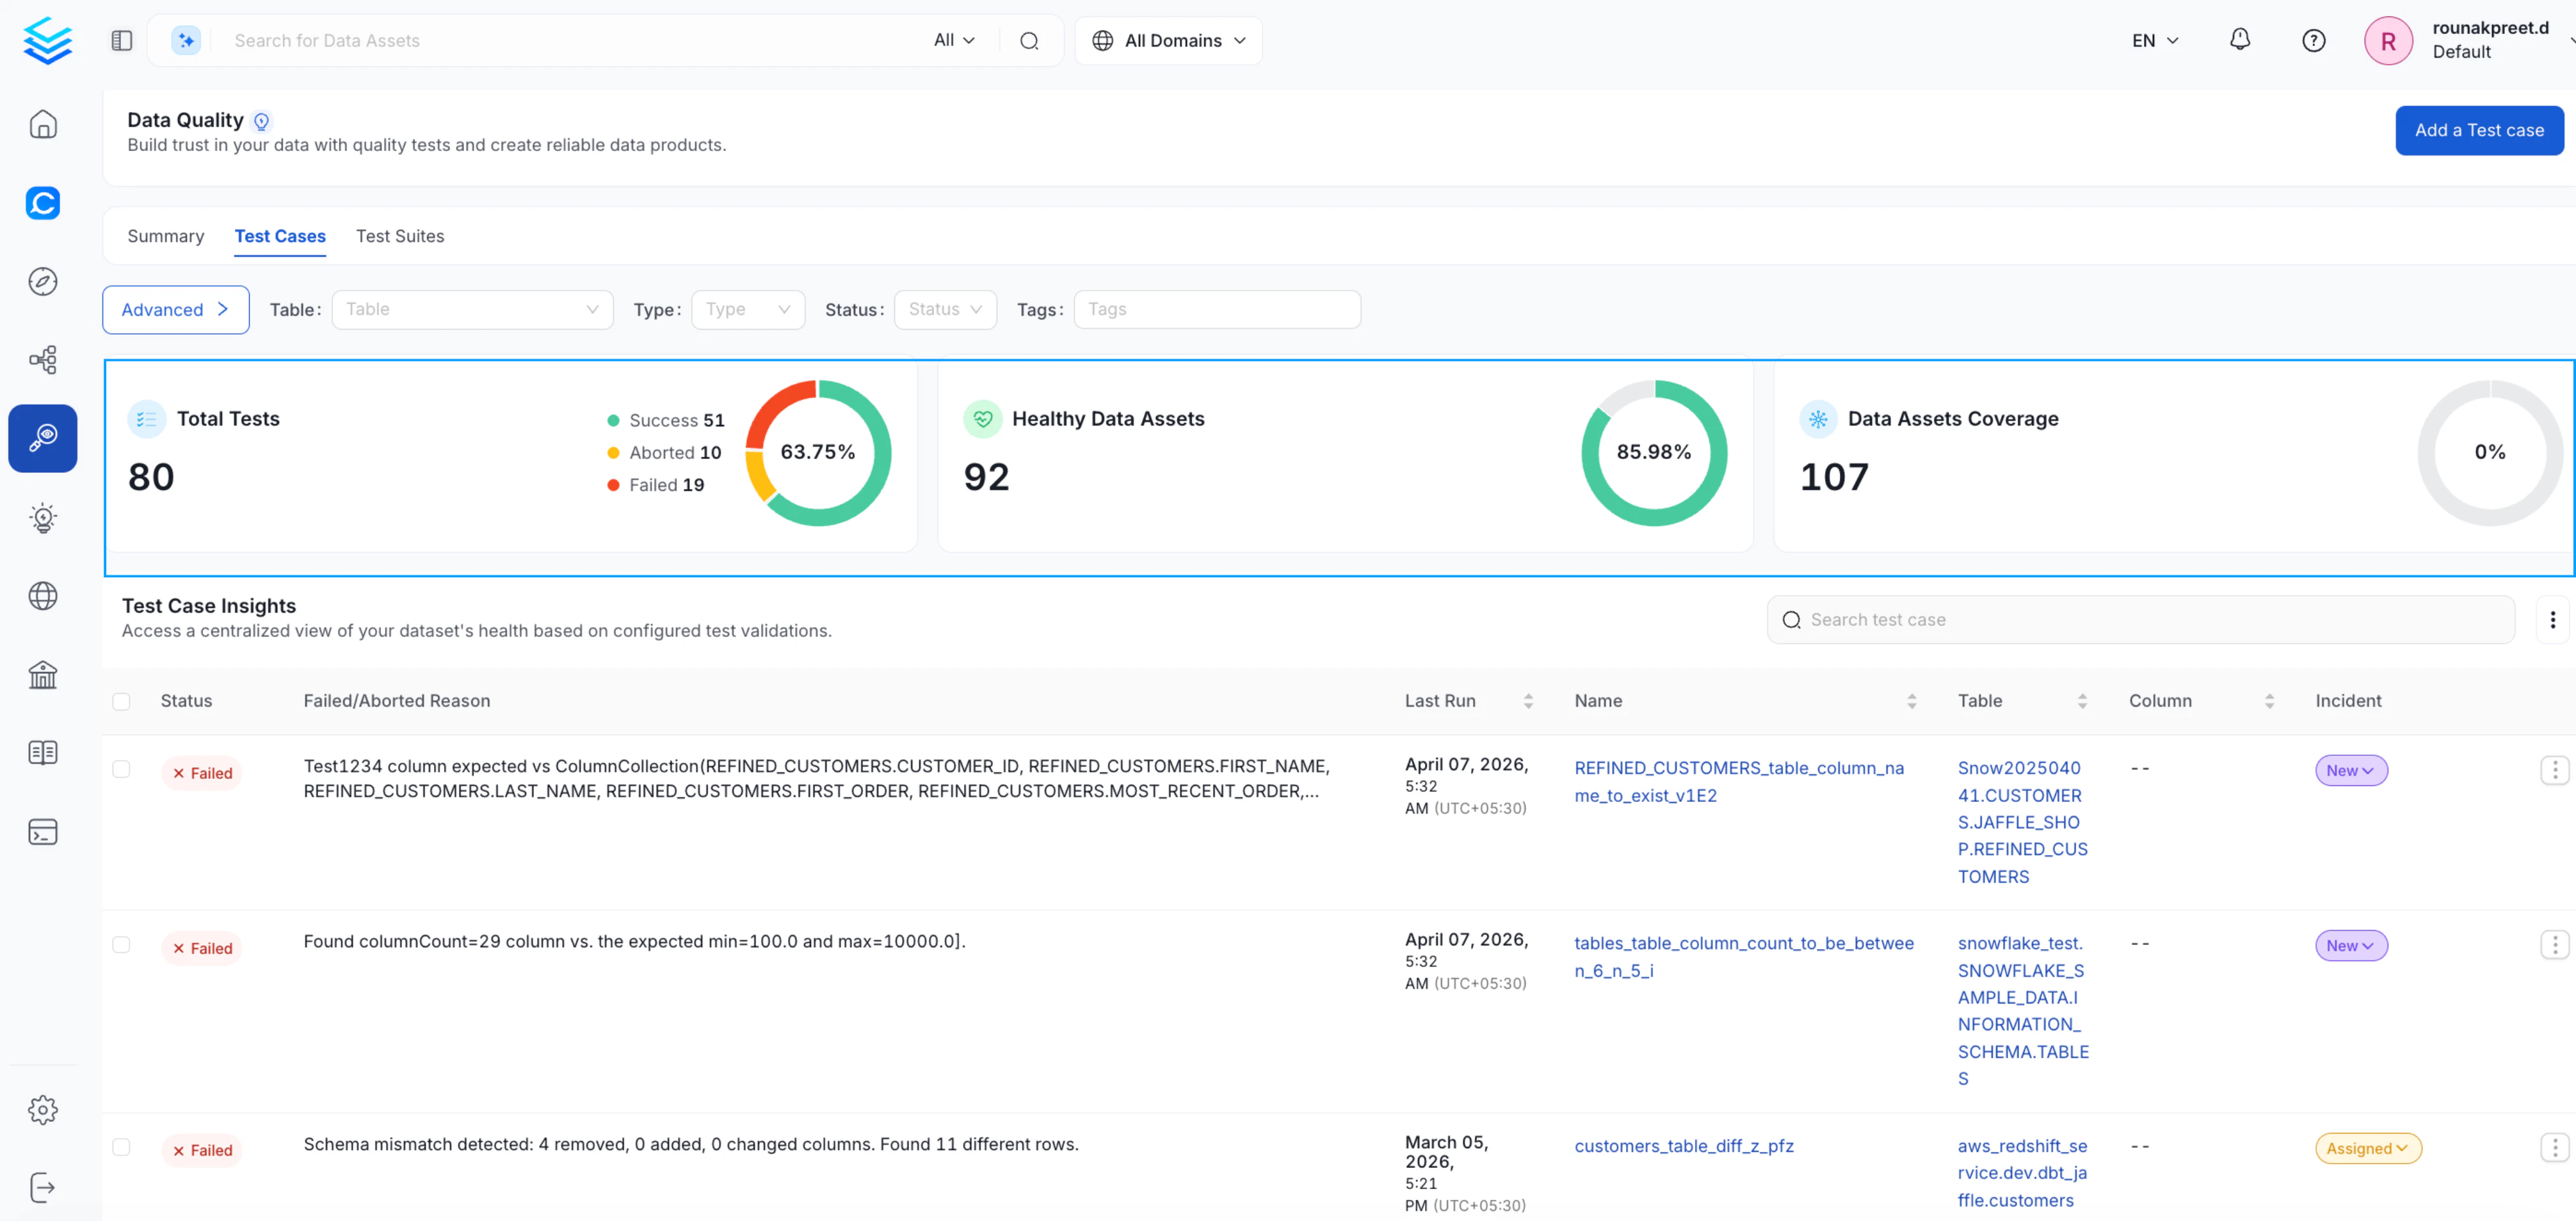
### Test Cases Tab
Switch to the **Test Cases** tab for a consolidated view of individual test case health, including recent run results and asset-level insights.
### Data Dimensions
Analyze test results grouped by data quality dimensions such as Accuracy, Completeness, Consistency, and Integrity, helping you identify specific areas of concern.
### Test Cases Tab
Switch to the **Test Cases** tab for a consolidated view of individual test case health, including recent run results and asset-level insights.
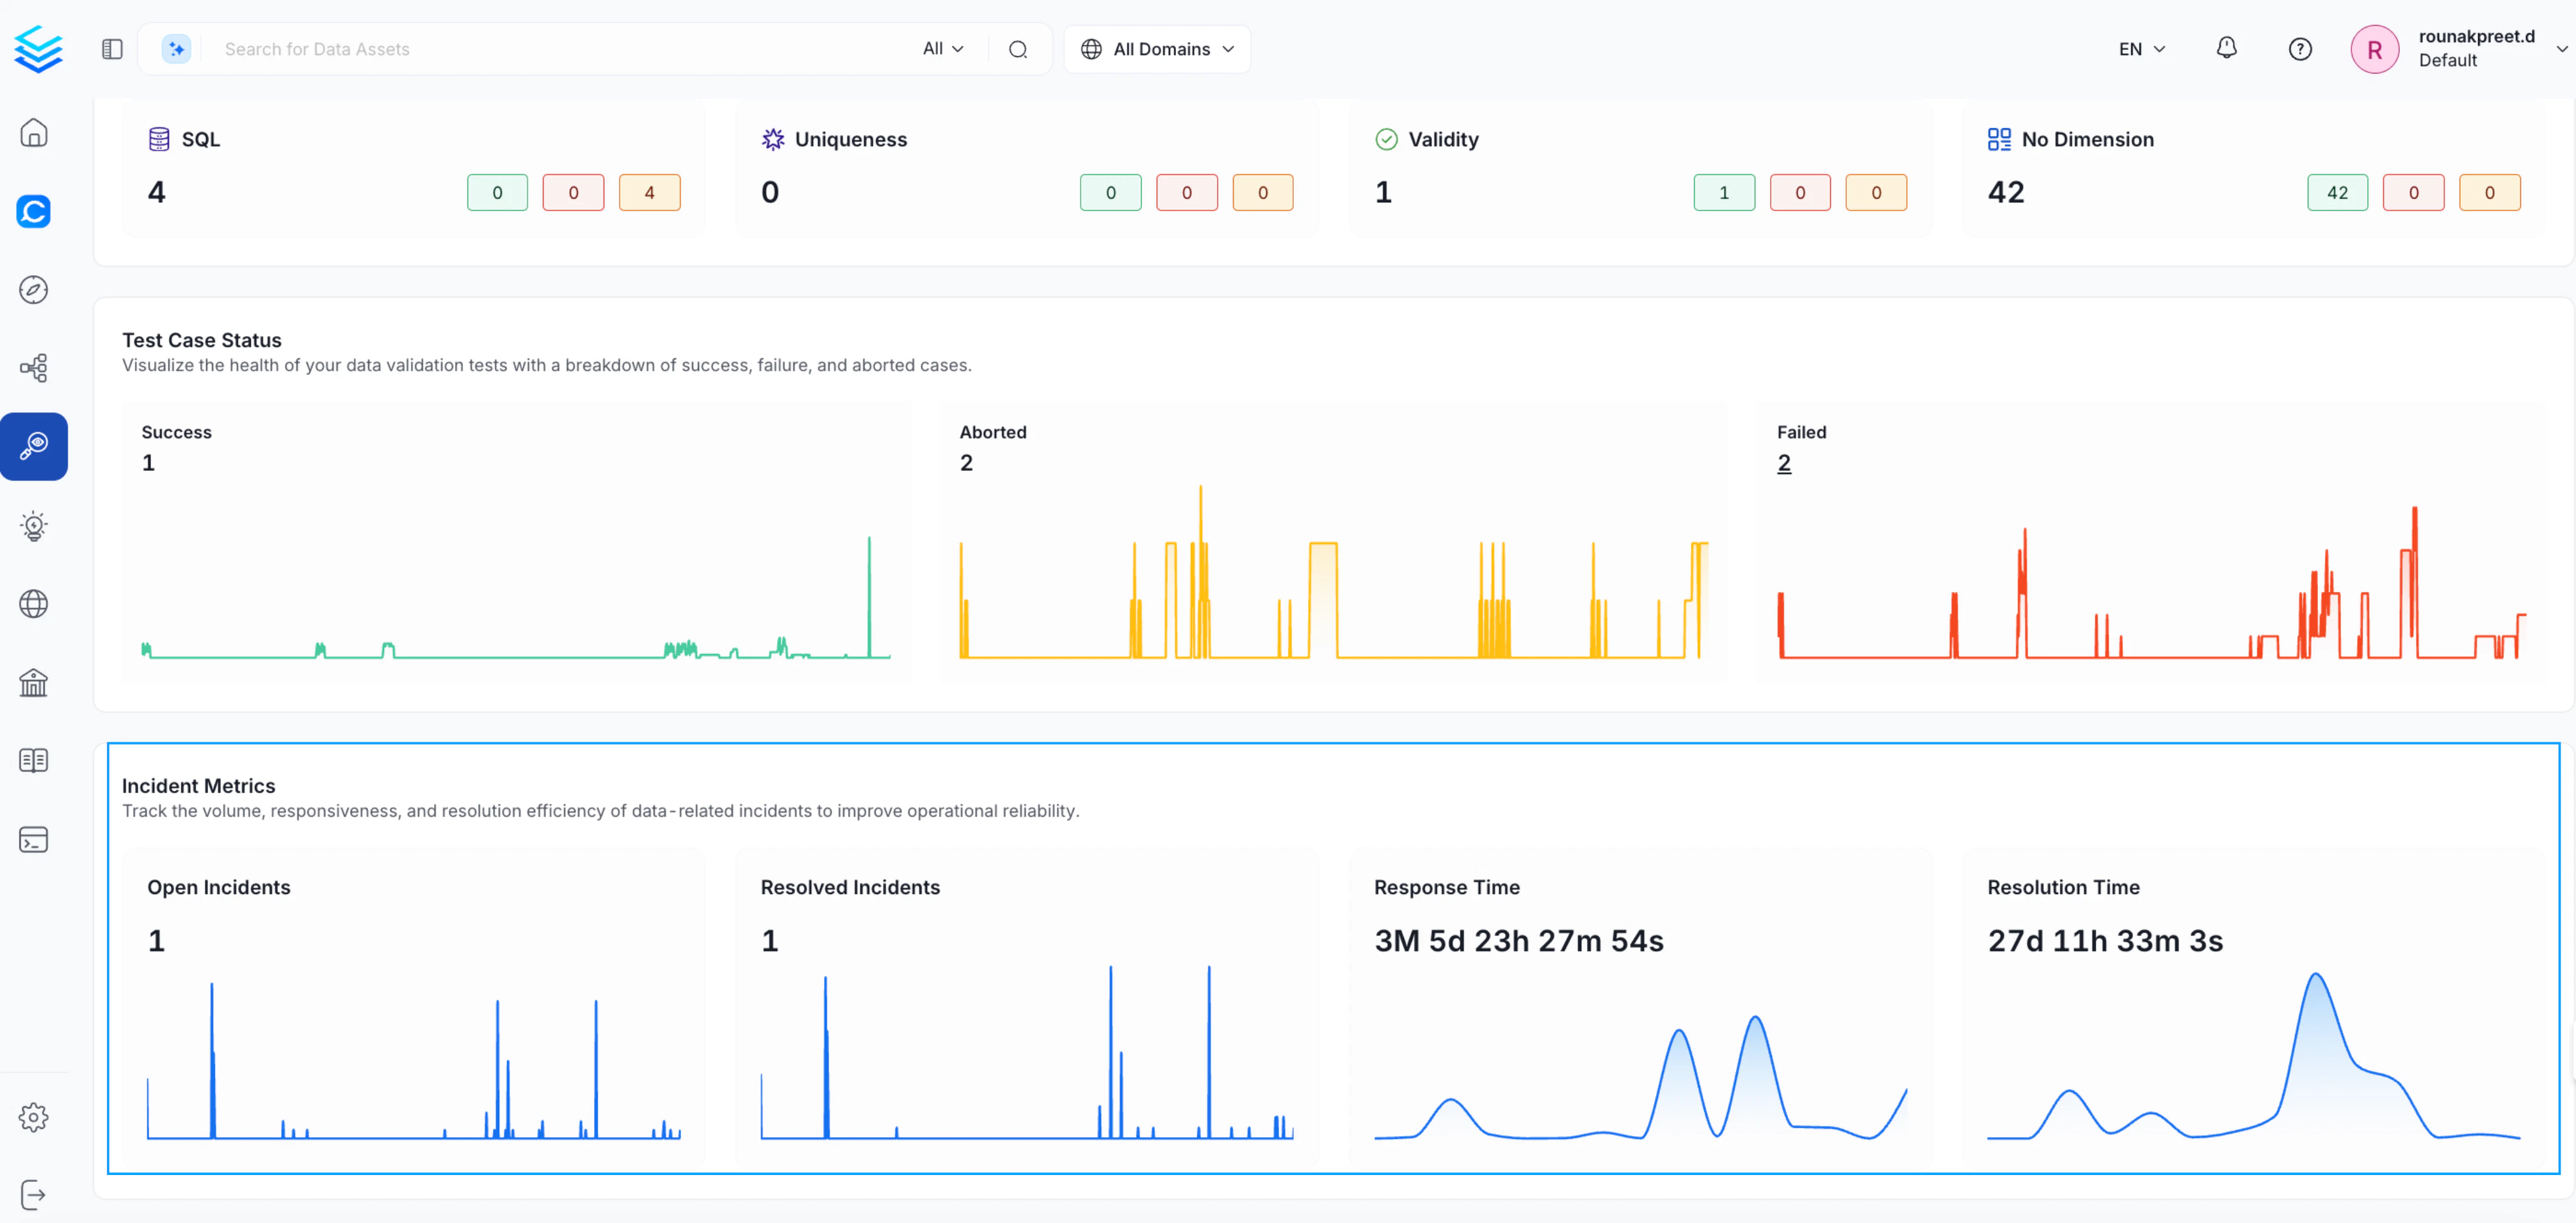
 ### Test Case Status
Track how your test cases are performing over time with trend charts for:
* **Successful** tests
* **Aborted** executions
* **Failed** tests
Use these trends to detect recurring issues and monitor improvements.
### Test Case Status
Track how your test cases are performing over time with trend charts for:
* **Successful** tests
* **Aborted** executions
* **Failed** tests
Use these trends to detect recurring issues and monitor improvements.
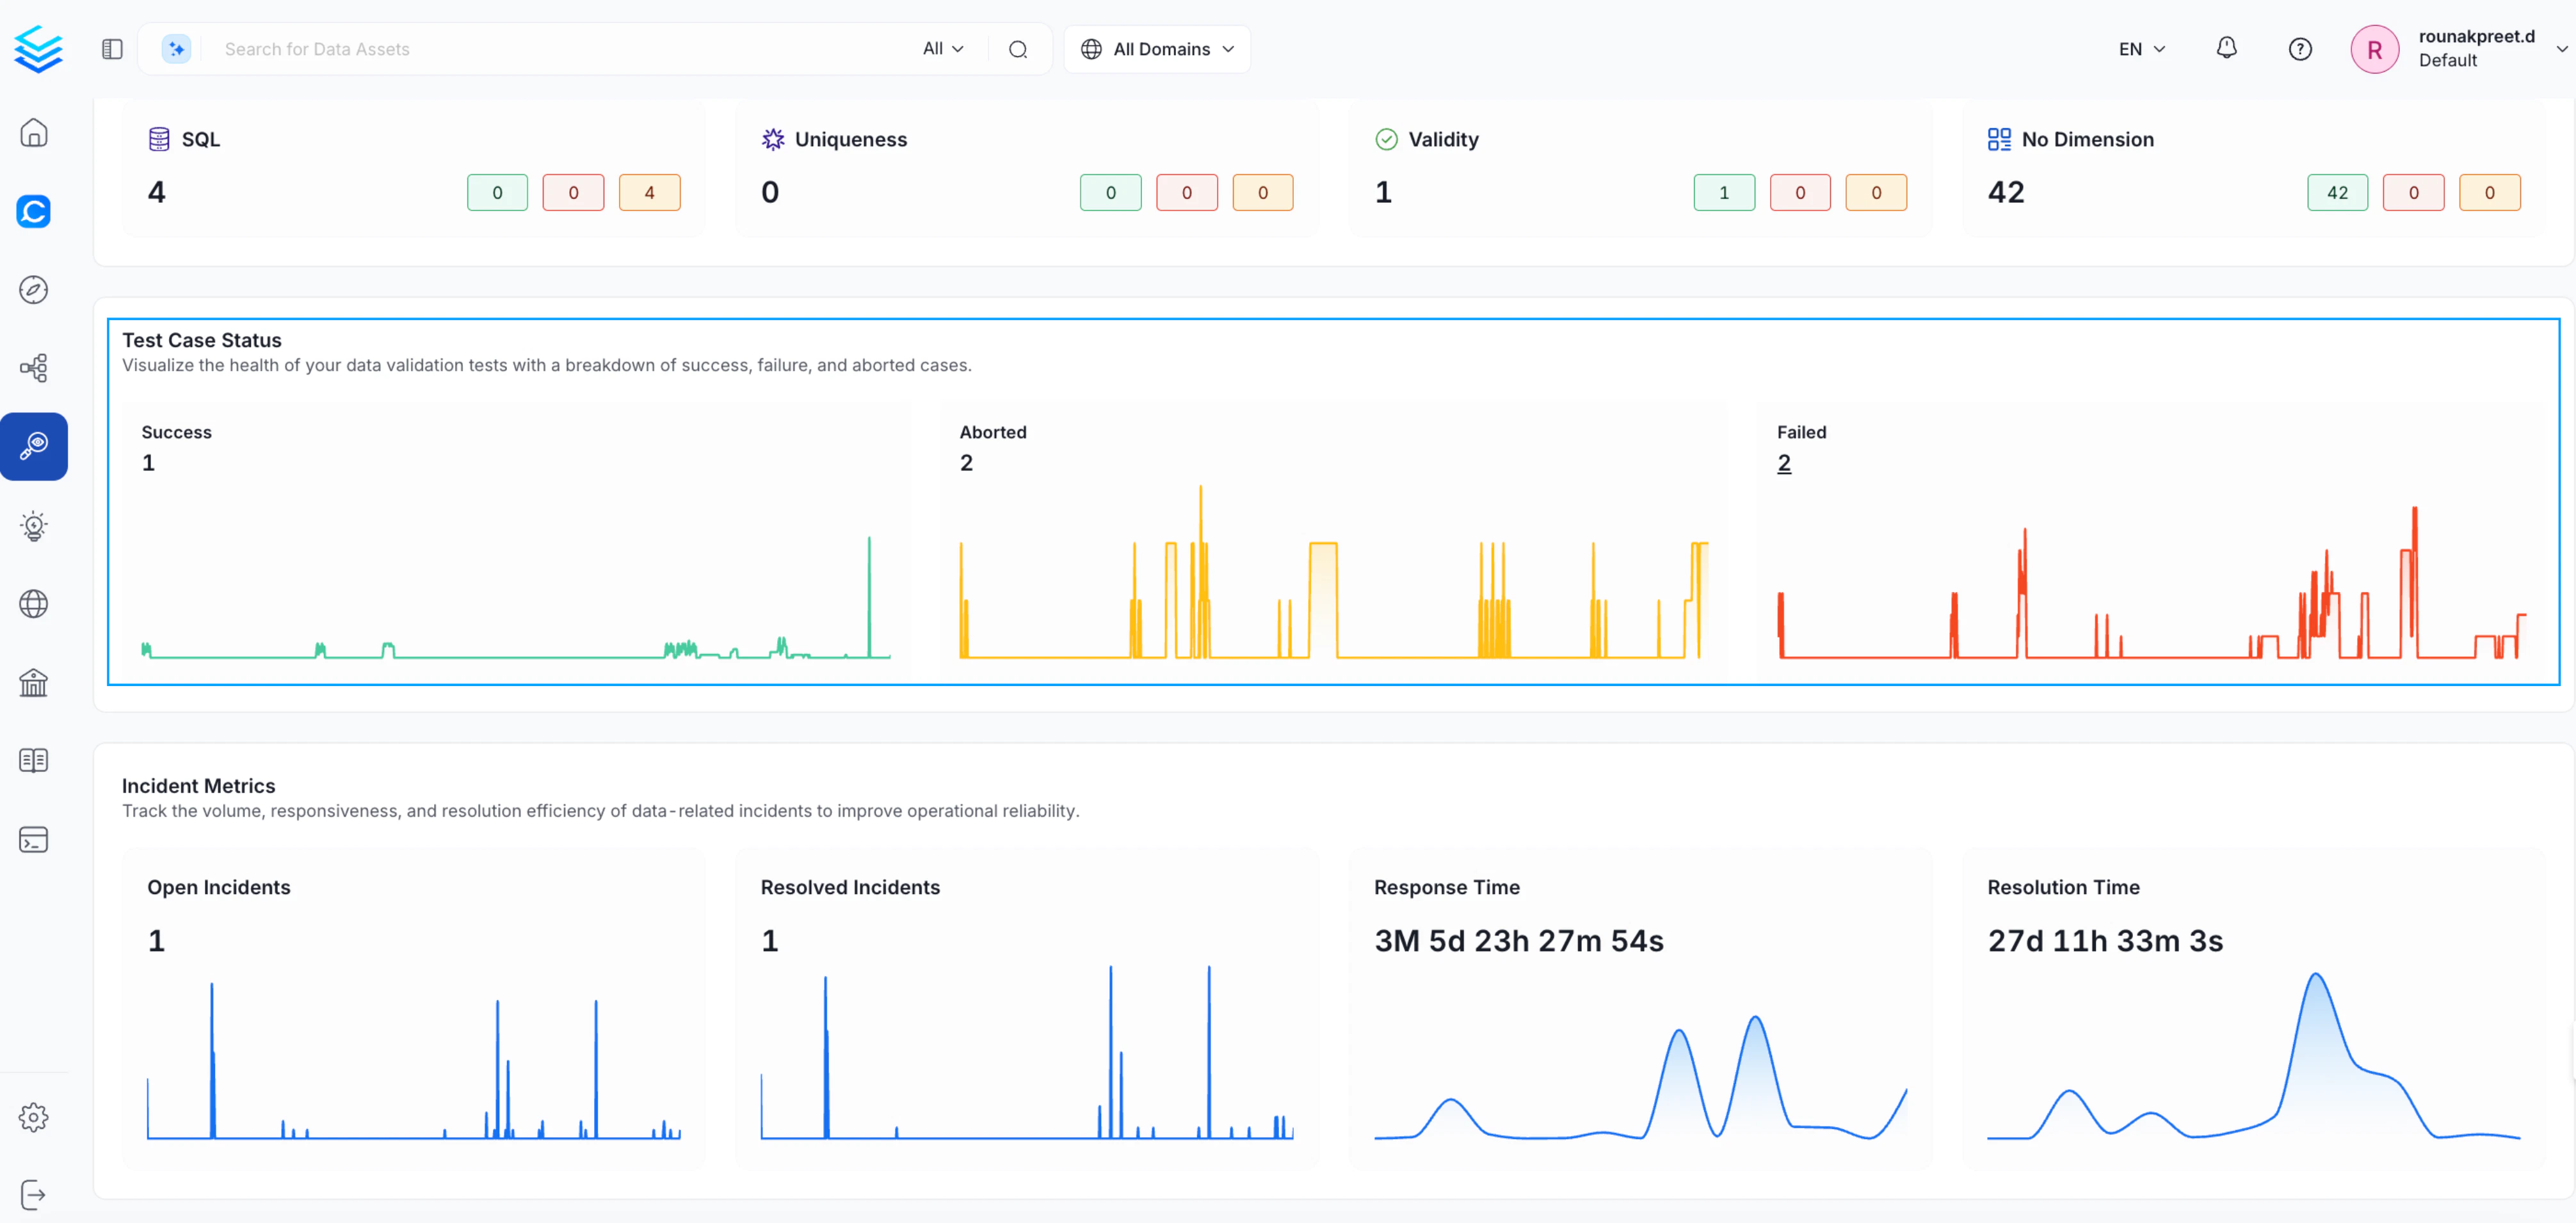 ### Incident Metrics
Monitor how data issues are being handled across the platform:
* **Open Incidents** — Active unresolved data incidents
* **Resolved Incidents** — Issues that have been closed
* **Response Time** — How quickly incidents are acknowledged
* **Resolution Time** — How long incidents take to resolve
This helps you measure operational efficiency and improve incident management.
### Incident Metrics
Monitor how data issues are being handled across the platform:
* **Open Incidents** — Active unresolved data incidents
* **Resolved Incidents** — Issues that have been closed
* **Response Time** — How quickly incidents are acknowledged
* **Resolution Time** — How long incidents take to resolve
This helps you measure operational efficiency and improve incident management.
 ## Apply Filters
Refine the dashboard view using the following filters to focus on the assets most relevant to you:
| Filter | Description |
| ----------------- | ------------------------------------------------------------------------------------------------------- |
| **Owner** | Filter by responsible users or teams |
| **Tier** | Focus on critical vs. non-critical assets |
| **Certification** | Filter by certification level — Bronze, Silver, or Gold |
| **Tag** | Narrow down by data classification or labels (excludes Certification tags, which have their own filter) |
| **Glossary Term** | Analyze by business context |
| **Date Range** | Track trends over a specific period |
## Apply Filters
Refine the dashboard view using the following filters to focus on the assets most relevant to you:
| Filter | Description |
| ----------------- | ------------------------------------------------------------------------------------------------------- |
| **Owner** | Filter by responsible users or teams |
| **Tier** | Focus on critical vs. non-critical assets |
| **Certification** | Filter by certification level — Bronze, Silver, or Gold |
| **Tag** | Narrow down by data classification or labels (excludes Certification tags, which have their own filter) |
| **Glossary Term** | Analyze by business context |
| **Date Range** | Track trends over a specific period |
 ## Data Observability Across Entities
In addition to the platform-level dashboard, **Domain**, **Tag**, and **Glossary Term** pages each include a **Data Observability** tab. This tab reuses the same dashboard with filters automatically applied to the selected entity, letting you analyze data quality in a specific context without manually setting filters.
## Data Observability Across Entities
In addition to the platform-level dashboard, **Domain**, **Tag**, and **Glossary Term** pages each include a **Data Observability** tab. This tab reuses the same dashboard with filters automatically applied to the selected entity, letting you analyze data quality in a specific context without manually setting filters.
 ## Table-Level Observability
For deeper analysis at the dataset level, Collate provides enhanced observability on individual tables:
* A **Data Observability** section scoped to the table
* An **Overview** tab that includes:
* Open incidents
* Upstream failures
* Quick access to lineage
* Links to incident investigation
This helps you move quickly from identifying an issue to understanding and resolving its root cause.
## Table-Level Observability
For deeper analysis at the dataset level, Collate provides enhanced observability on individual tables:
* A **Data Observability** section scoped to the table
* An **Overview** tab that includes:
* Open incidents
* Upstream failures
* Quick access to lineage
* Links to incident investigation
This helps you move quickly from identifying an issue to understanding and resolving its root cause.