> ## Documentation Index
> Fetch the complete documentation index at: https://docs.getcollate.io/llms.txt
> Use this file to discover all available pages before exploring further.
# Ontology Explorer | Collate Knowledge Graph Guide
> Visualize your Glossary as an interactive knowledge graph and explore the relationships between terms using the Ontology Explorer.
# Ontology Explorer
The **Ontology Explorer** renders your Glossary as an interactive graph, letting you visualize how terms relate to one another—parent/child hierarchies, related terms, and metrics—beyond what the flat Glossary list view can show.
## Accessing the Ontology Explorer
Reach the Ontology Explorer from the main navigation, or scoped to a single term from that term's page.
* In the left navigation menu, select **Govern** > **Ontology Explorer**.
* The same graph is also available scoped to a single term: open any **Glossary Term** and go to its **Relations Graph** tab.
 ## Reading the Graph
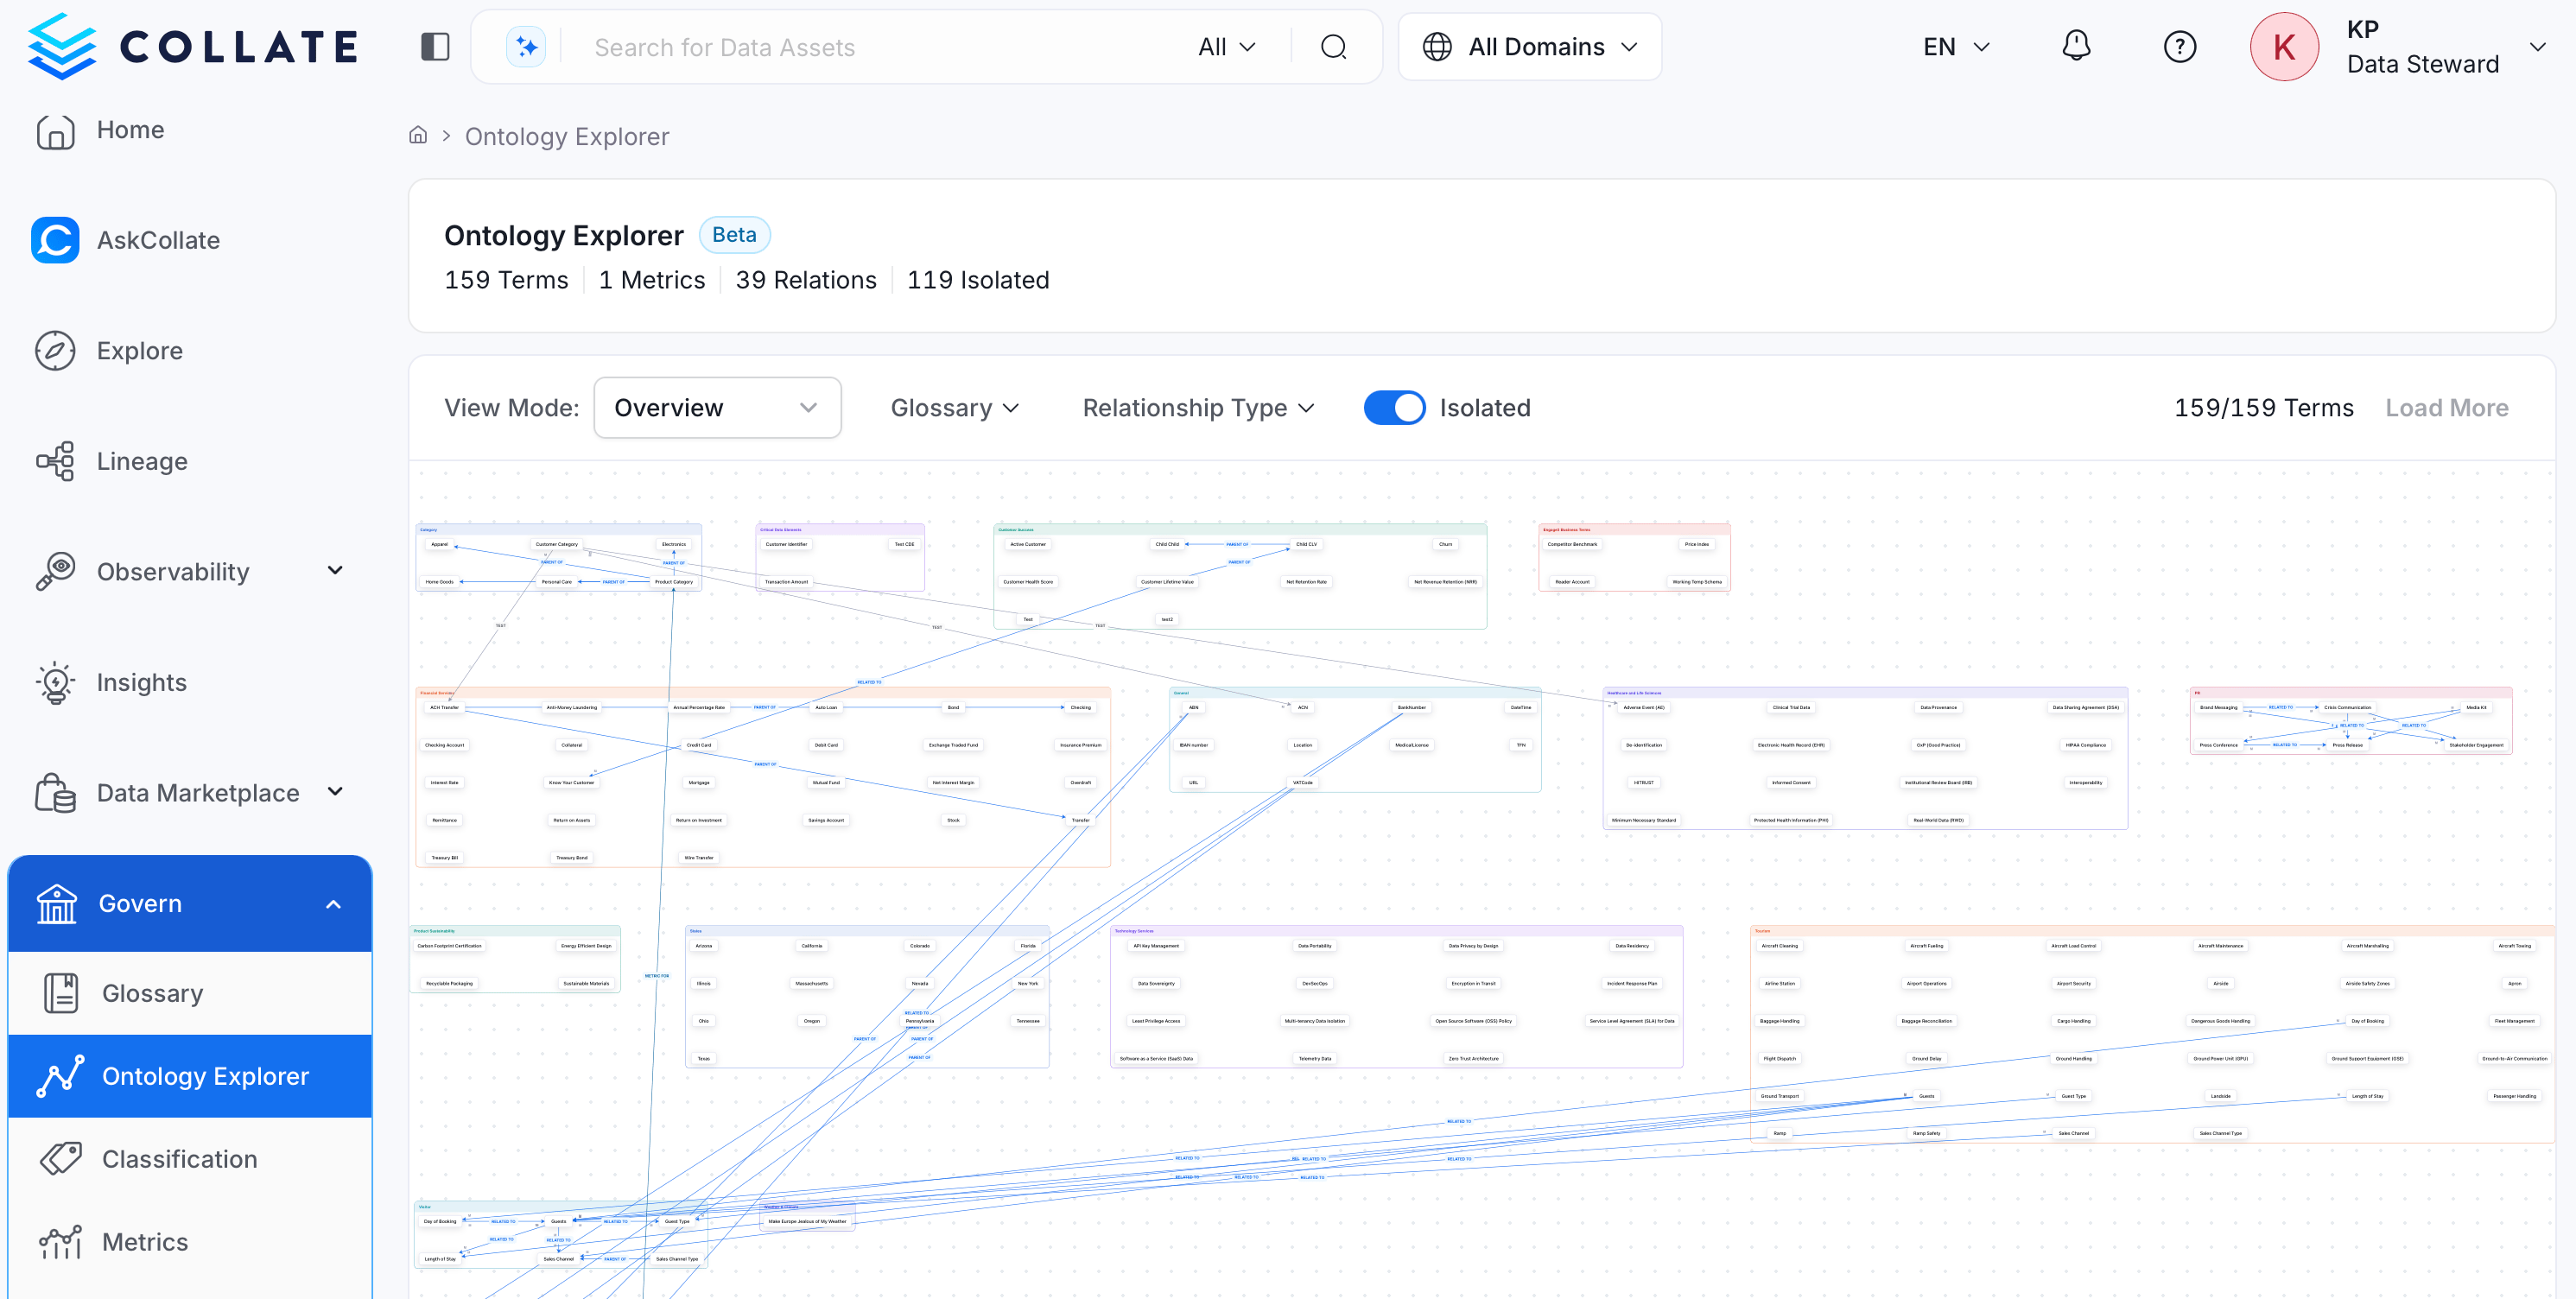
The graph page combines a summary bar with the term canvas itself.
* **Summary bar**: At the top of the page, Collate shows counts for **Terms**, **Metrics**, **Relations**, and **Isolated** terms—terms with no relationships to any other term.
* **Term clusters**: Collate groups terms into boxes by their parent glossary, each labeled and color-coded by glossary name.
* **Relationship edges**: Lines connect related terms across and within clusters, labeled with the relationship type—for example **PARENT OF** or **RELATED TO**.
* **Term details**: Select any term node to open a side panel with its details and relationships.
## Model and Data Views
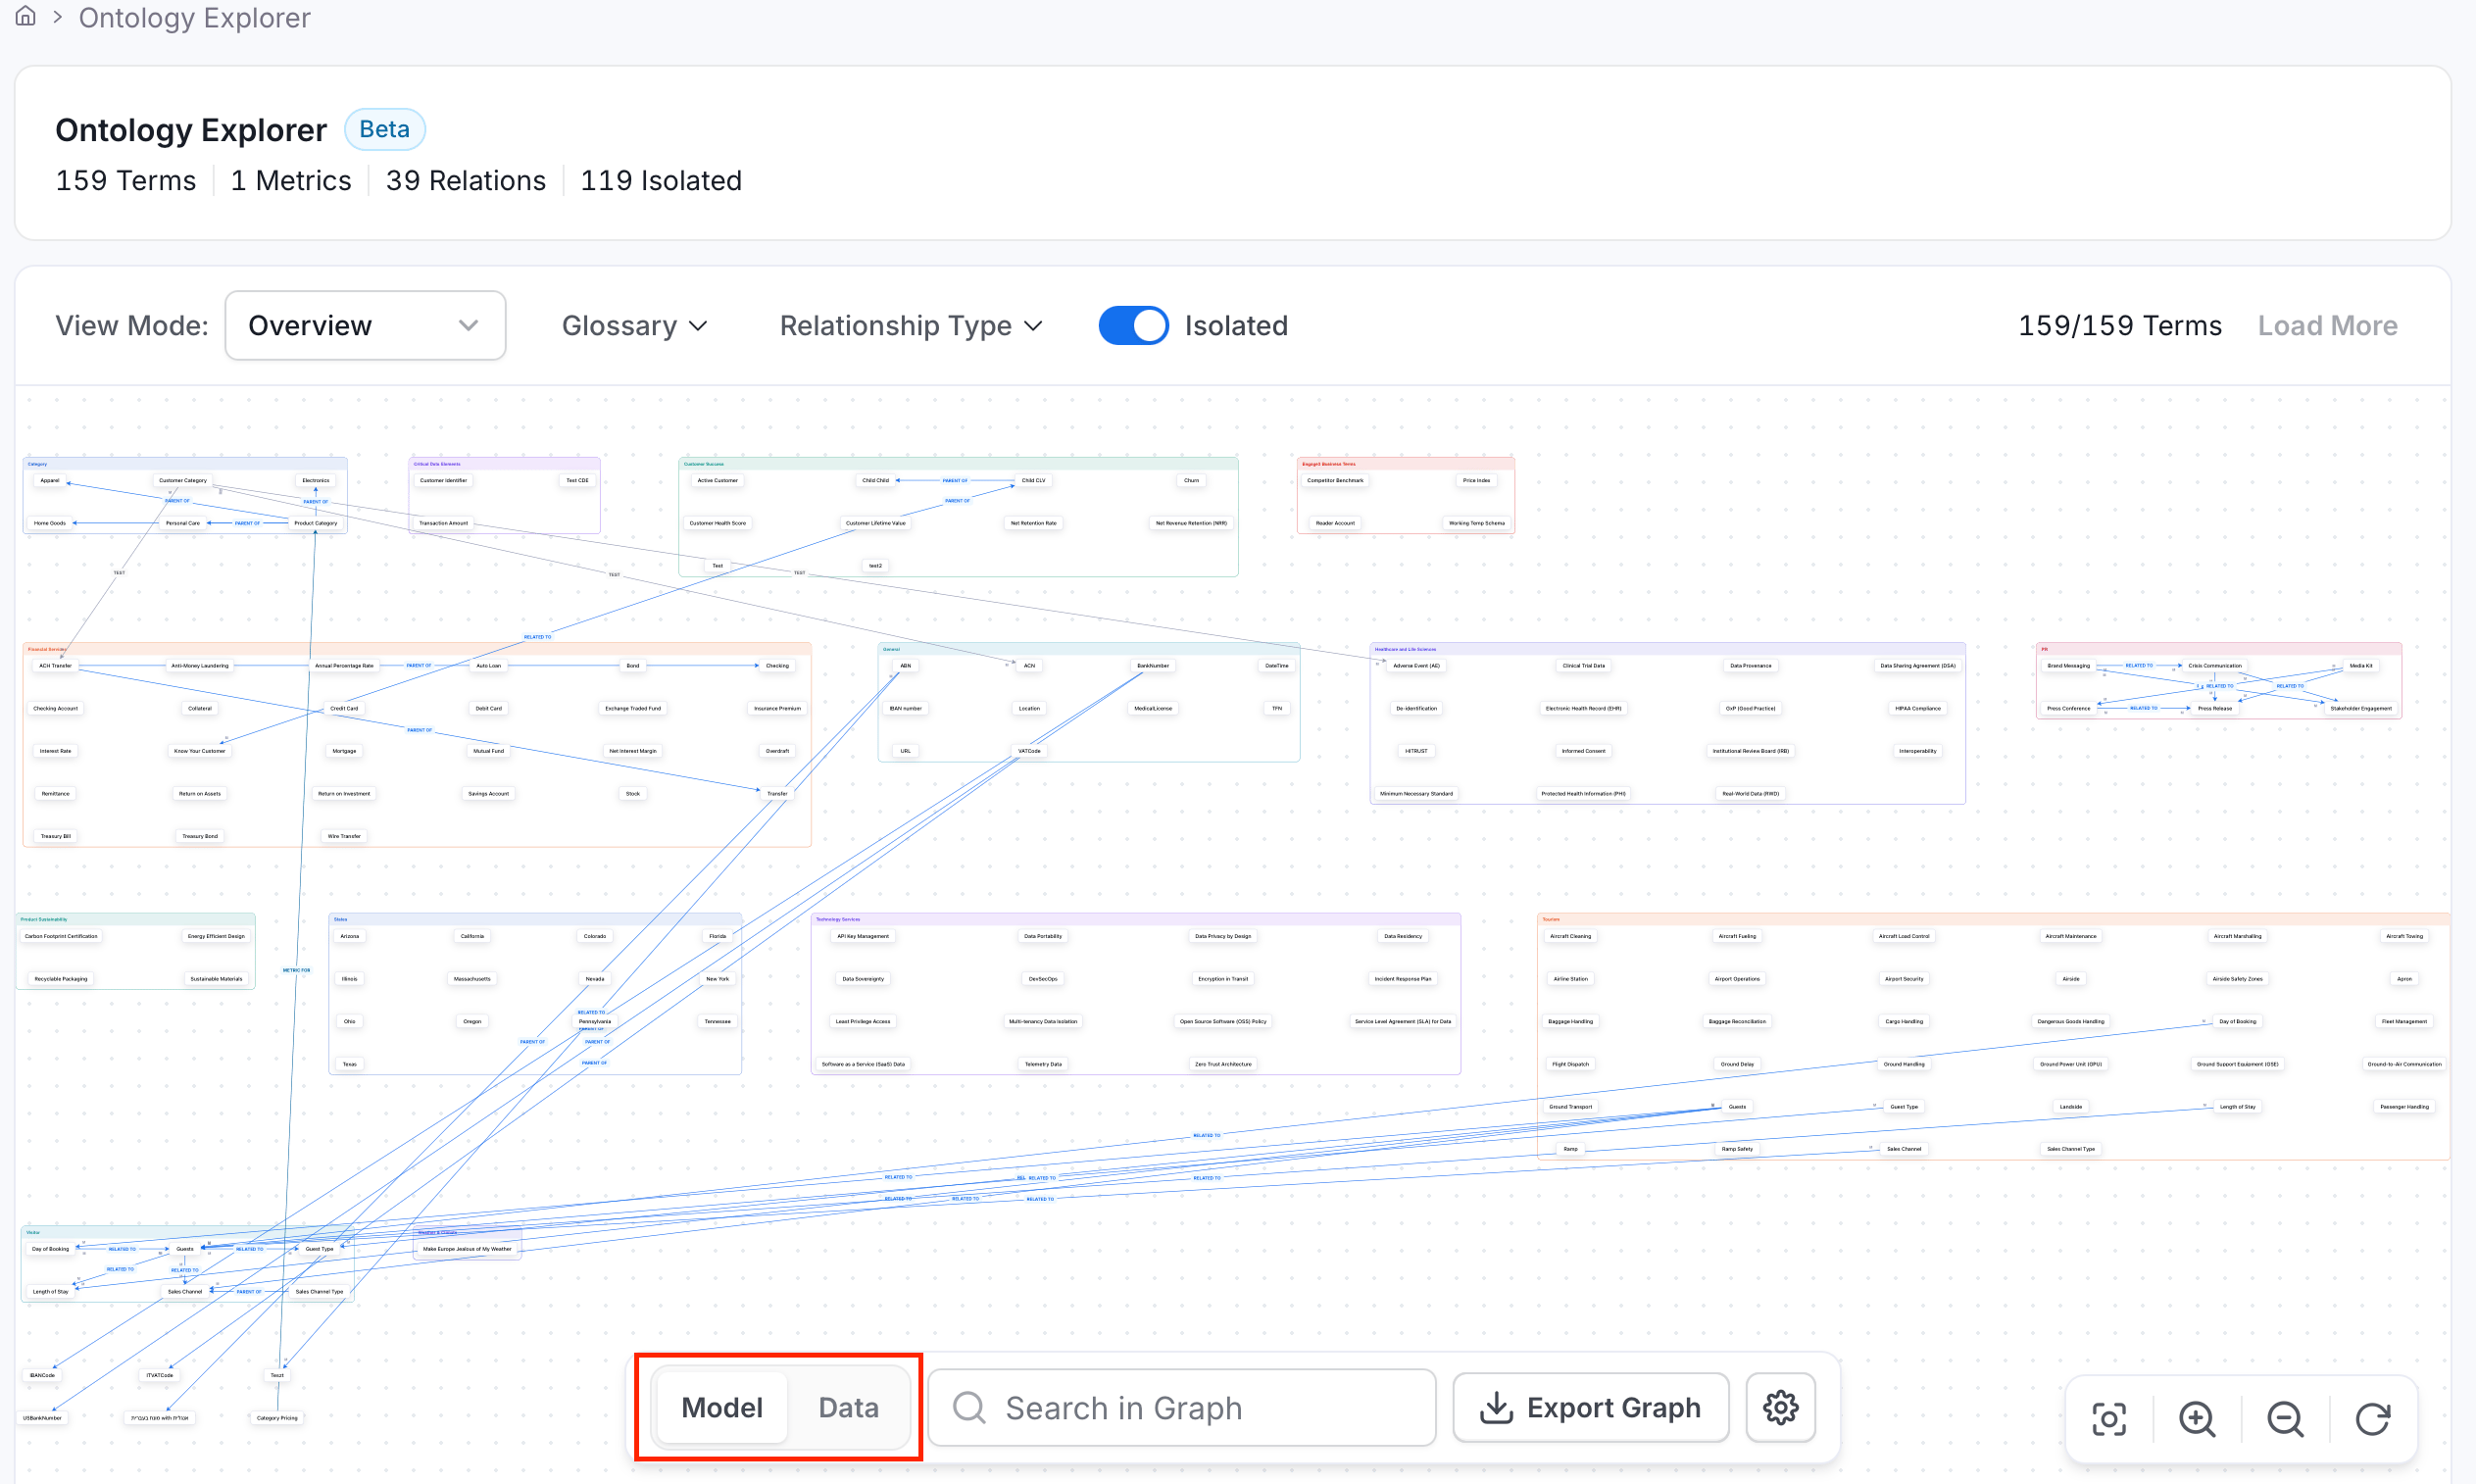
Use the **Model** / **Data** toggle below the graph to switch what the graph renders:
* **Model**: Shows the term-to-term ontology—how glossary terms relate to each other. The **View Mode**, **Isolated** toggle, and term pagination (**Load More**) described below only apply in this view.
* **Data**: Shows terms alongside the data assets tagged with them. Select a term node to expand it and load the assets (tables, dashboards, and so on) associated with that term.
## Reading the Graph
The graph page combines a summary bar with the term canvas itself.
* **Summary bar**: At the top of the page, Collate shows counts for **Terms**, **Metrics**, **Relations**, and **Isolated** terms—terms with no relationships to any other term.
* **Term clusters**: Collate groups terms into boxes by their parent glossary, each labeled and color-coded by glossary name.
* **Relationship edges**: Lines connect related terms across and within clusters, labeled with the relationship type—for example **PARENT OF** or **RELATED TO**.
* **Term details**: Select any term node to open a side panel with its details and relationships.
## Model and Data Views
Use the **Model** / **Data** toggle below the graph to switch what the graph renders:
* **Model**: Shows the term-to-term ontology—how glossary terms relate to each other. The **View Mode**, **Isolated** toggle, and term pagination (**Load More**) described below only apply in this view.
* **Data**: Shows terms alongside the data assets tagged with them. Select a term node to expand it and load the assets (tables, dashboards, and so on) associated with that term.
 ## View Modes
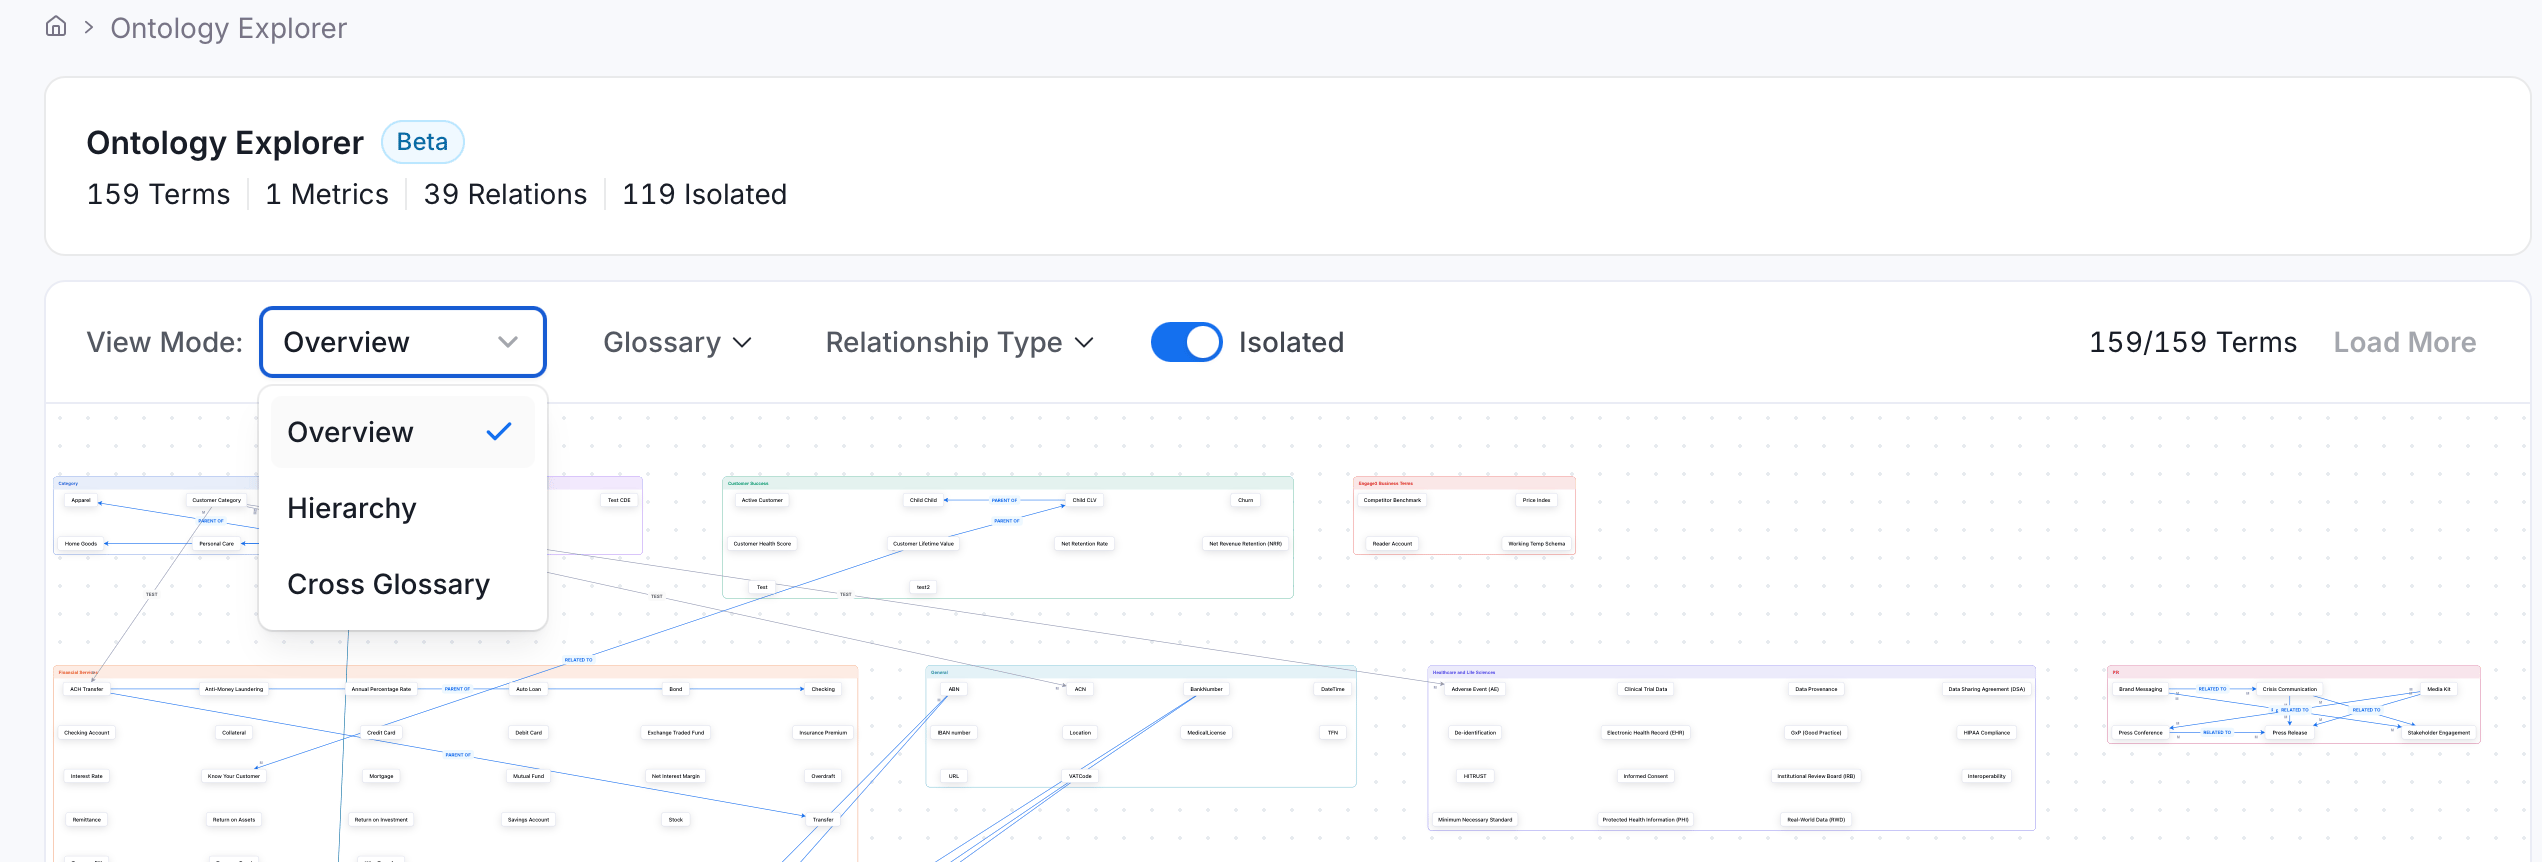
In **Model** view, use the **View Mode** dropdown to change how the graph is arranged:
* **Overview**: The default flat view showing all term clusters and their relationships.
* **Hierarchy**: Arranges terms by parent/child structure.
* **Cross Glossary**: Shows only relationships that cross glossary boundaries. The **Isolated** toggle is disabled in this mode, since Cross Glossary excludes isolated terms by definition.
## View Modes
In **Model** view, use the **View Mode** dropdown to change how the graph is arranged:
* **Overview**: The default flat view showing all term clusters and their relationships.
* **Hierarchy**: Arranges terms by parent/child structure.
* **Cross Glossary**: Shows only relationships that cross glossary boundaries. The **Isolated** toggle is disabled in this mode, since Cross Glossary excludes isolated terms by definition.
 ## Filtering the Graph
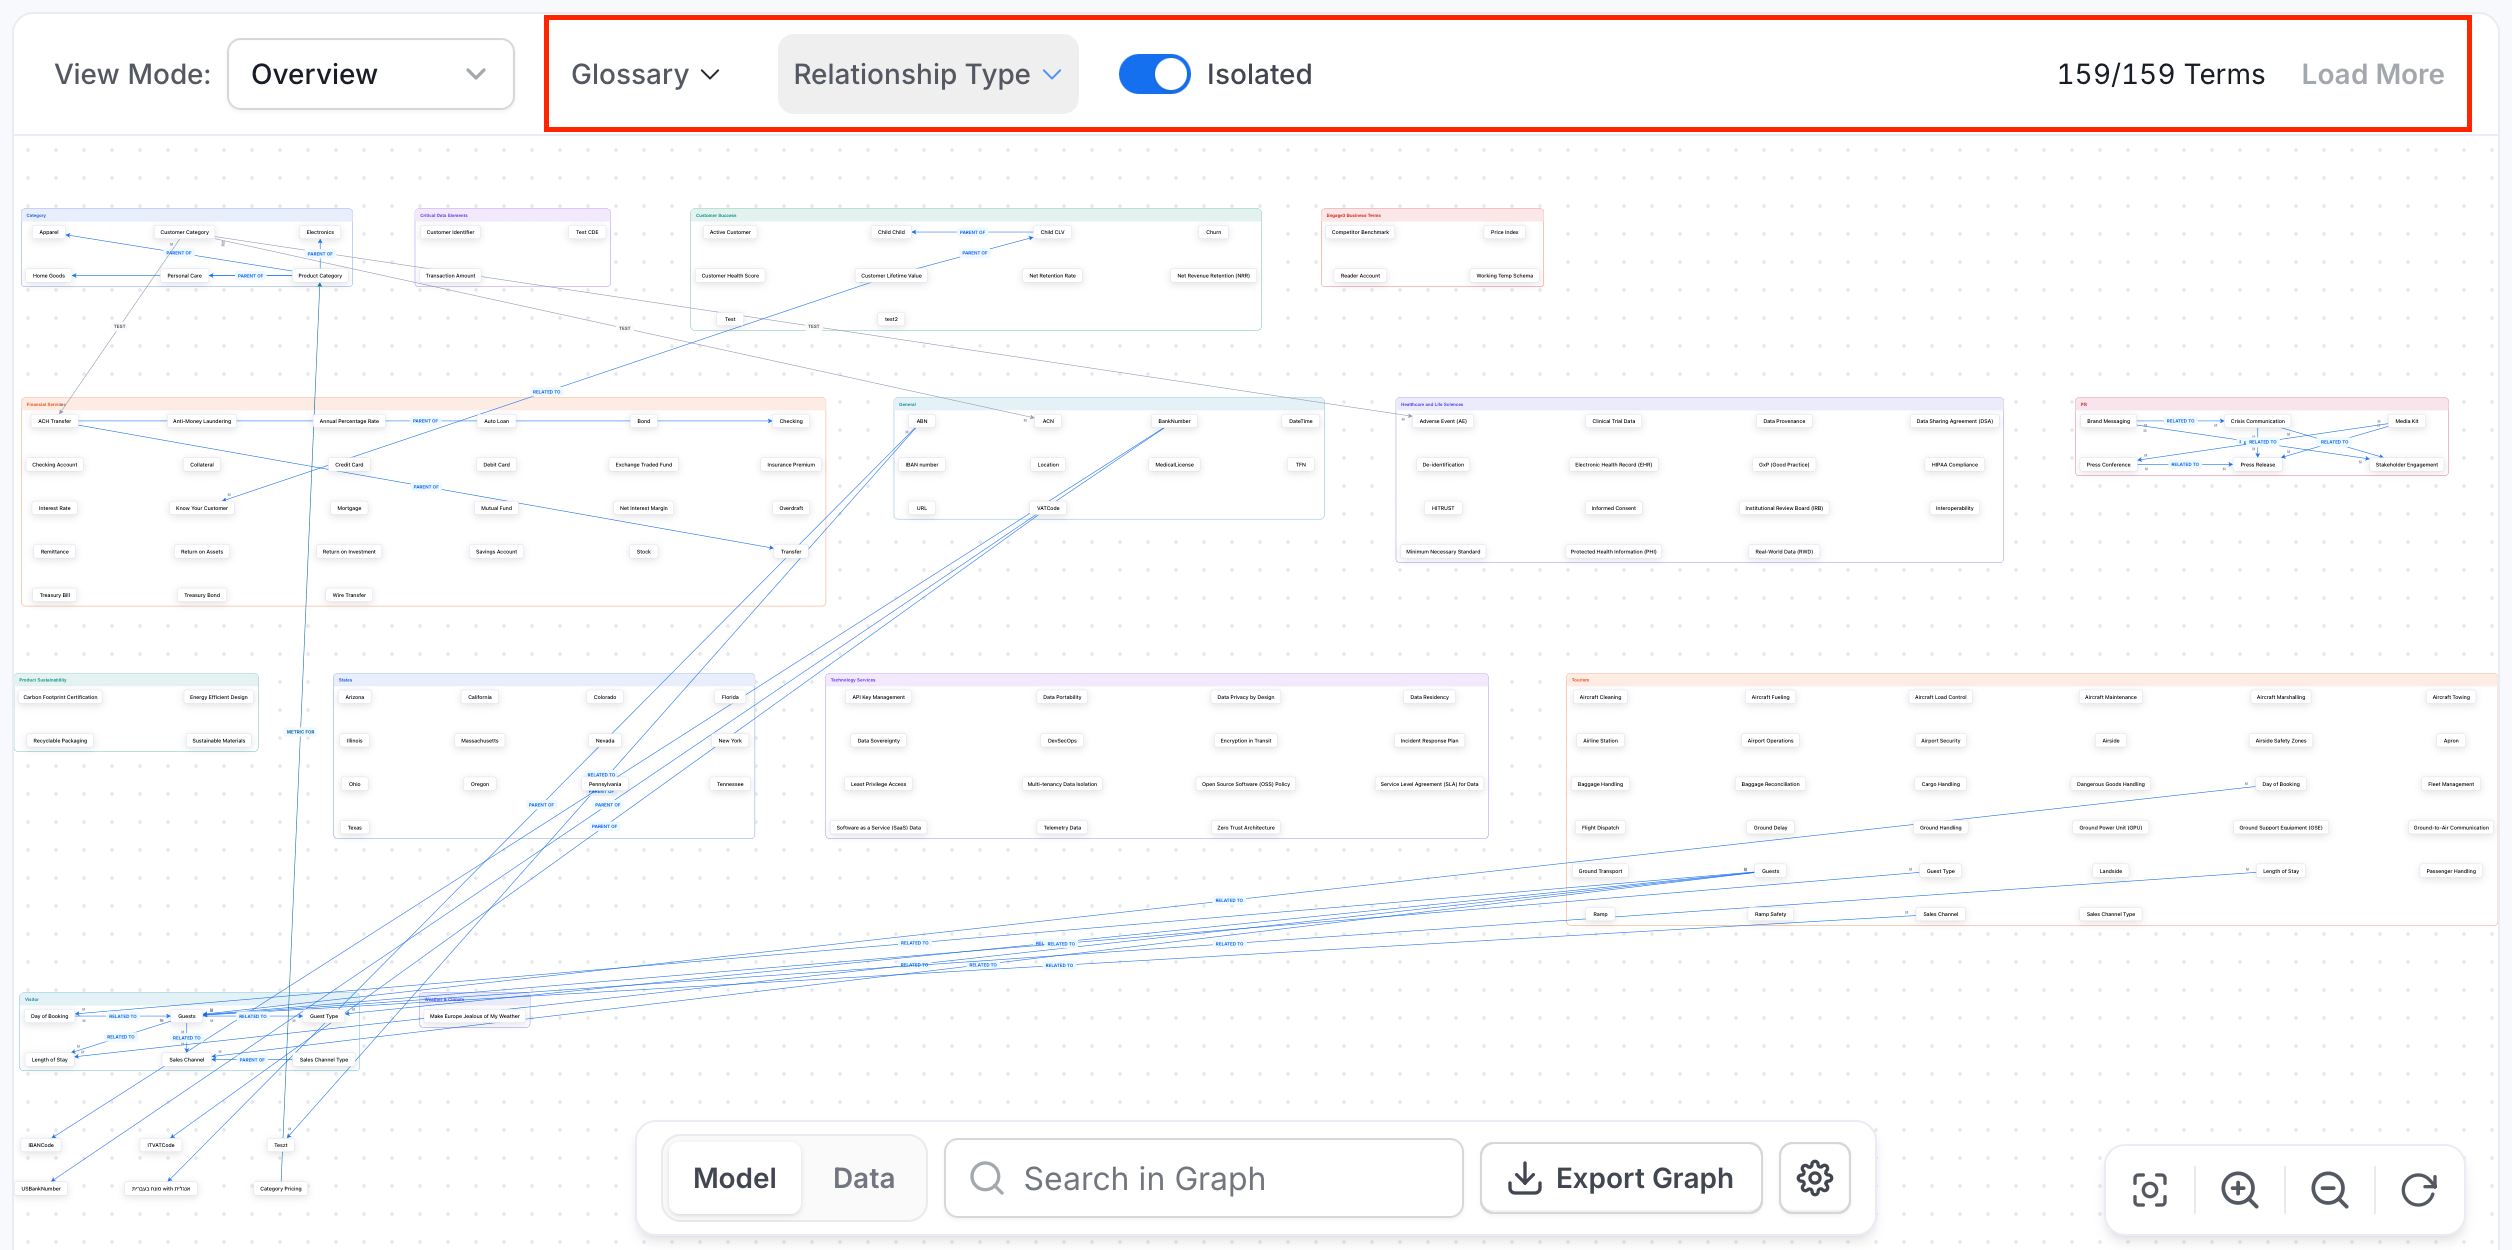
Narrow the graph down using the filter controls in the toolbar.
* **Glossary**: Scope the graph to one or more specific glossaries.
* **Relationship Type**: Filter edges down to a specific relationship type.
* **Isolated**: Toggle whether the graph shows terms with no relationships.
* **Term count**: The toolbar shows how many terms are currently loaded (for example, `159/159 Terms`)—use **Load More** to page in additional terms.
* **Clear all**: Once a Glossary or Relationship Type filter is active, a **Clear all** button appears to reset both filters at once.
## Filtering the Graph
Narrow the graph down using the filter controls in the toolbar.
* **Glossary**: Scope the graph to one or more specific glossaries.
* **Relationship Type**: Filter edges down to a specific relationship type.
* **Isolated**: Toggle whether the graph shows terms with no relationships.
* **Term count**: The toolbar shows how many terms are currently loaded (for example, `159/159 Terms`)—use **Load More** to page in additional terms.
* **Clear all**: Once a Glossary or Relationship Type filter is active, a **Clear all** button appears to reset both filters at once.
 ## Searching, Exporting, and Graph Settings
Beyond filtering, the toolbar also covers search, export, layout, and canvas navigation.
* **Search in Graph**: Find a specific term without manually scanning the canvas.
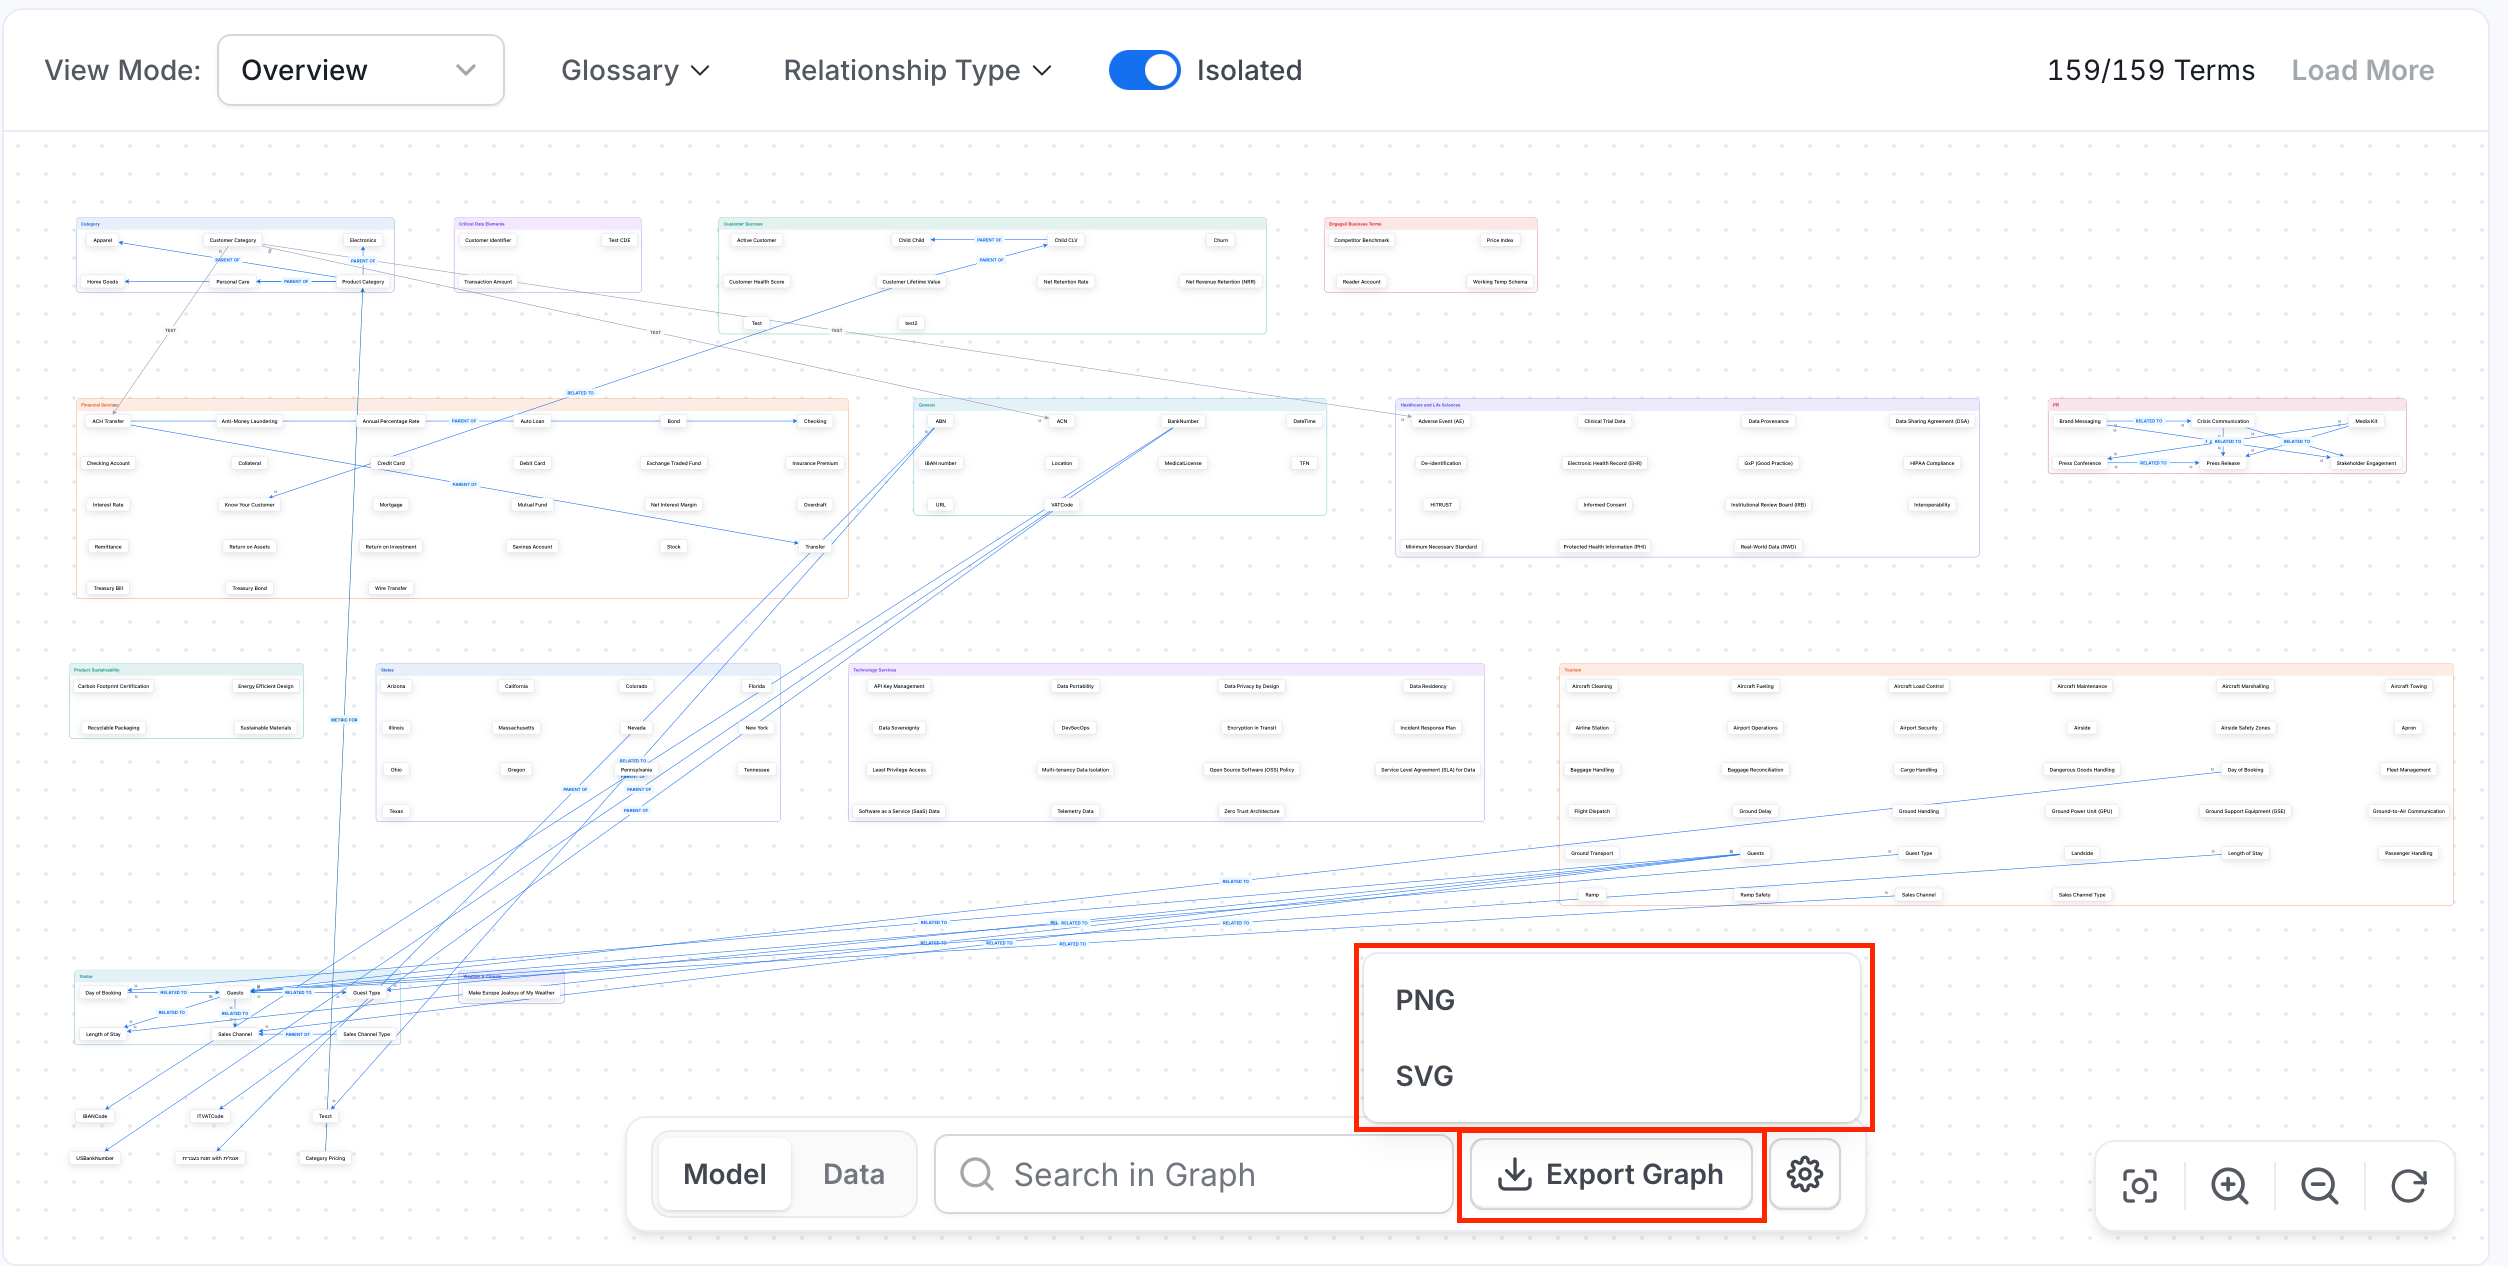
* **Export Graph**: Download the current graph view as a **PNG** or **SVG**. If your instance has RDF (Resource Description Framework) indexing enabled and the graph is scoped to a single glossary, **Turtle** and **RDF/XML** export are also available.
## Searching, Exporting, and Graph Settings
Beyond filtering, the toolbar also covers search, export, layout, and canvas navigation.
* **Search in Graph**: Find a specific term without manually scanning the canvas.
* **Export Graph**: Download the current graph view as a **PNG** or **SVG**. If your instance has RDF (Resource Description Framework) indexing enabled and the graph is scoped to a single glossary, **Turtle** and **RDF/XML** export are also available.
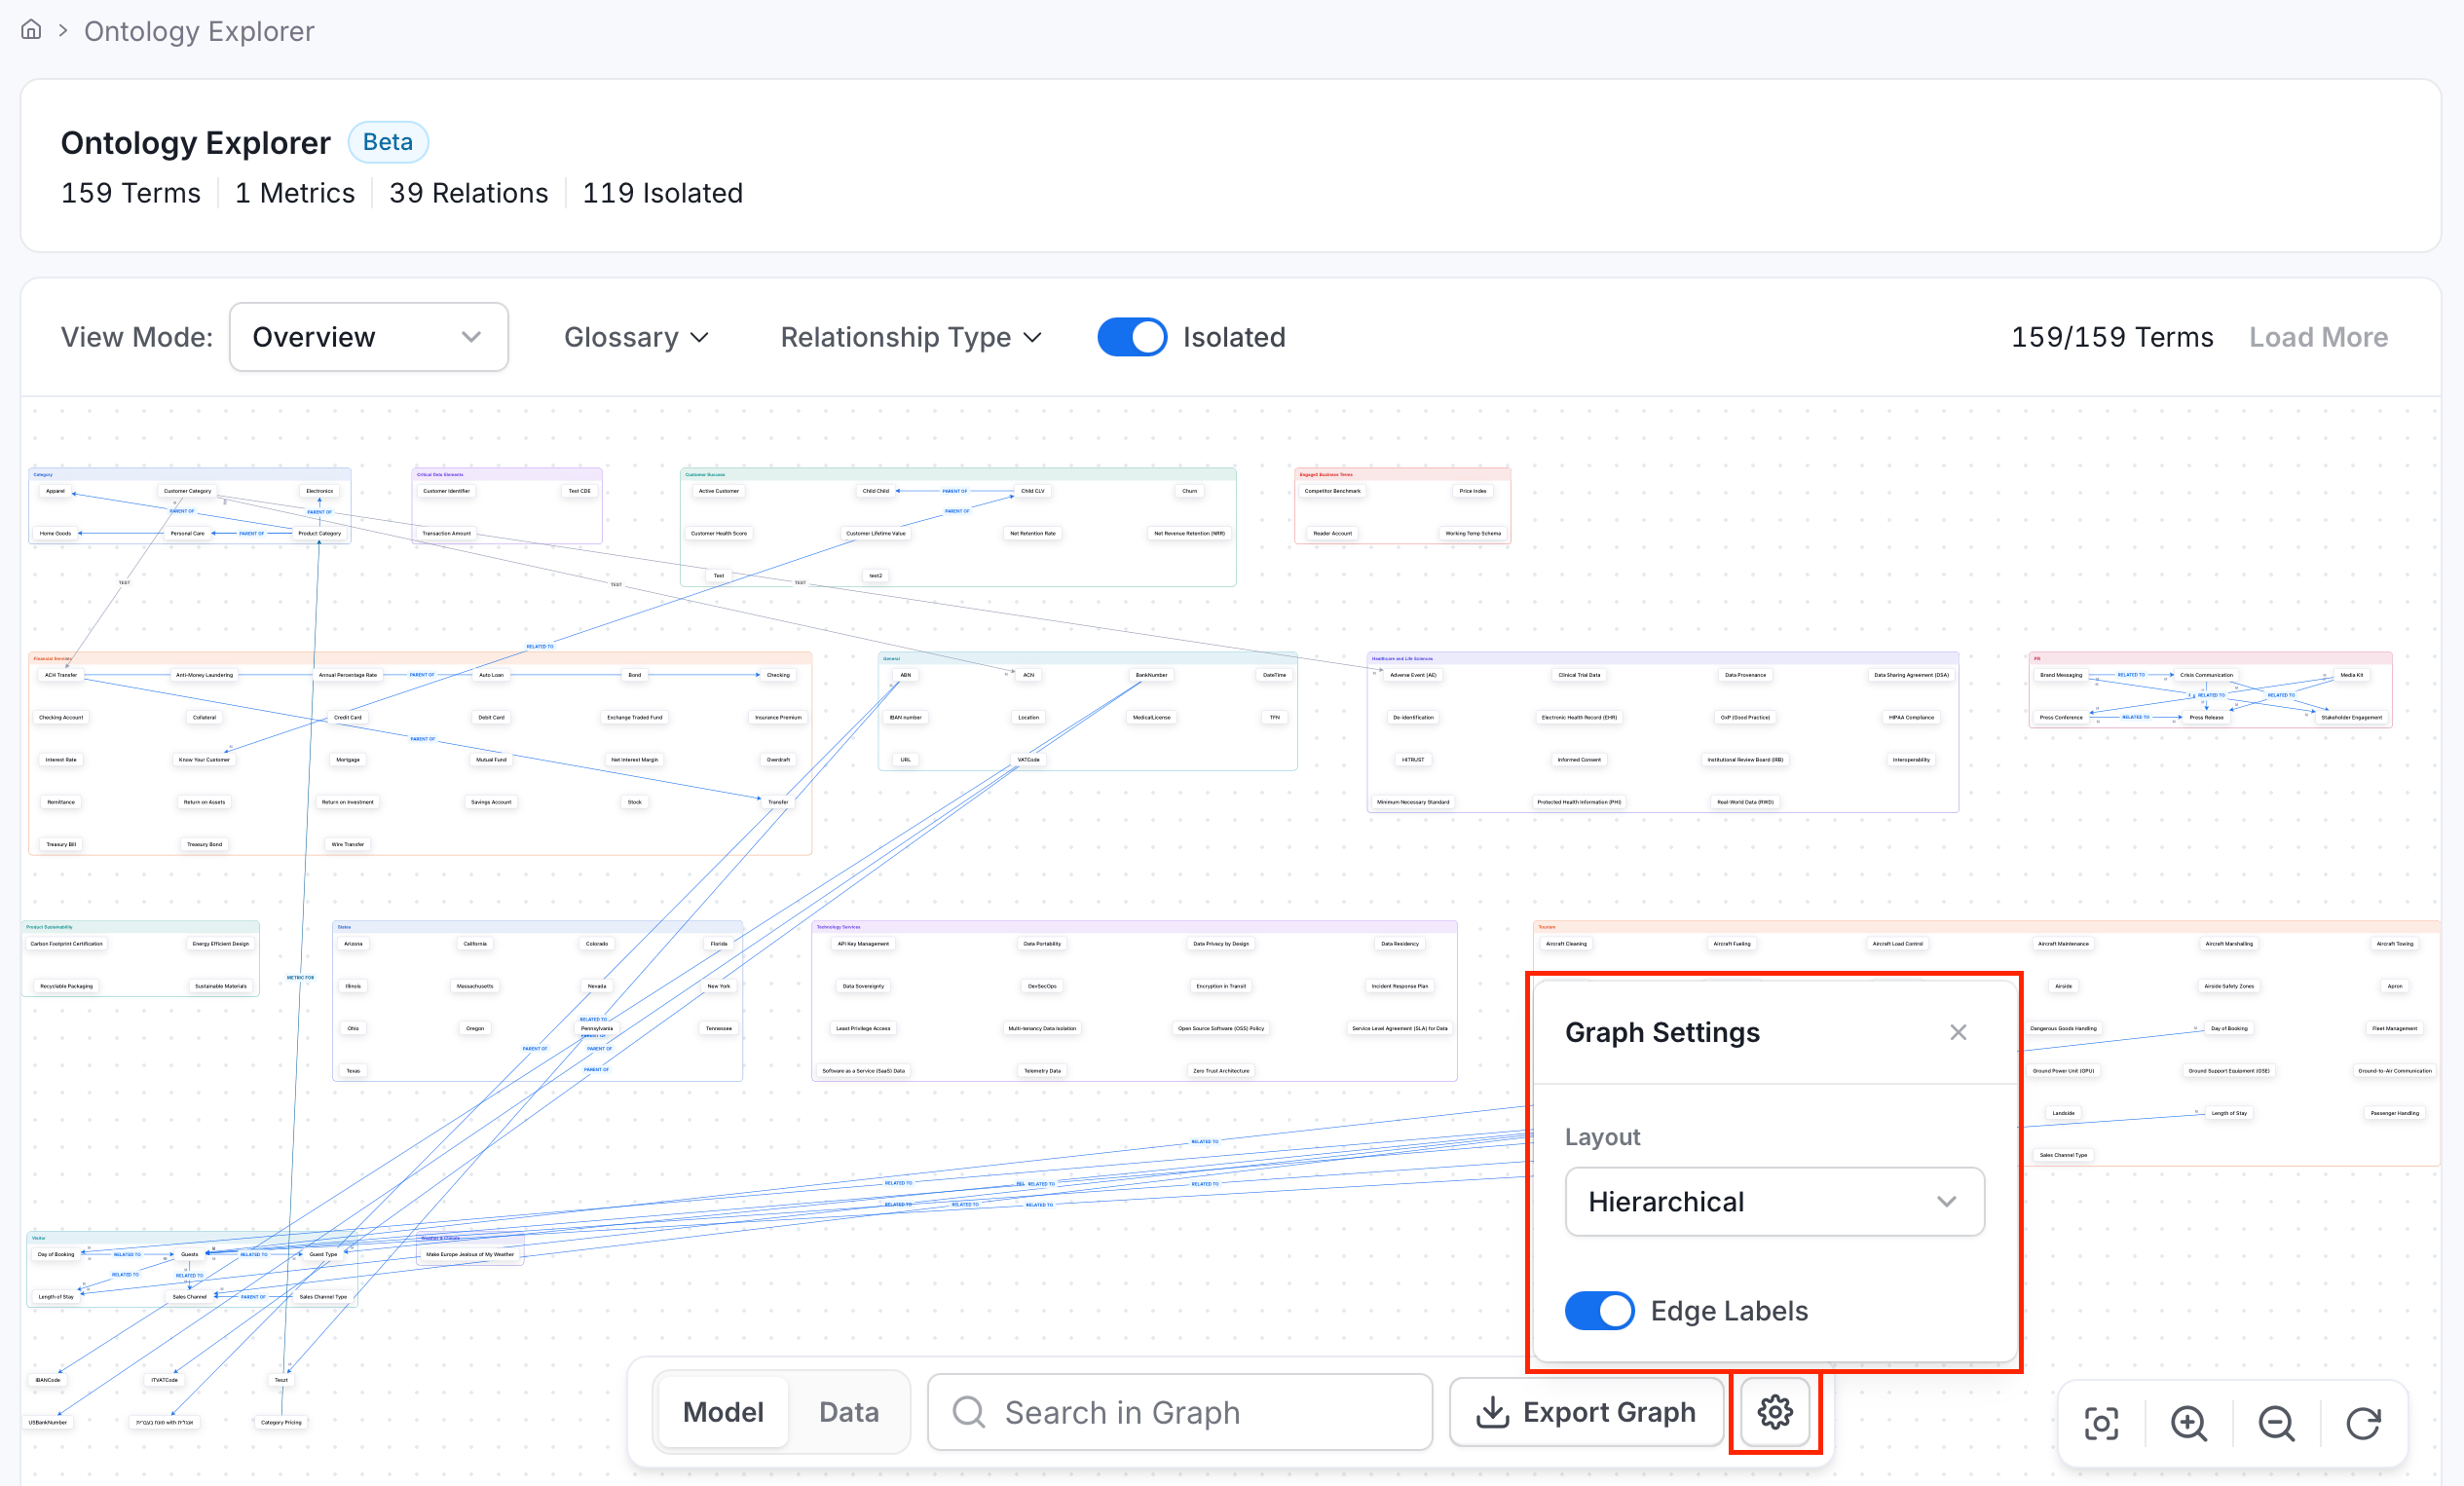
 * **Graph Settings**: Select the **Settings** icon to:
* Change the graph **Layout**—choose between **Hierarchical** and **Circular**.
* **Hierarchical**: Arranges terms into ranked, tree-like layers based on their relationships—useful for following parent/child structure top-down.
* **Circular**: Arranges terms around a circular layout instead of in ranked layers—useful for getting an overview of a cluster without a directional hierarchy.
* Toggle **Edge Labels** on or off, to show or hide relationship-type labels on the connecting lines.
* **Graph Settings**: Select the **Settings** icon to:
* Change the graph **Layout**—choose between **Hierarchical** and **Circular**.
* **Hierarchical**: Arranges terms into ranked, tree-like layers based on their relationships—useful for following parent/child structure top-down.
* **Circular**: Arranges terms around a circular layout instead of in ranked layers—useful for getting an overview of a cluster without a directional hierarchy.
* Toggle **Edge Labels** on or off, to show or hide relationship-type labels on the connecting lines.
 * **Canvas controls**: Use the canvas control icons to **Fit to Screen**, **Zoom In**, **Zoom Out**, or **Refresh** the graph.
## Related Reading
Learn how to create and organize glossary terms.
Configure the relation types available between glossary terms, including custom types.
Enable RDF indexing to unlock Turtle and RDF/XML export from the Ontology Explorer.
* **Canvas controls**: Use the canvas control icons to **Fit to Screen**, **Zoom In**, **Zoom Out**, or **Refresh** the graph.
## Related Reading
Learn how to create and organize glossary terms.
Configure the relation types available between glossary terms, including custom types.
Enable RDF indexing to unlock Turtle and RDF/XML export from the Ontology Explorer.