> ## Documentation Index
> Fetch the complete documentation index at: https://docs.getcollate.io/llms.txt
> Use this file to discover all available pages before exploring further.
# Collate ER Diagrams | Visualize Data Relationships
# Collate: Entity Relationship (ER) Diagrams
## Overview
Entity Relationship (ER) Diagrams in Collate provide a visual representation of how tables are connected within a database. These diagrams offer a complete picture of your data structure by automatically detecting relationships based on constraints such as **primary keys** and **foreign keys** during metadata ingestion.
## Automatic Detection of Relationships
Collate's [**metadata ingestion workflow**](/how-to-guides/guide-for-data-users/ingestion/workflows/metadata) identifies and extracts table relationships, ensuring that **primary key** and **foreign key** constraints are accurately represented. Once ingestion is completed, users can access ER diagrams at both the **table level** and **database schema level**.
## Features of ER Diagrams
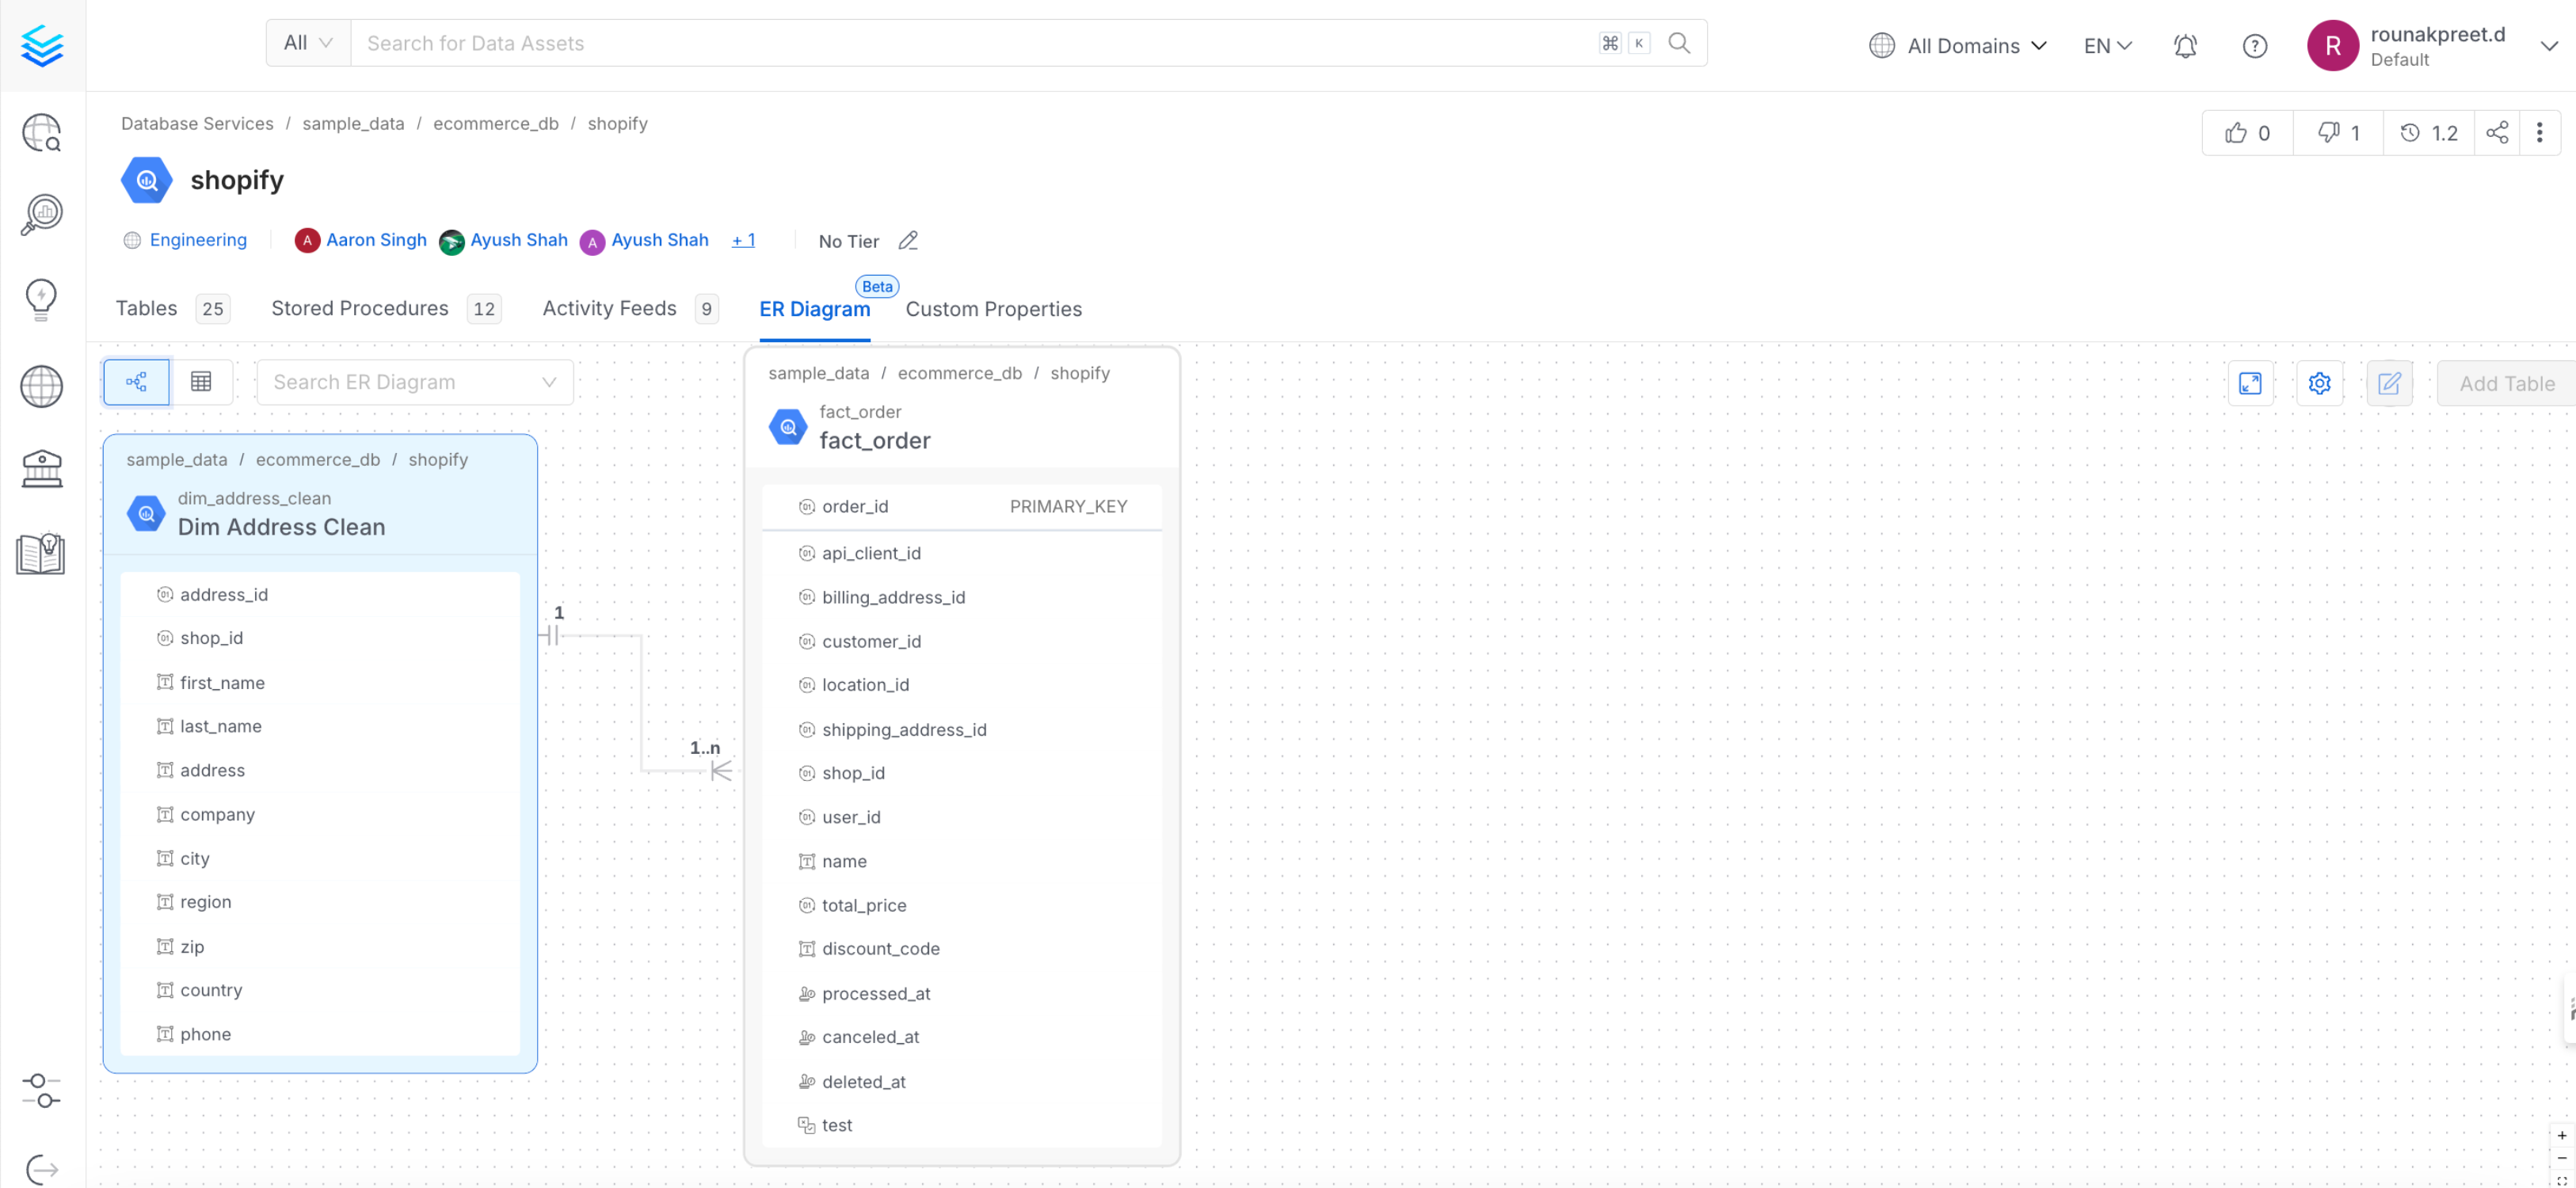
### Visualizing Table Relationships
* ER diagrams display **tables, constraints, and relationships** between them.
* **Relationship cardinality** is clearly indicated, helping users understand data connections.
### Interactive Exploration
* Users can navigate from table to table by following relationships.
* Enhances **data discovery** by making it more intuitive and efficient.
### Editing Relationships
* Modify existing relationships by **updating their type**.
* **Add or remove** relationships to reflect changes in the database structure.
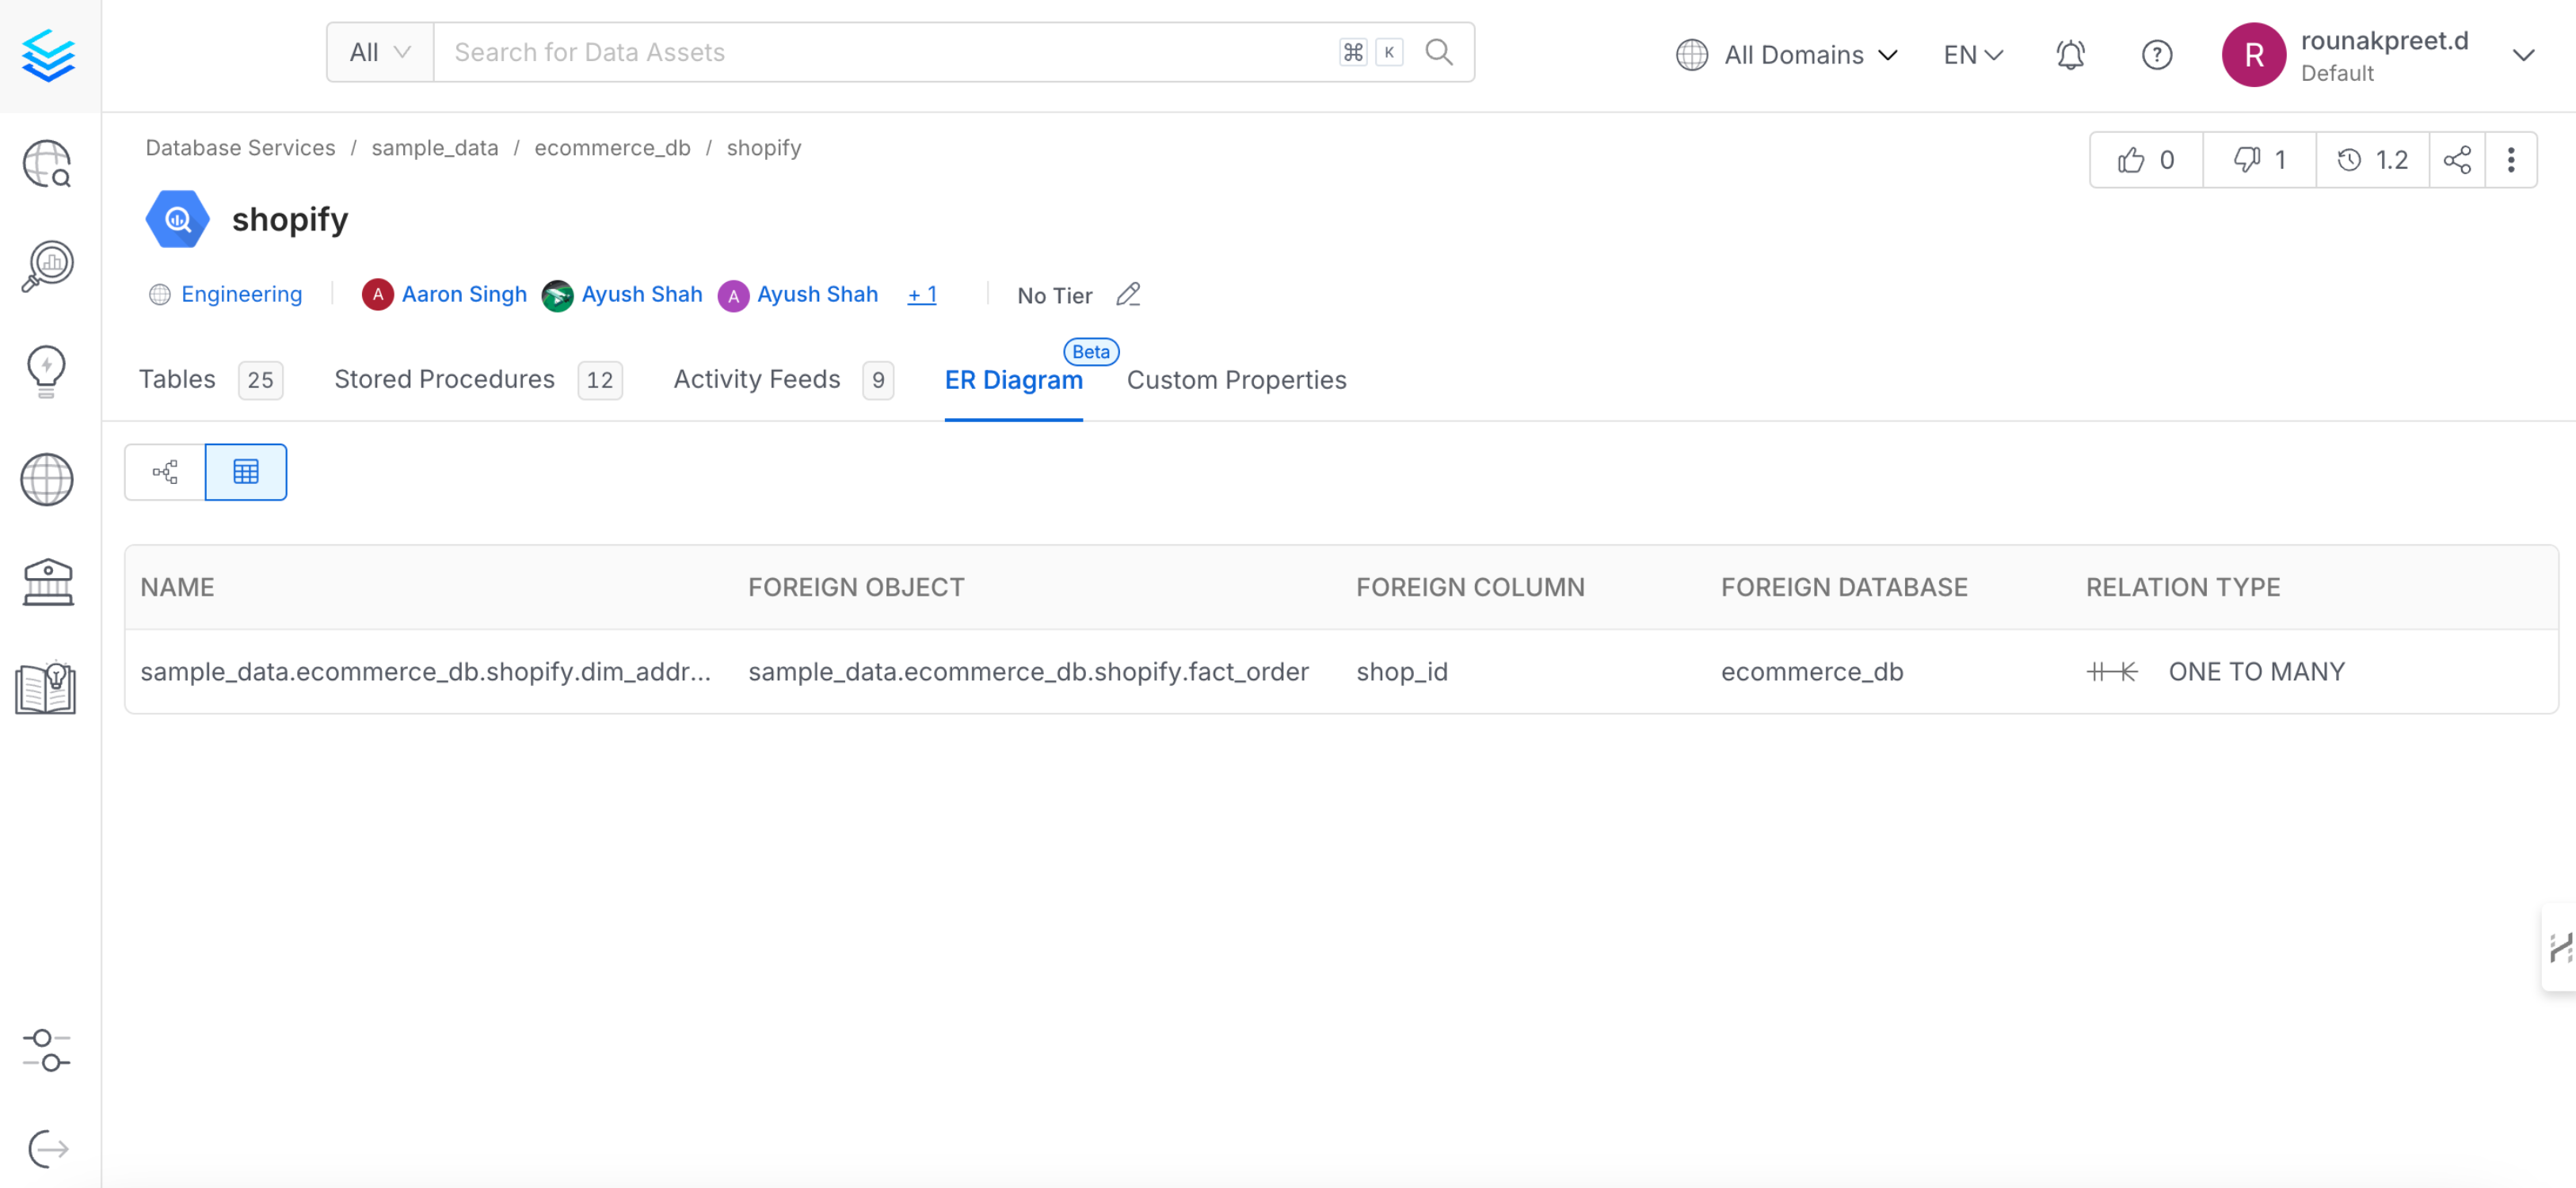
### Table View for Simplified Insights
* In addition to the diagram, Collate offers a **table view** listing all relationships in a structured format.
* Provides a **quick overview** of data dependencies.
## Benefits of ER Diagrams
### Improved Database Understanding
* ER diagrams create a **common language** for database discussions.
* Helps teams **visualize complex relationships** and constraints.
### Enhanced Troubleshooting & Impact Analysis
* Users can quickly **identify table relationships** and assess the impact of schema changes.
* Assists in **debugging and optimizing database structures**.
With **Collate's ER Diagrams**, users gain **greater visibility** into their data relationships, improving **data discovery, governance, and analysis**.
 ### Interactive Exploration
* Users can navigate from table to table by following relationships.
* Enhances **data discovery** by making it more intuitive and efficient.
### Editing Relationships
* Modify existing relationships by **updating their type**.
* **Add or remove** relationships to reflect changes in the database structure.
### Table View for Simplified Insights
* In addition to the diagram, Collate offers a **table view** listing all relationships in a structured format.
* Provides a **quick overview** of data dependencies.
### Interactive Exploration
* Users can navigate from table to table by following relationships.
* Enhances **data discovery** by making it more intuitive and efficient.
### Editing Relationships
* Modify existing relationships by **updating their type**.
* **Add or remove** relationships to reflect changes in the database structure.
### Table View for Simplified Insights
* In addition to the diagram, Collate offers a **table view** listing all relationships in a structured format.
* Provides a **quick overview** of data dependencies.
 ## Benefits of ER Diagrams
### Improved Database Understanding
* ER diagrams create a **common language** for database discussions.
* Helps teams **visualize complex relationships** and constraints.
### Enhanced Troubleshooting & Impact Analysis
* Users can quickly **identify table relationships** and assess the impact of schema changes.
* Assists in **debugging and optimizing database structures**.
With **Collate's ER Diagrams**, users gain **greater visibility** into their data relationships, improving **data discovery, governance, and analysis**.
## Benefits of ER Diagrams
### Improved Database Understanding
* ER diagrams create a **common language** for database discussions.
* Helps teams **visualize complex relationships** and constraints.
### Enhanced Troubleshooting & Impact Analysis
* Users can quickly **identify table relationships** and assess the impact of schema changes.
* Assists in **debugging and optimizing database structures**.
With **Collate's ER Diagrams**, users gain **greater visibility** into their data relationships, improving **data discovery, governance, and analysis**.