> ## Documentation Index
> Fetch the complete documentation index at: https://docs.getcollate.io/llms.txt
> Use this file to discover all available pages before exploring further.
# Overview of Data Assets
> Navigate data asset tabs for schema, lineage, profiling, and usage insights in a unified, user-friendly interface.
## Overview of Data Assets
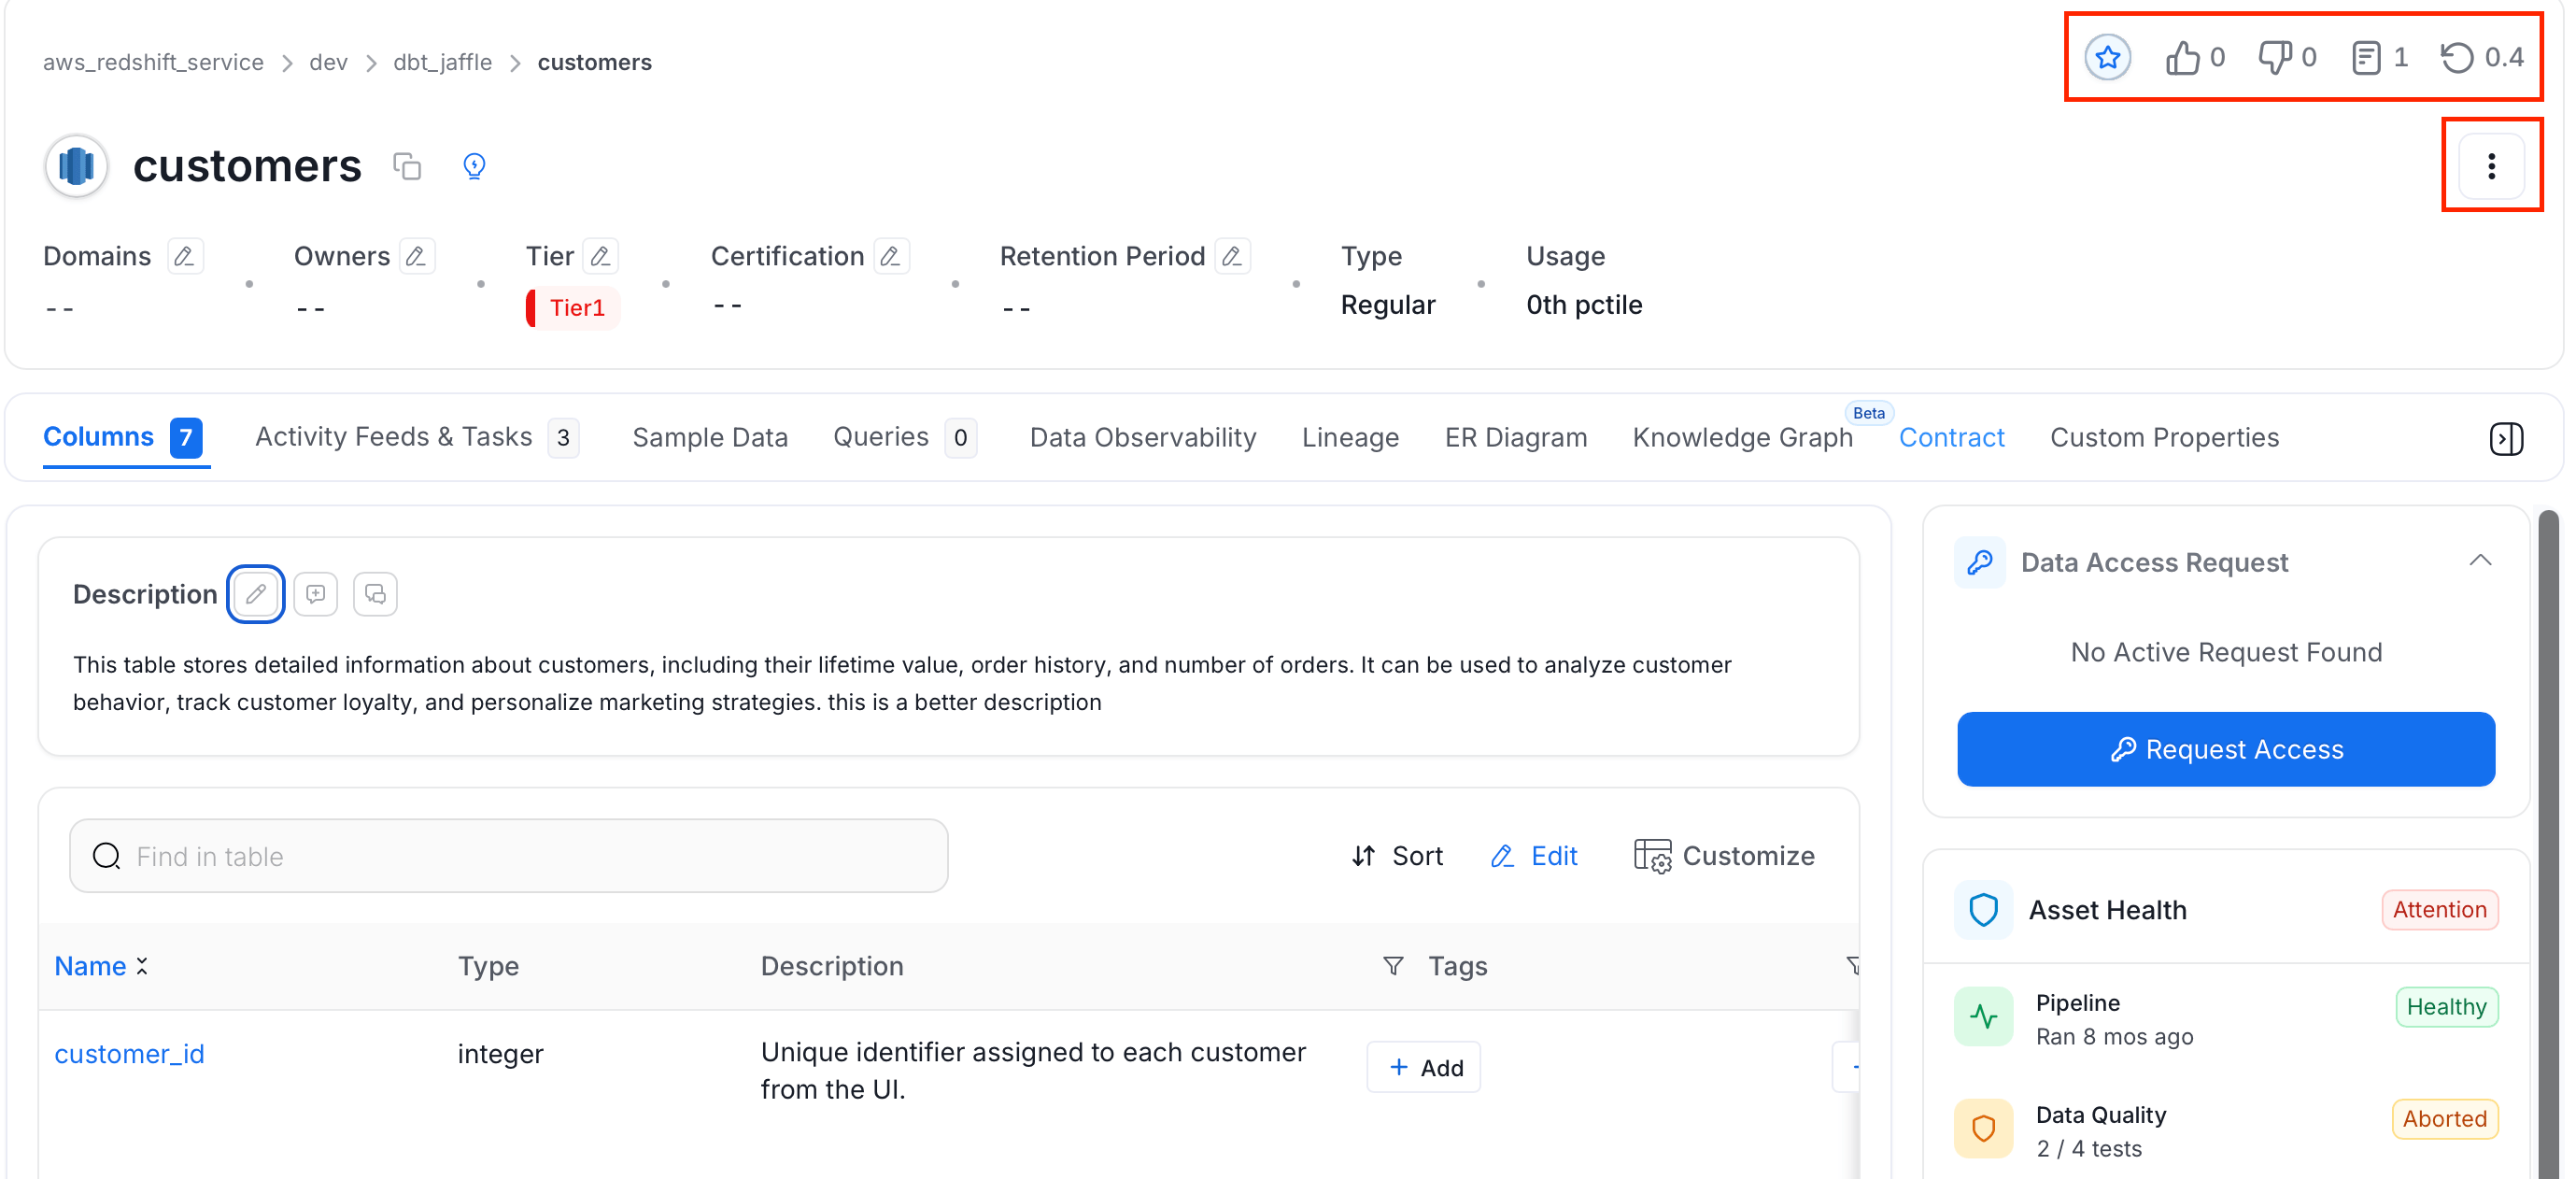
Every data asset in Collate has a dedicated detail page that gives you a complete picture of that asset — from schema and sample data to lineage, data quality, and governance.
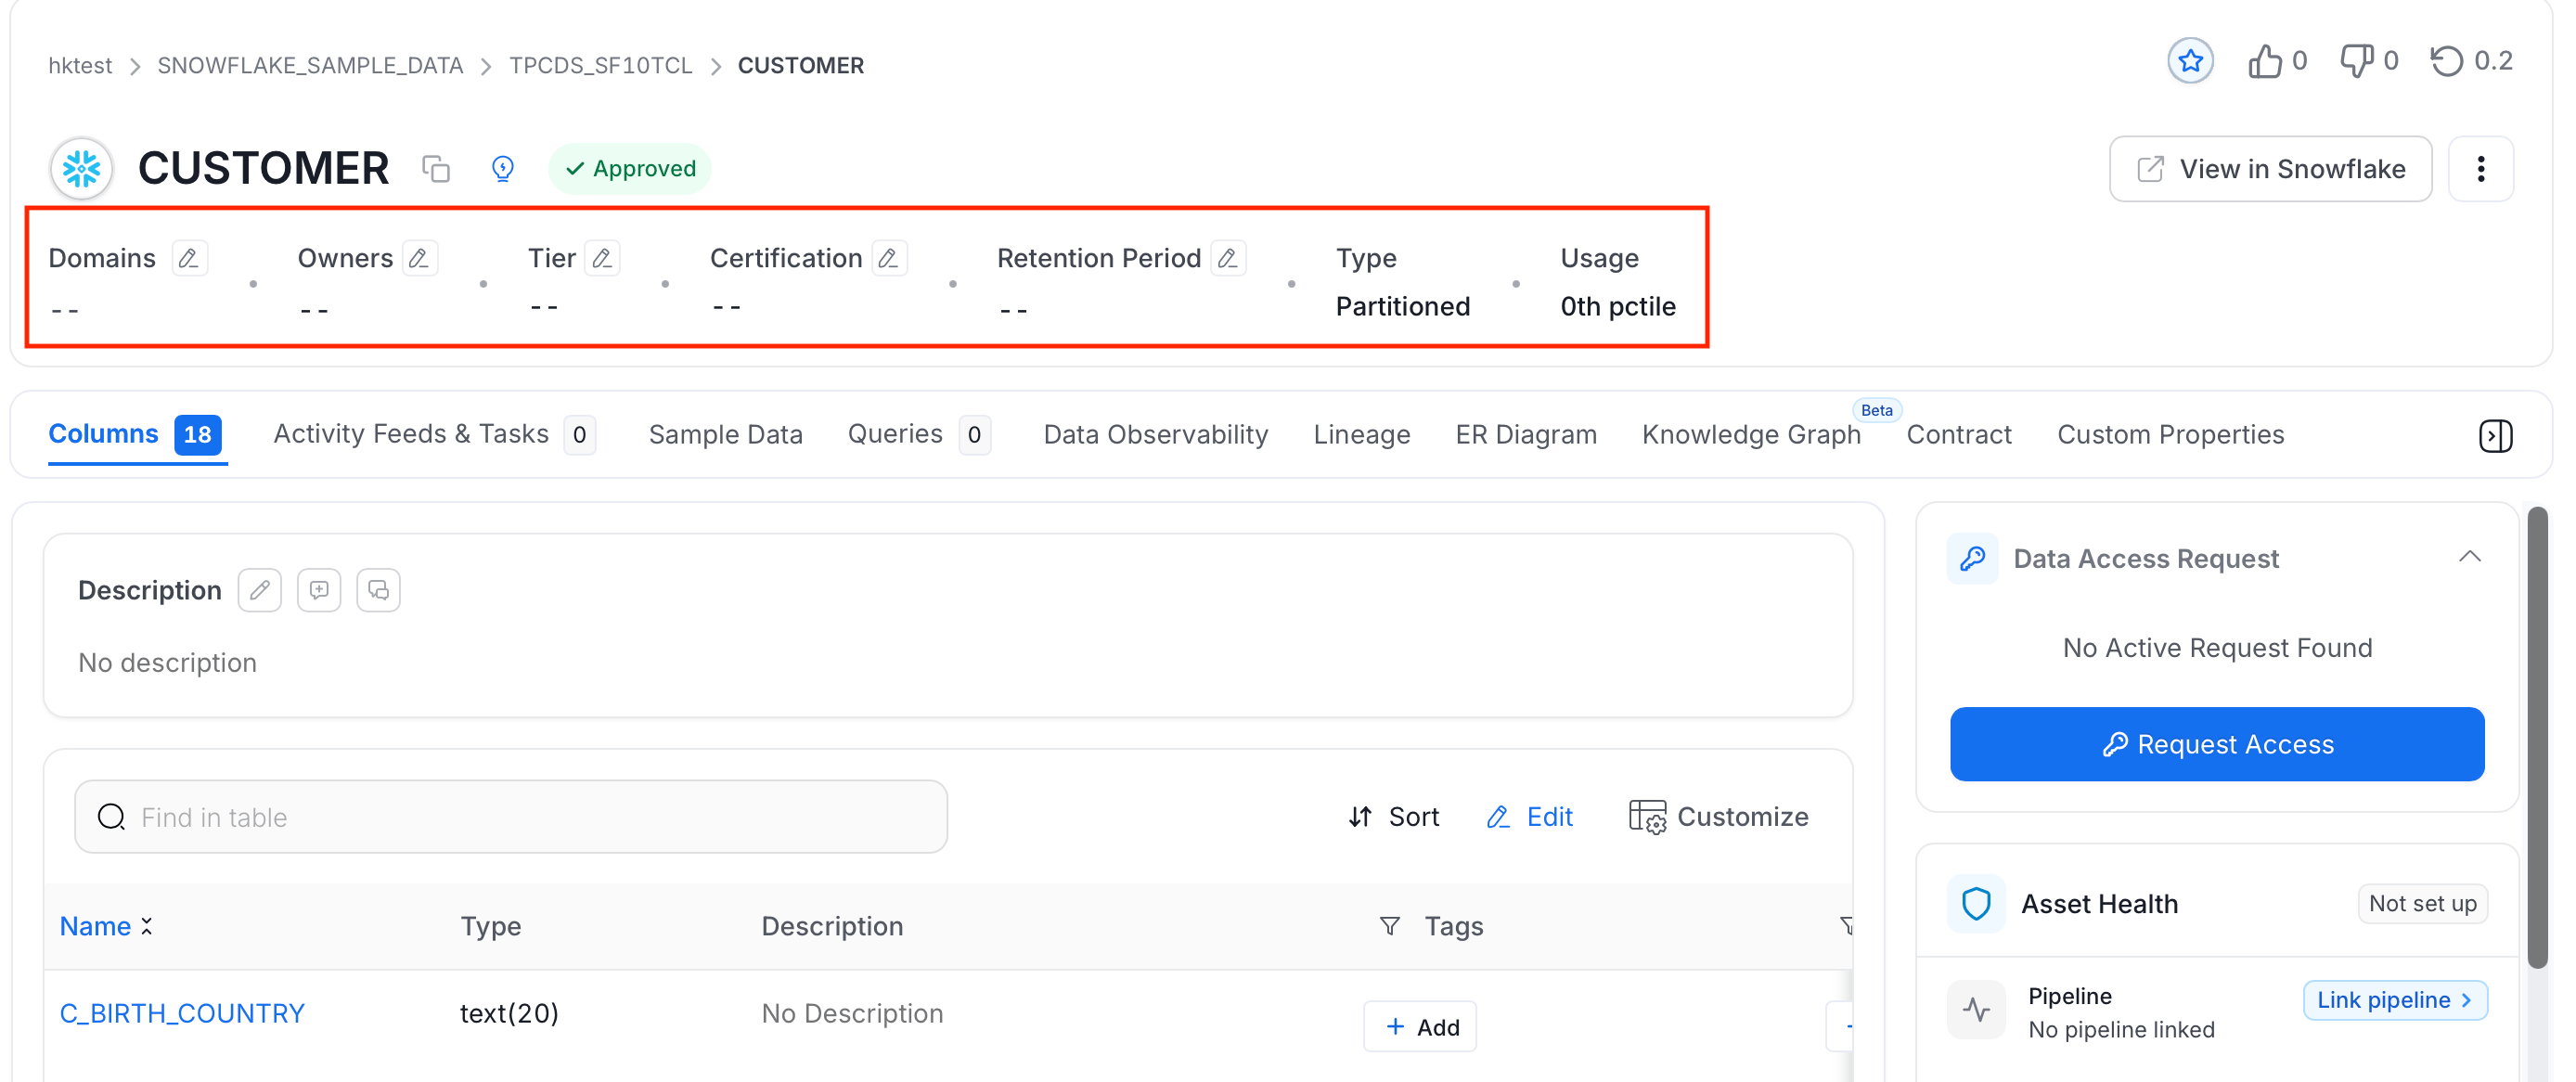
The **top panel** shows key metadata at a glance:
* **Source** — the connected data service
* **Owner** — team or user responsible for the asset
* **Tier** — data criticality level
* **Type** — asset type (Table, Topic, Dashboard, etc.)
* **Usage** — query and access frequency
* **Description** — what the asset contains and how it's used
 ## Data Asset Tabs
Tabs vary depending on the type of data asset. The table below shows which tabs are available for each asset type.
## Data Asset Tabs
Tabs vary depending on the type of data asset. The table below shows which tabs are available for each asset type.
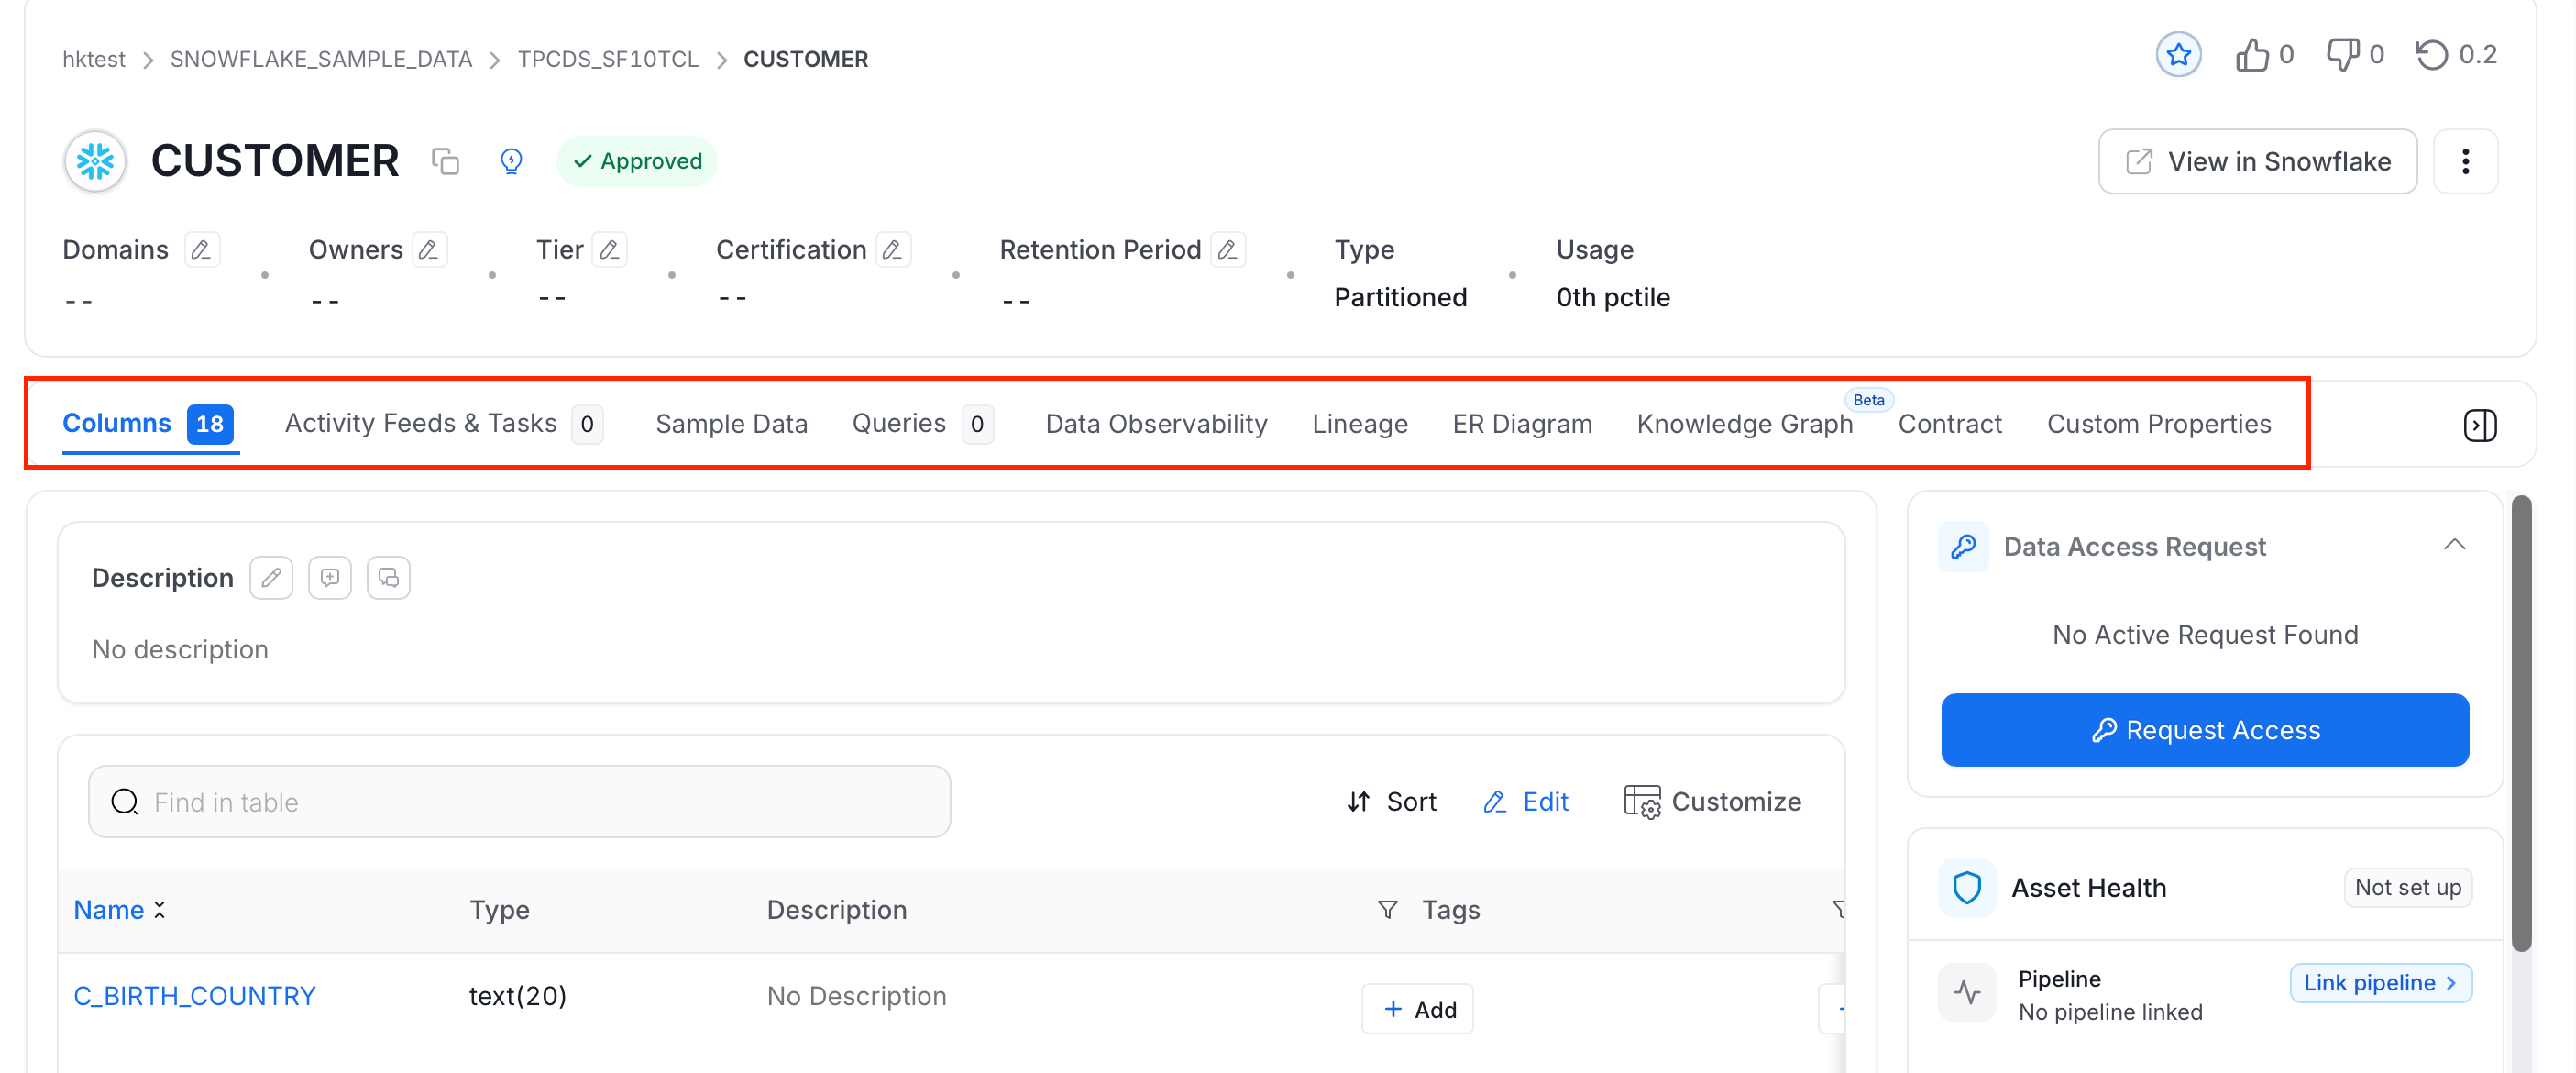 | **Tab** | **Table** | **Topic** | **Dashboard** | **Pipeline** | **ML Model** | **Container** |
| :------------------------- | :-------: | :-------: | :-----------: | :----------: | :----------: | :-----------: |
| **Columns** | ✔ | ✔ | ✘ | ✘ | ✘ | ✔ |
| **Activity Feeds & Tasks** | ✔ | ✔ | ✔ | ✔ | ✔ | ✔ |
| **Sample Data** | ✔ | ✔ | ✘ | ✘ | ✘ | ✘ |
| **Queries** | ✔ | ✘ | ✘ | ✘ | ✘ | ✘ |
| **Data Observability** | ✔ | ✘ | ✘ | ✘ | ✘ | ✘ |
| **Lineage** | ✔ | ✔ | ✔ | ✔ | ✔ | ✔ |
| **ER Diagram** | ✔ | ✘ | ✘ | ✘ | ✘ | ✘ |
| **Knowledge Graph** | ✔ | ✘ | ✘ | ✘ | ✘ | ✘ |
| **Contract** | ✔ | ✔ | ✔ | ✔ | ✔ | ✔ |
| **Custom Properties** | ✔ | ✔ | ✔ | ✔ | ✔ | ✔ |
| **Config** | ✘ | ✔ | ✘ | ✘ | ✘ | ✘ |
| **Details** | ✘ | ✘ | ✔ | ✘ | ✔ | ✘ |
| **Executions** | ✘ | ✘ | ✘ | ✔ | ✘ | ✘ |
| **Features** | ✘ | ✘ | ✘ | ✘ | ✔ | ✘ |
| **Children** | ✘ | ✘ | ✘ | ✘ | ✘ | ✔ |
## Columns Tab
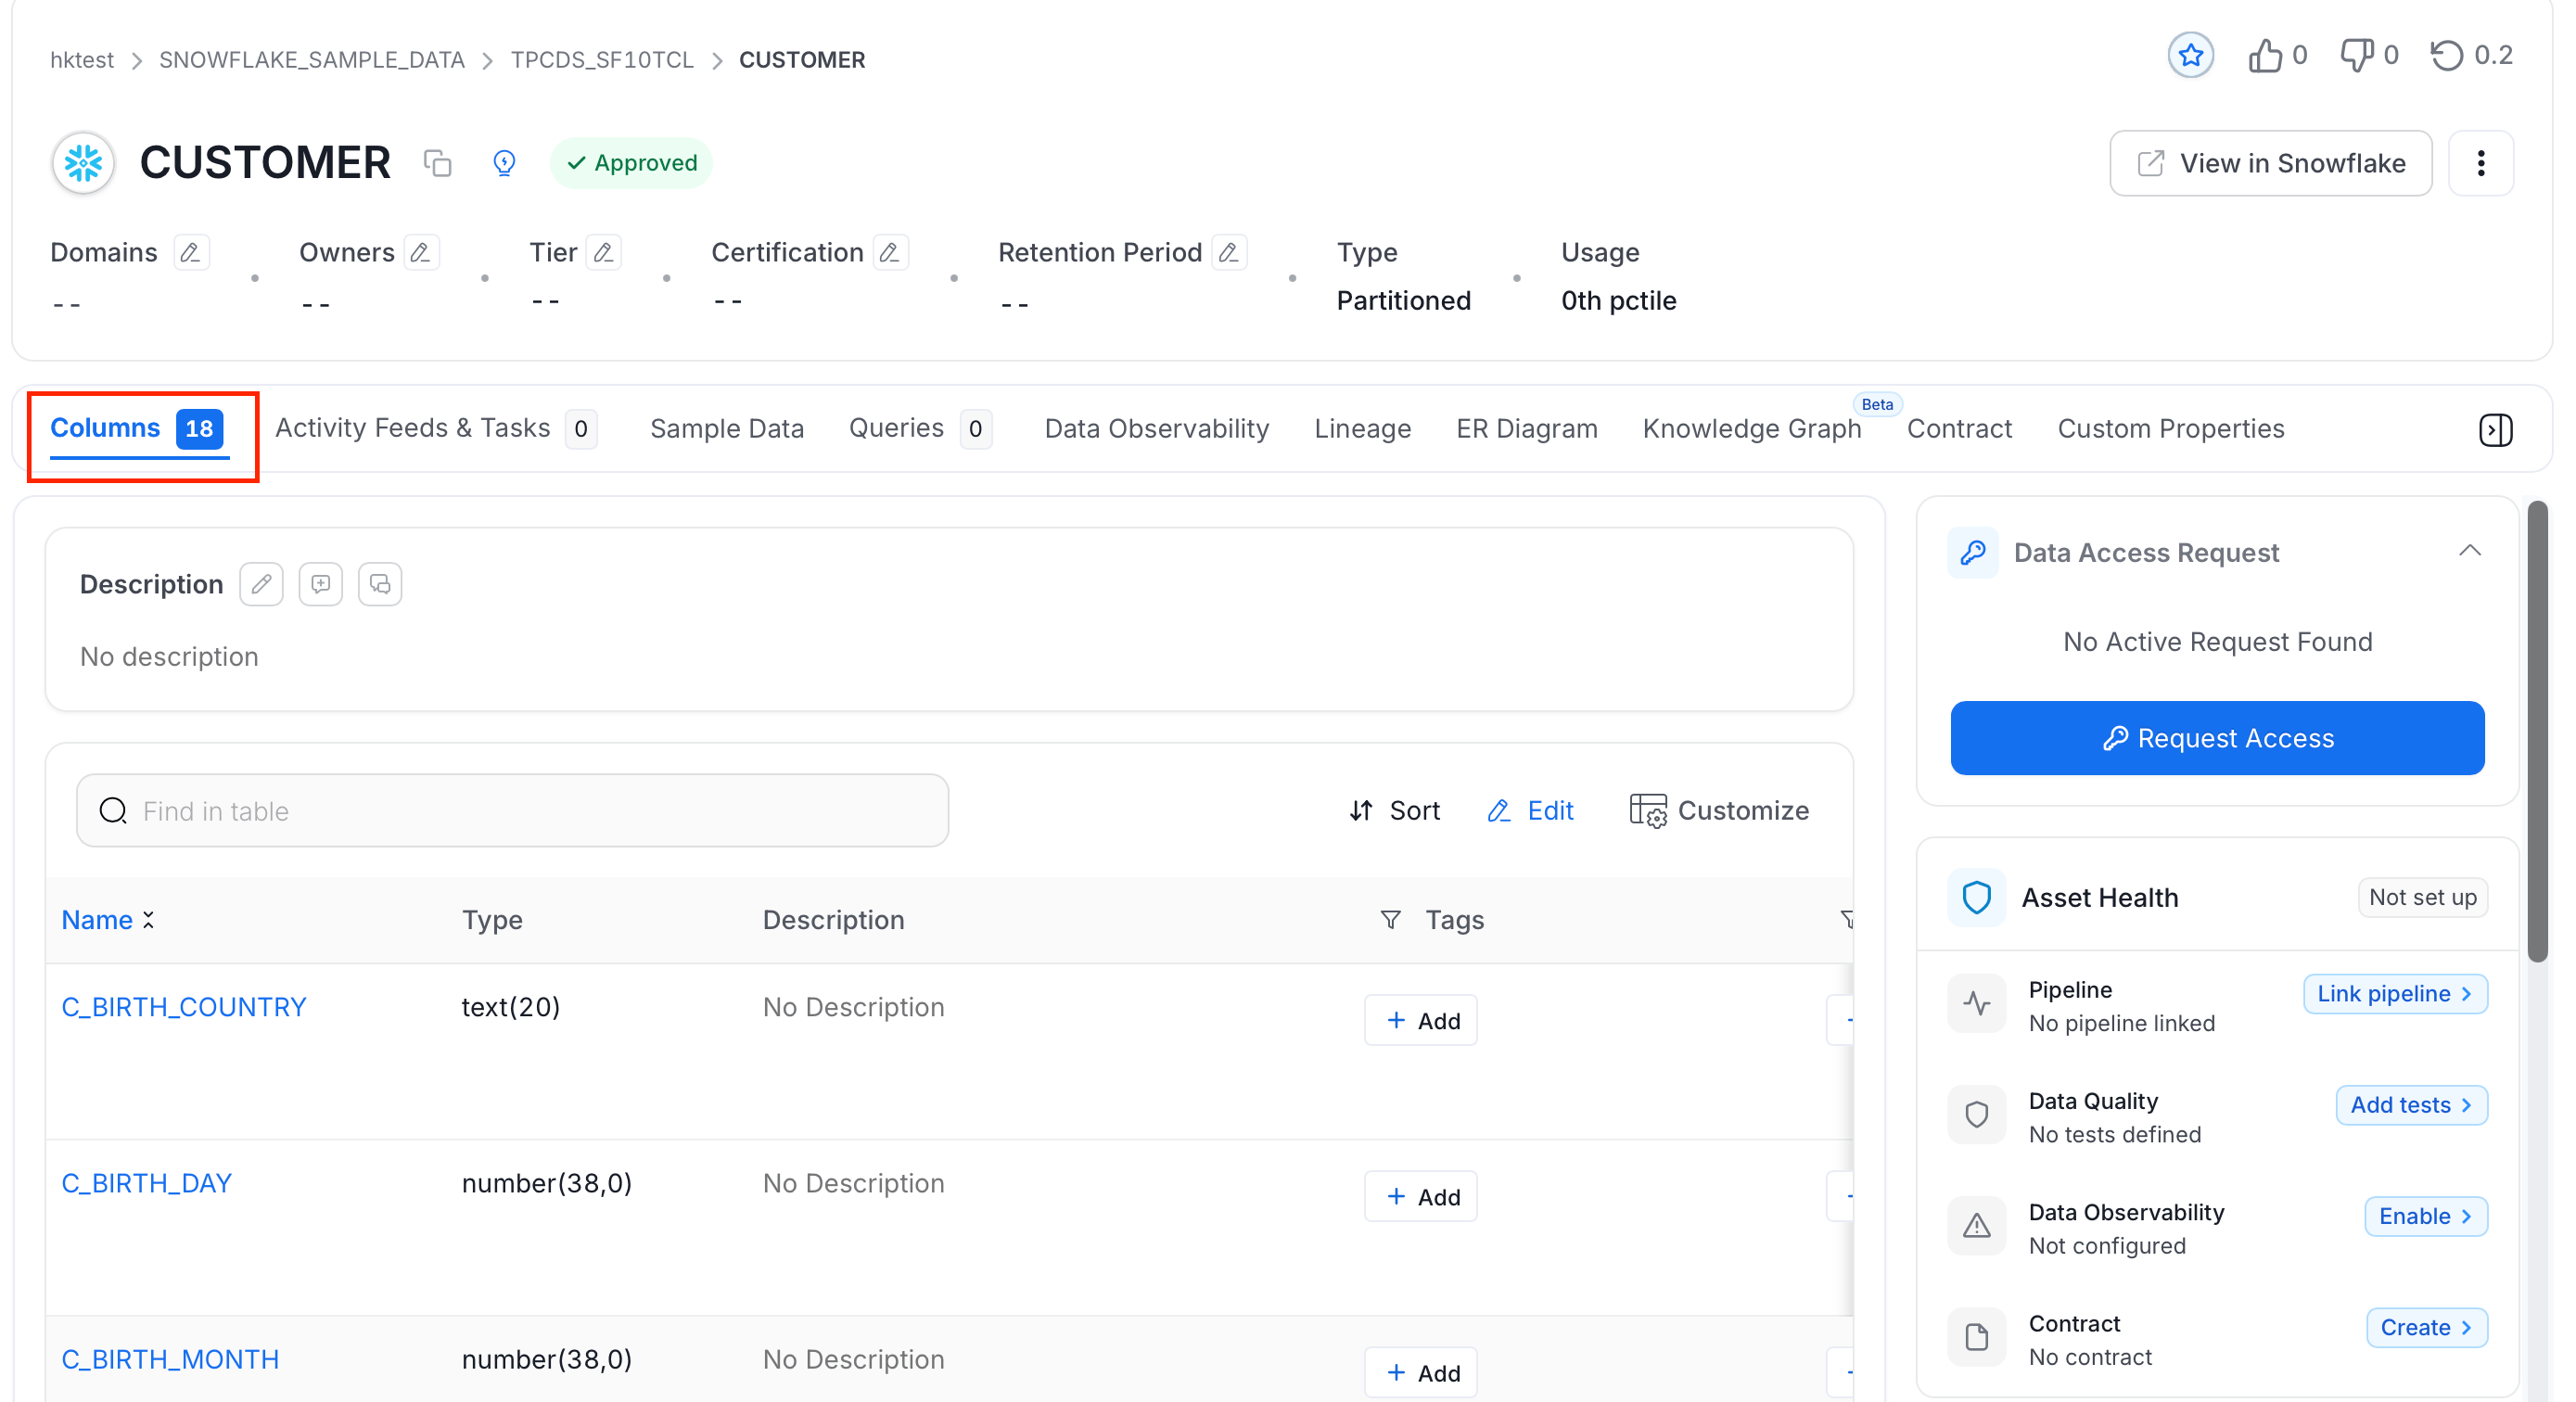
Available for **Tables, Topics, and Containers**. The Columns tab displays the full schema of the asset:
* Column names, data types, and descriptions
* Tags and glossary terms associated with each column
* Frequently joined tables and their relationship context
| **Tab** | **Table** | **Topic** | **Dashboard** | **Pipeline** | **ML Model** | **Container** |
| :------------------------- | :-------: | :-------: | :-----------: | :----------: | :----------: | :-----------: |
| **Columns** | ✔ | ✔ | ✘ | ✘ | ✘ | ✔ |
| **Activity Feeds & Tasks** | ✔ | ✔ | ✔ | ✔ | ✔ | ✔ |
| **Sample Data** | ✔ | ✔ | ✘ | ✘ | ✘ | ✘ |
| **Queries** | ✔ | ✘ | ✘ | ✘ | ✘ | ✘ |
| **Data Observability** | ✔ | ✘ | ✘ | ✘ | ✘ | ✘ |
| **Lineage** | ✔ | ✔ | ✔ | ✔ | ✔ | ✔ |
| **ER Diagram** | ✔ | ✘ | ✘ | ✘ | ✘ | ✘ |
| **Knowledge Graph** | ✔ | ✘ | ✘ | ✘ | ✘ | ✘ |
| **Contract** | ✔ | ✔ | ✔ | ✔ | ✔ | ✔ |
| **Custom Properties** | ✔ | ✔ | ✔ | ✔ | ✔ | ✔ |
| **Config** | ✘ | ✔ | ✘ | ✘ | ✘ | ✘ |
| **Details** | ✘ | ✘ | ✔ | ✘ | ✔ | ✘ |
| **Executions** | ✘ | ✘ | ✘ | ✔ | ✘ | ✘ |
| **Features** | ✘ | ✘ | ✘ | ✘ | ✔ | ✘ |
| **Children** | ✘ | ✘ | ✘ | ✘ | ✘ | ✔ |
## Columns Tab
Available for **Tables, Topics, and Containers**. The Columns tab displays the full schema of the asset:
* Column names, data types, and descriptions
* Tags and glossary terms associated with each column
* Frequently joined tables and their relationship context
 ## Activity Feeds & Tasks Tab
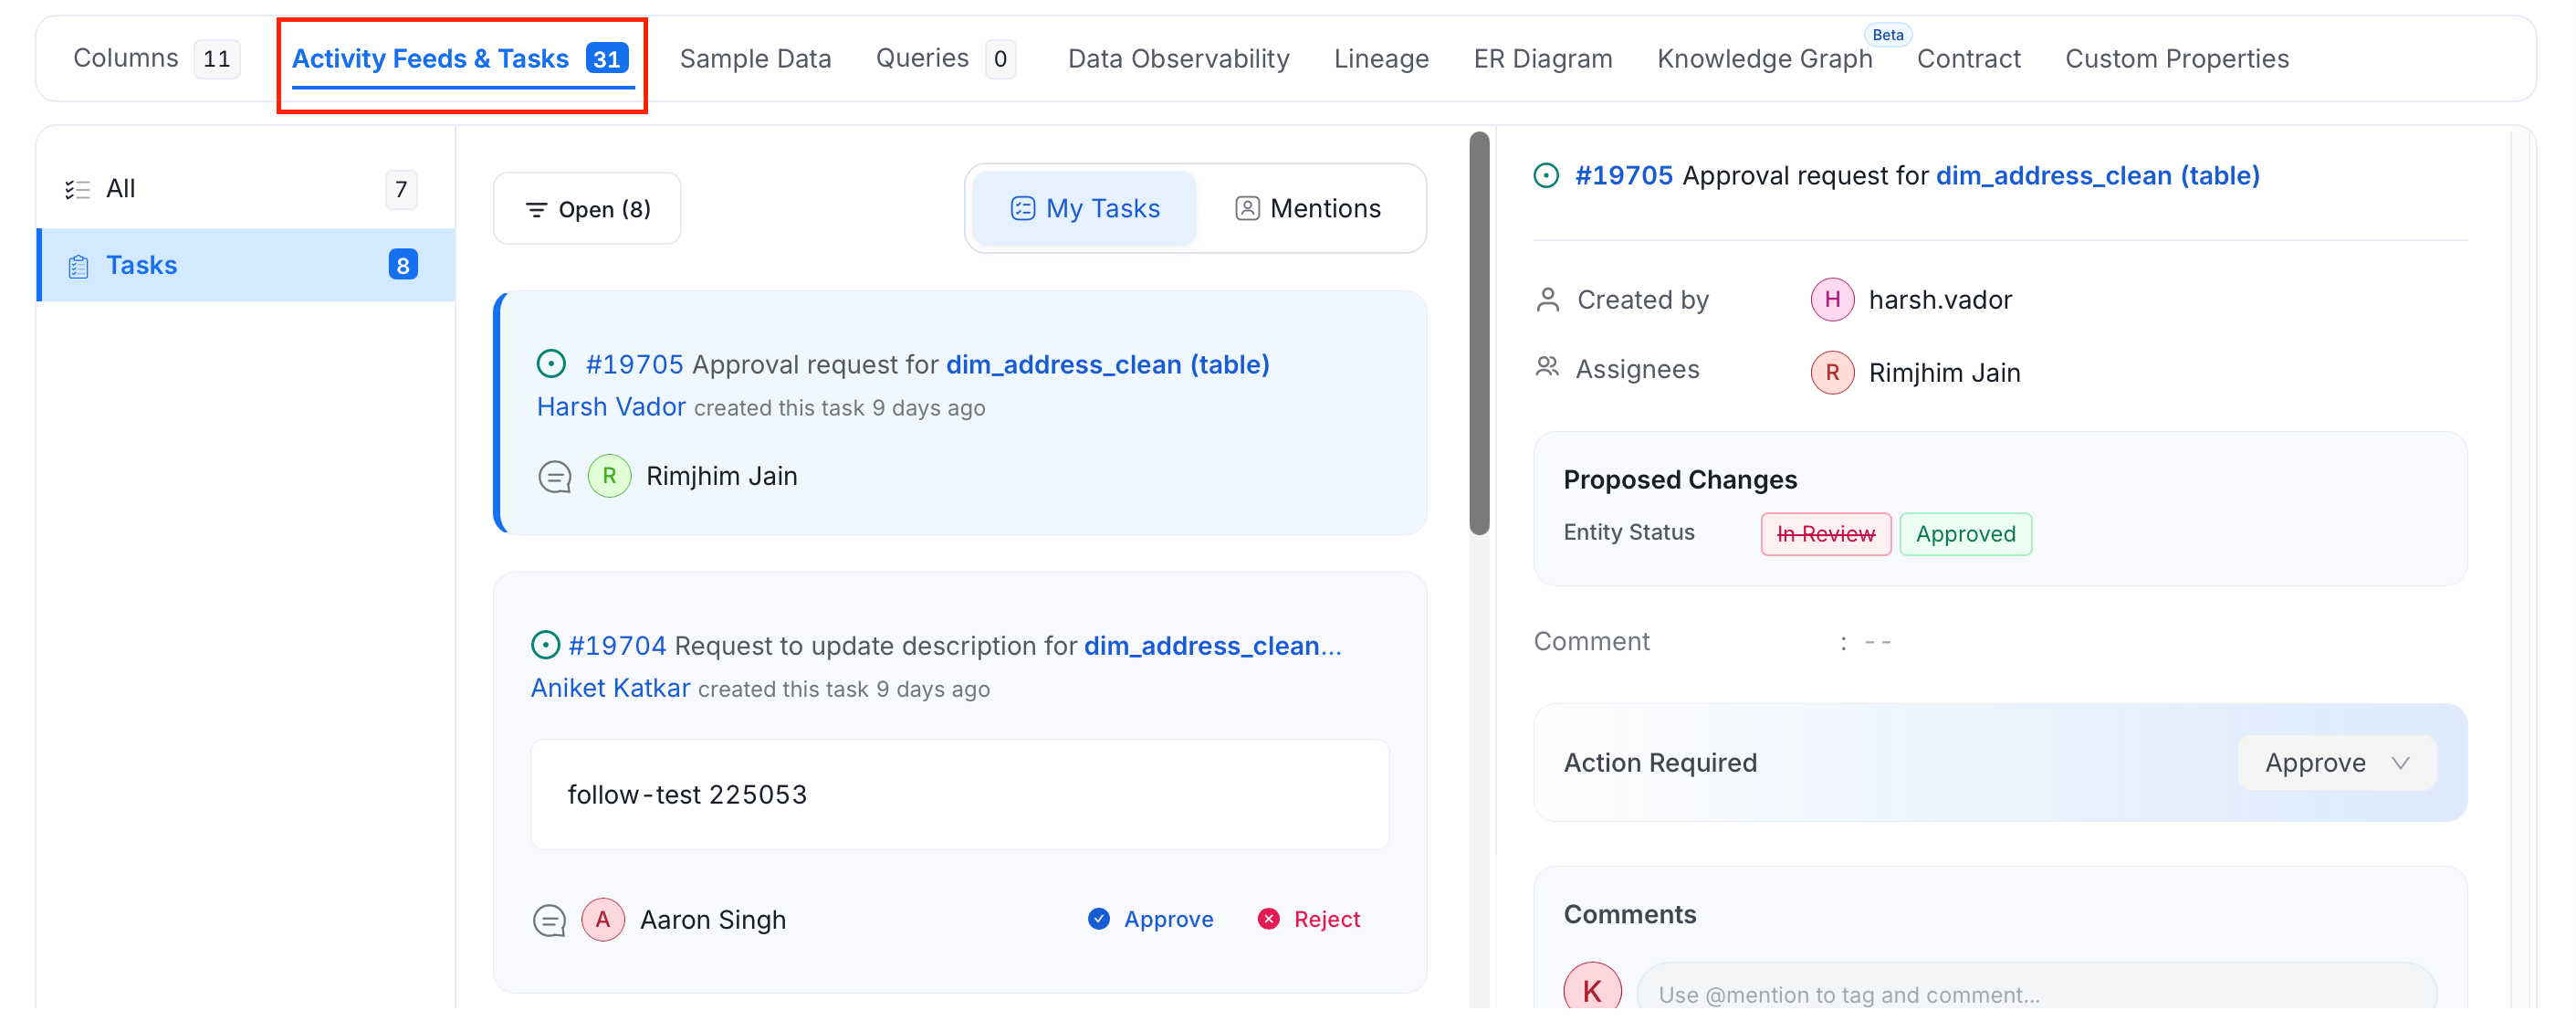
Available for **all asset types**. This tab centralizes all collaboration and workflow activity for a data asset:
* **All** — every activity on assets you own, follow, or are mentioned in
* **@Mentions** — feeds where you're directly mentioned
* **Tasks** — open tasks created by you or assigned to you, including approval requests and update requests
## Activity Feeds & Tasks Tab
Available for **all asset types**. This tab centralizes all collaboration and workflow activity for a data asset:
* **All** — every activity on assets you own, follow, or are mentioned in
* **@Mentions** — feeds where you're directly mentioned
* **Tasks** — open tasks created by you or assigned to you, including approval requests and update requests
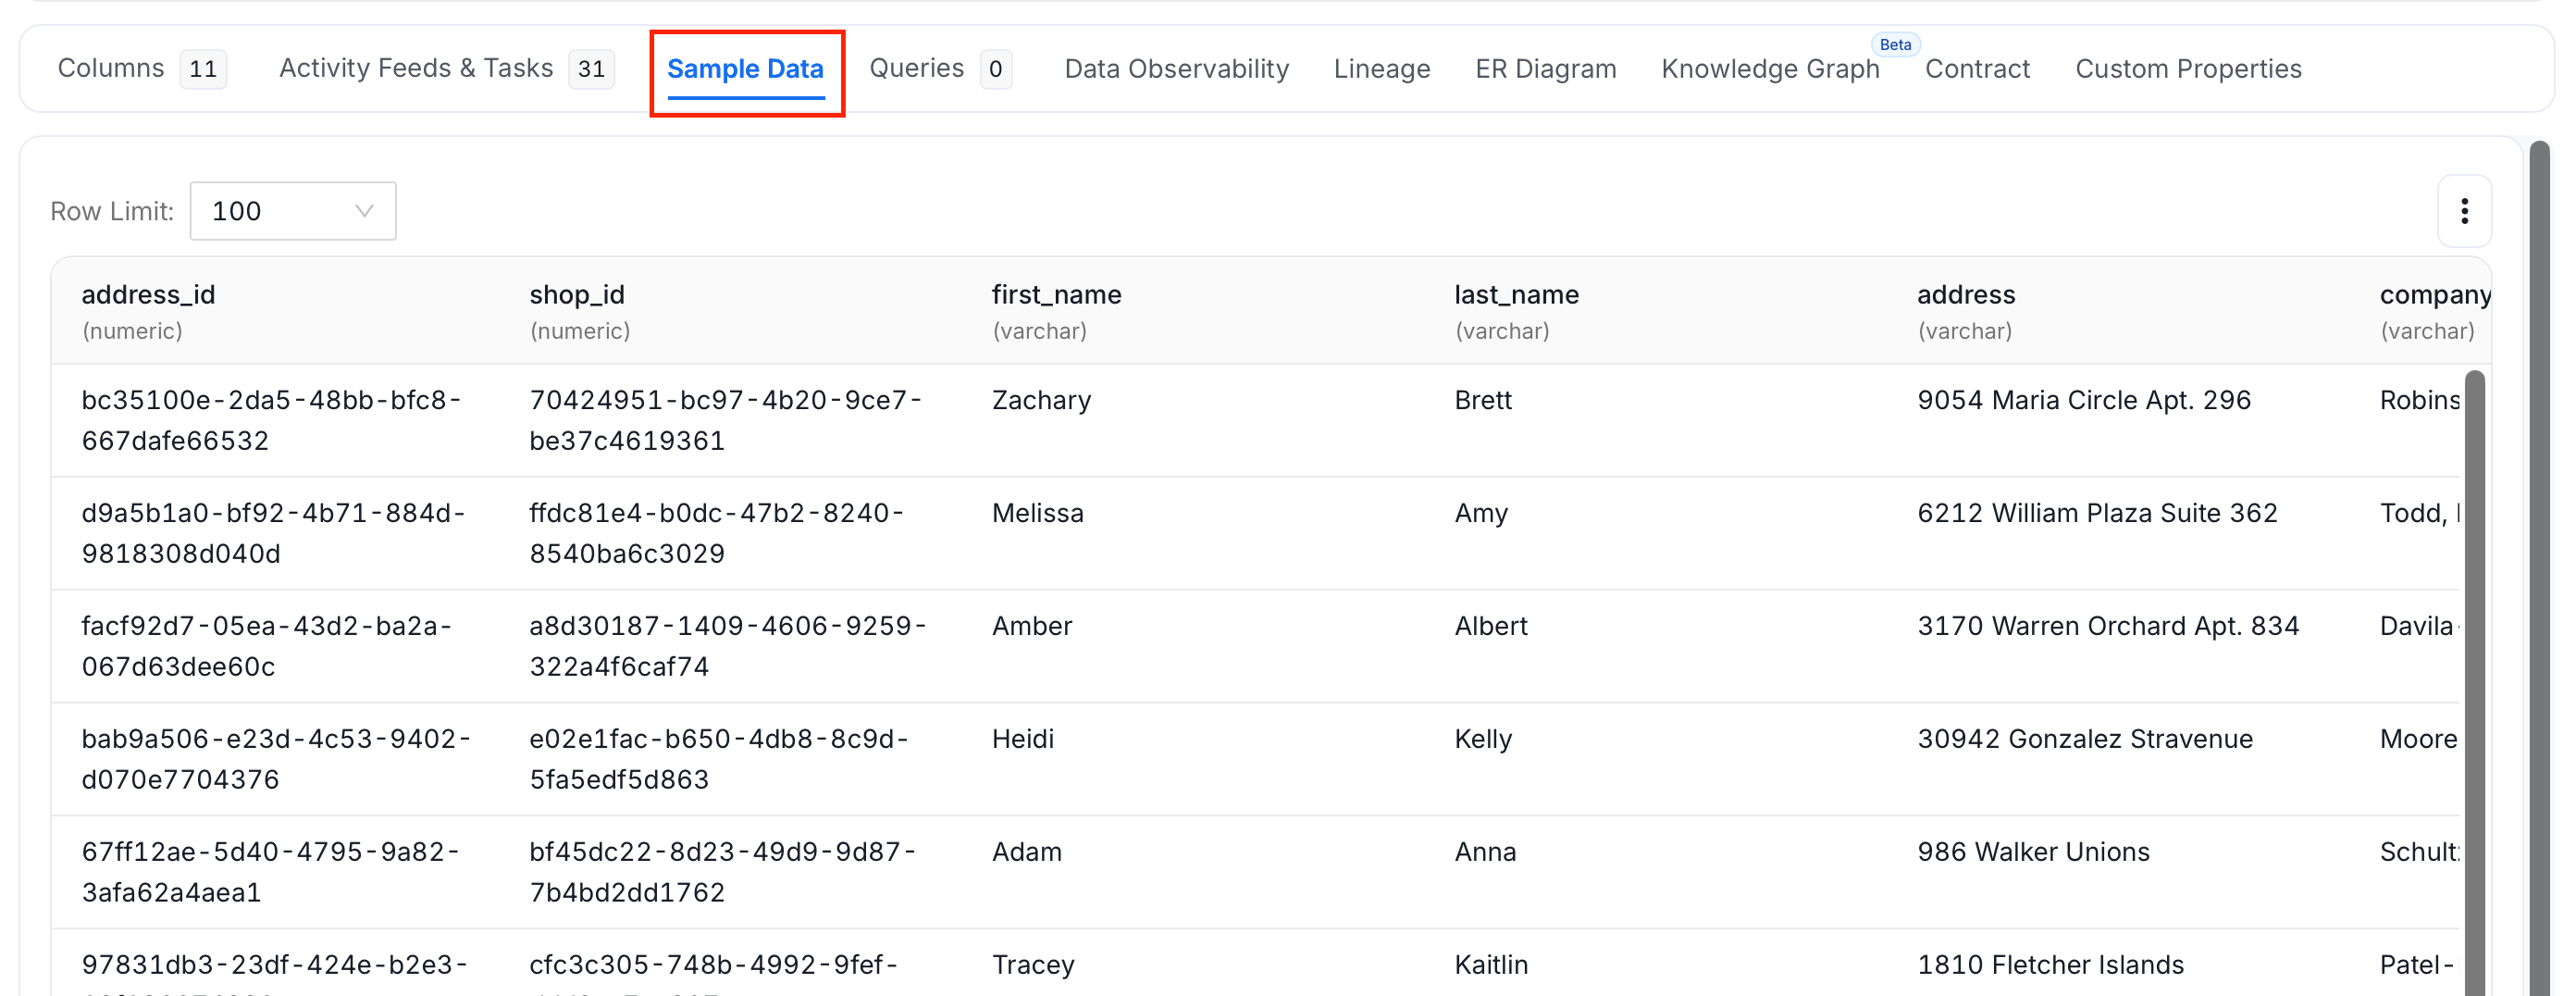
 ## Sample Data Tab
Available for **Tables and Topics**. If sample data ingestion is enabled for the connector, this tab displays a preview of actual data rows — making it easy to understand what the asset contains without writing a query.
## Sample Data Tab
Available for **Tables and Topics**. If sample data ingestion is enabled for the connector, this tab displays a preview of actual data rows — making it easy to understand what the asset contains without writing a query.
 ## Queries Tab
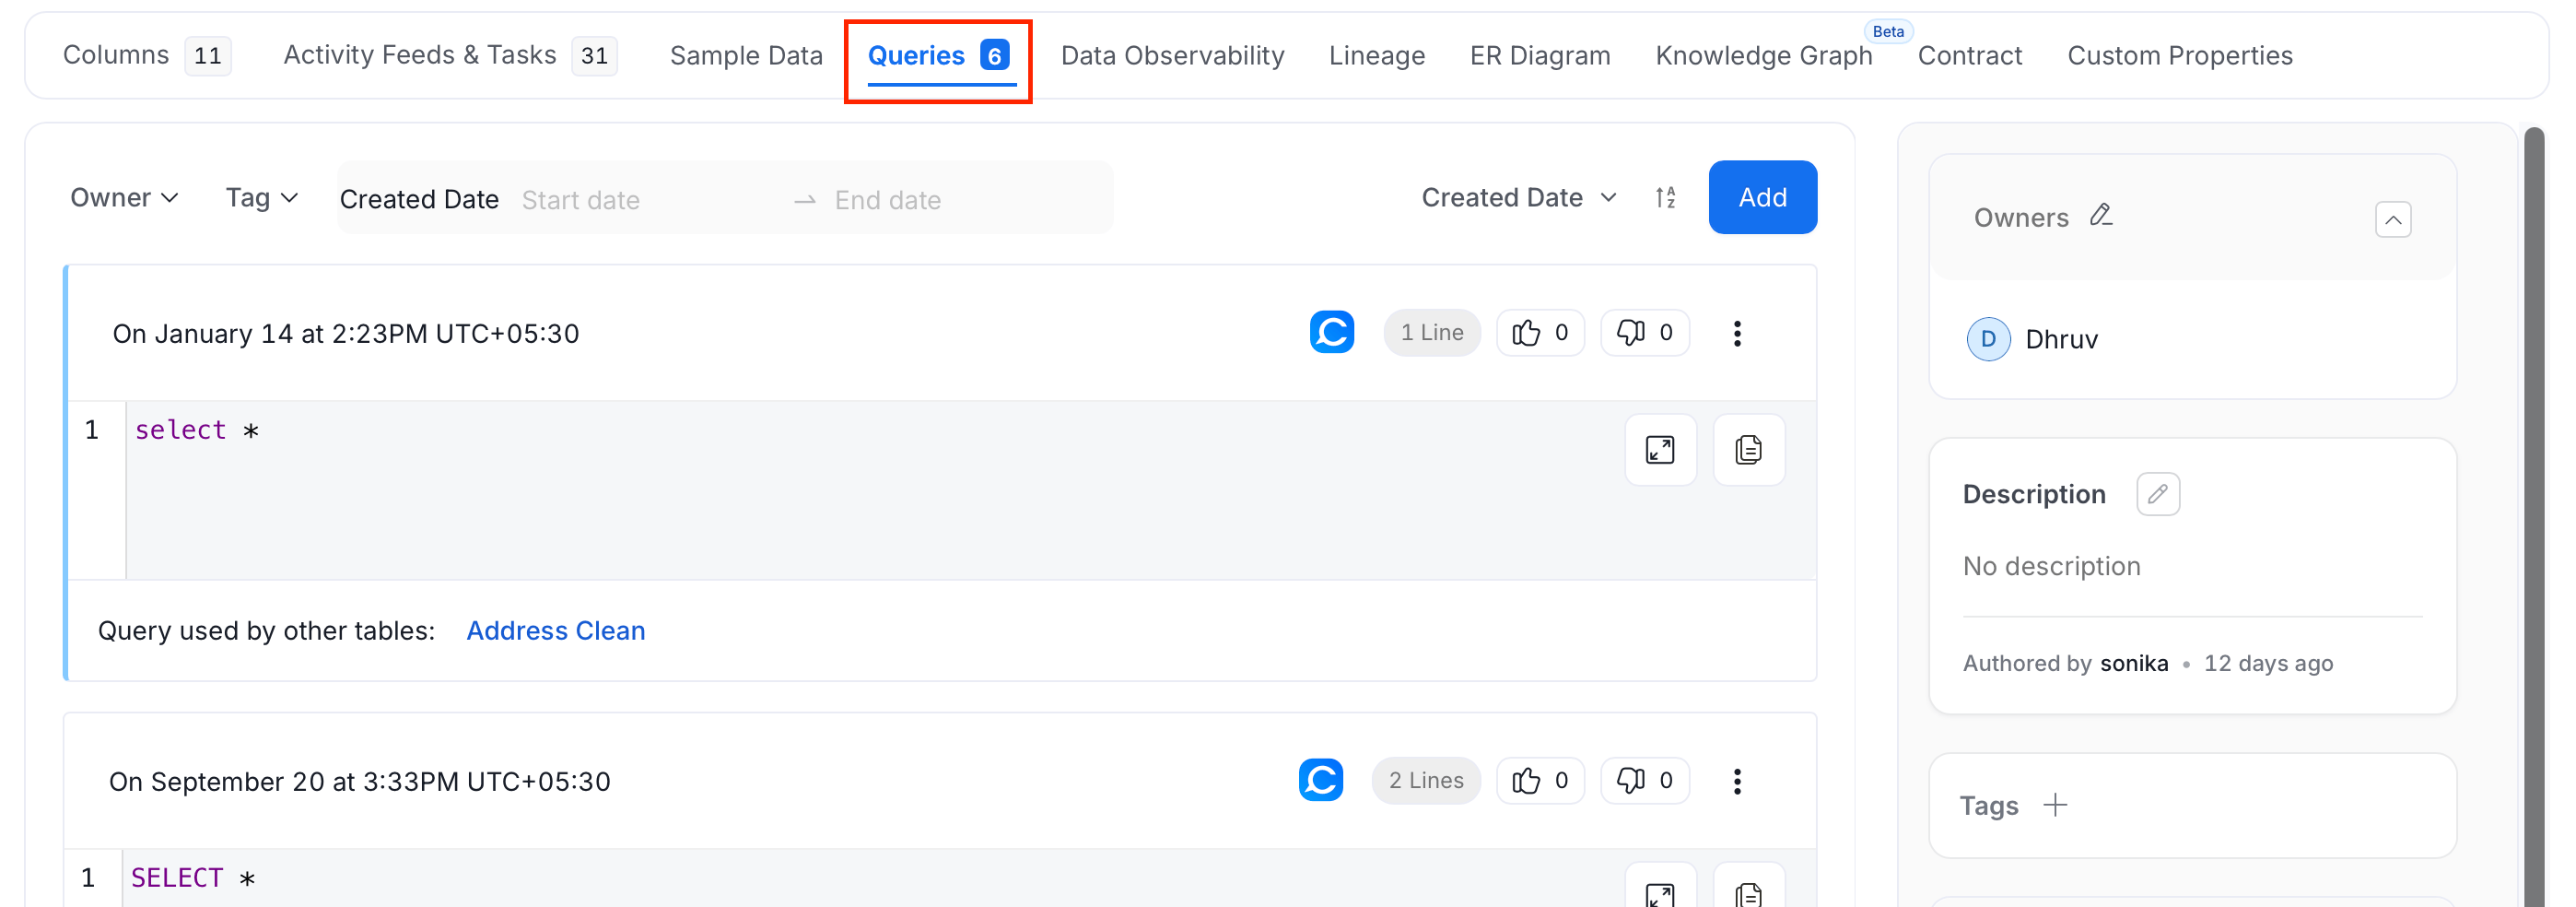
Available for **Tables only**. This tab shows all SQL queries run against the table:
* Query text with syntax highlighting
* When the query was run and how long it took
* Whether the query is used by other tables
* Ability to add new queries manually
## Queries Tab
Available for **Tables only**. This tab shows all SQL queries run against the table:
* Query text with syntax highlighting
* When the query was run and how long it took
* Whether the query is used by other tables
* Ability to add new queries manually
 ## Data Observability Tab
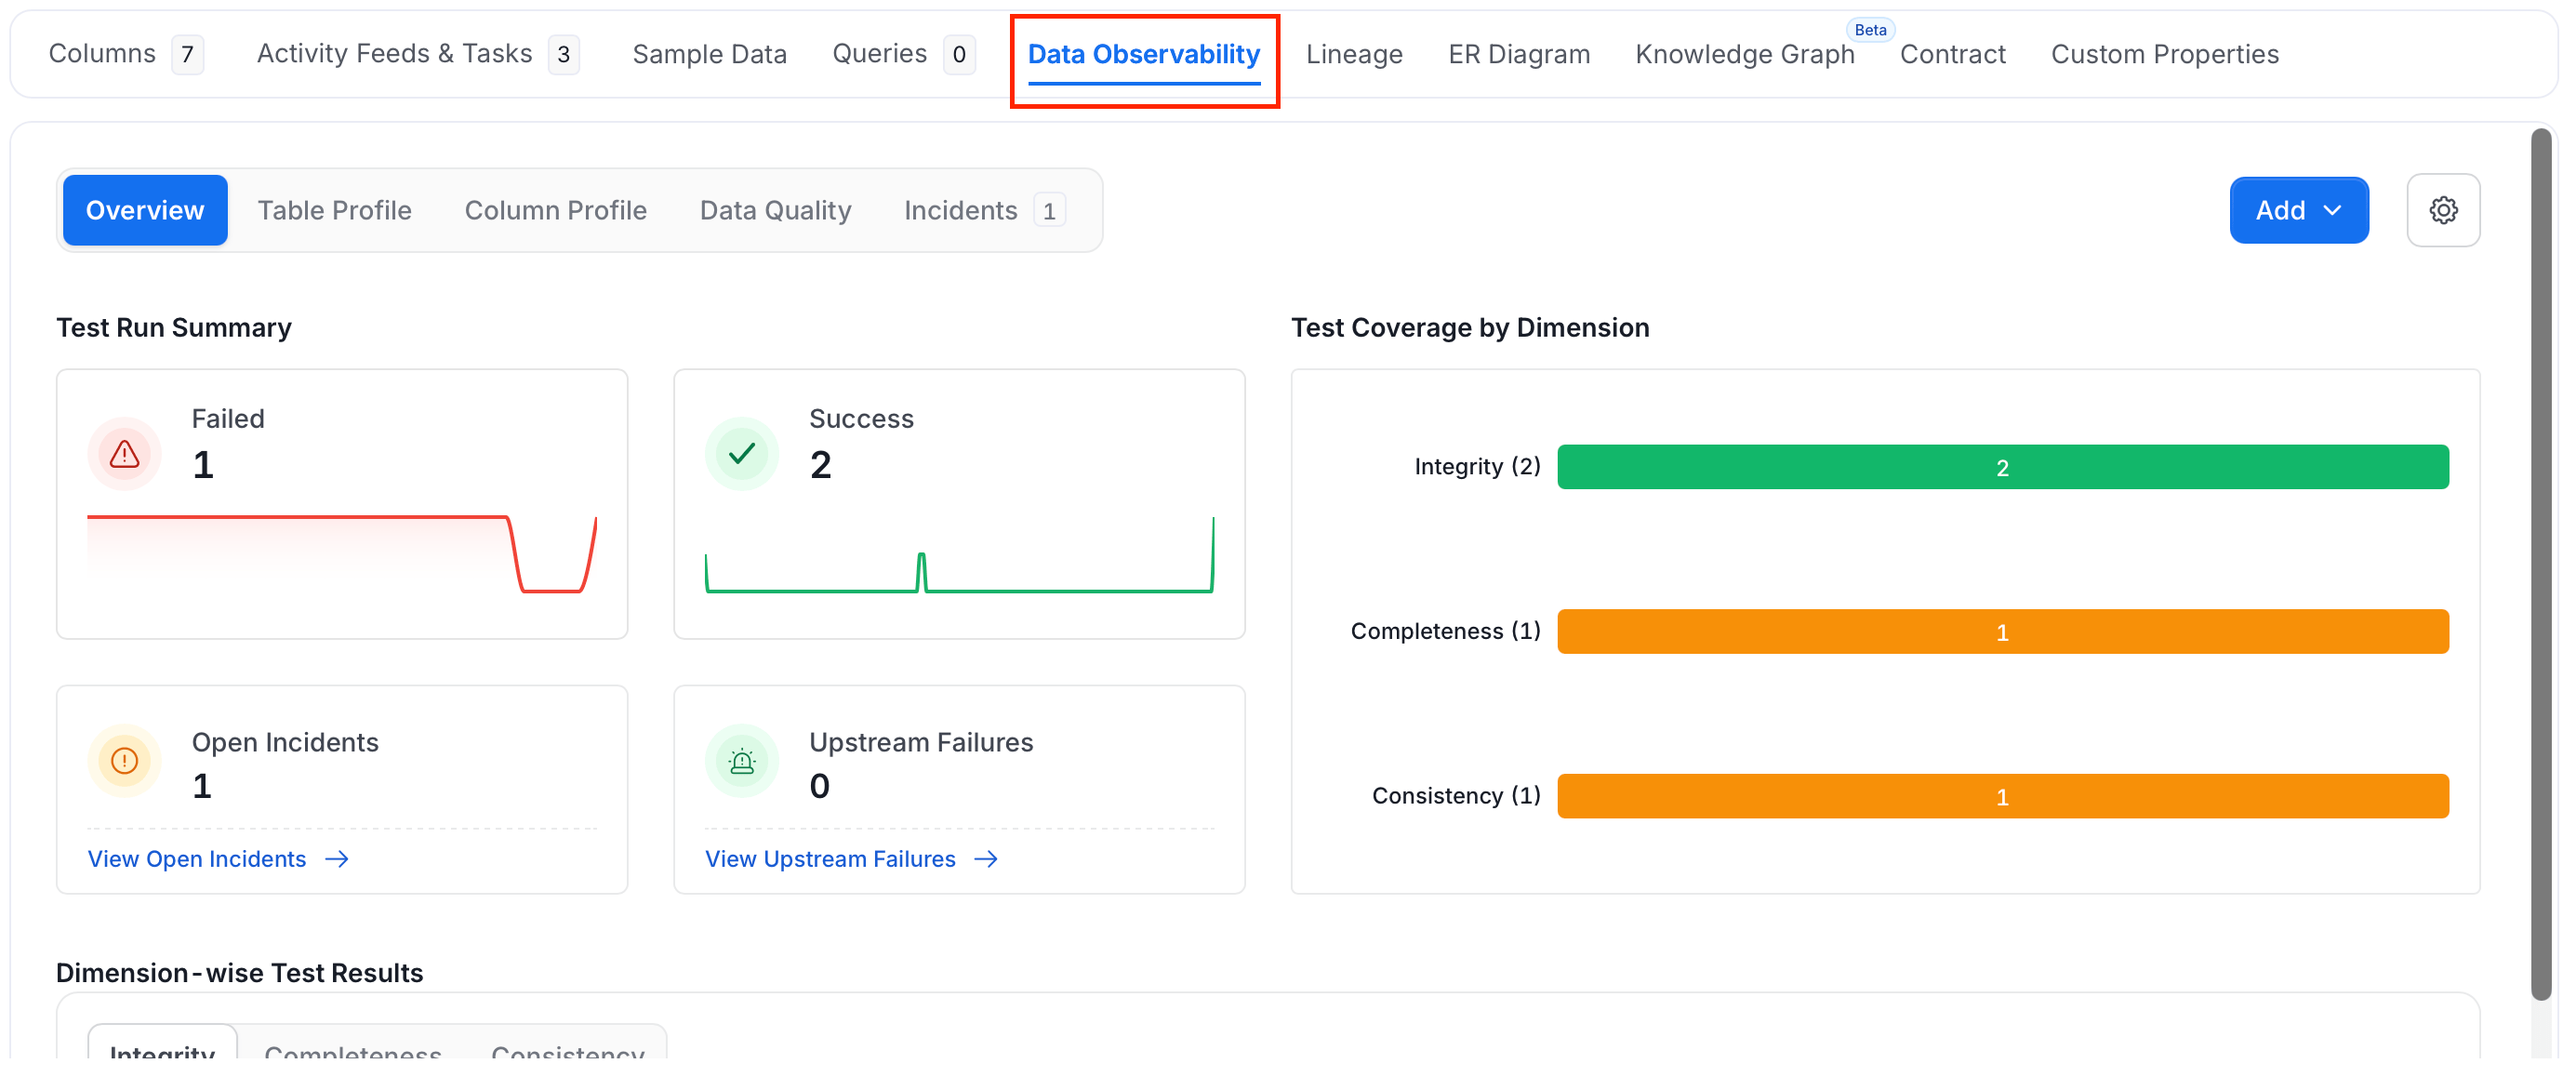
Available for **Tables only**. This tab consolidates profiling, data quality, and observability into a single view with the following sub-tabs:
* **Overview** — test run summary (failed, success, open incidents, upstream failures) and test coverage by dimension
* **Table Profile** — row count, volume trends, and table update frequency
* **Column Profile** — value count, null %, distinct %, and unique % per column
* **Data Quality** — test results at table and column level
* **Incidents** — active anomalies and data quality alerts
## Data Observability Tab
Available for **Tables only**. This tab consolidates profiling, data quality, and observability into a single view with the following sub-tabs:
* **Overview** — test run summary (failed, success, open incidents, upstream failures) and test coverage by dimension
* **Table Profile** — row count, volume trends, and table update frequency
* **Column Profile** — value count, null %, distinct %, and unique % per column
* **Data Quality** — test results at table and column level
* **Incidents** — active anomalies and data quality alerts
 For more detail, see the [Data Observability Tab guide](/ai-2-0/how-to-guides/data-quality-observability/quality/tab).
## Lineage Tab
Available for **all asset types**. The Lineage tab shows the full data journey for an asset:
* End-to-end lineage at both table and column level
* Upstream and downstream dependencies for each node
* Clickable nodes that show asset previews with tags, schema, and quality metrics
For more detail, see the [Data Observability Tab guide](/ai-2-0/how-to-guides/data-quality-observability/quality/tab).
## Lineage Tab
Available for **all asset types**. The Lineage tab shows the full data journey for an asset:
* End-to-end lineage at both table and column level
* Upstream and downstream dependencies for each node
* Clickable nodes that show asset previews with tags, schema, and quality metrics
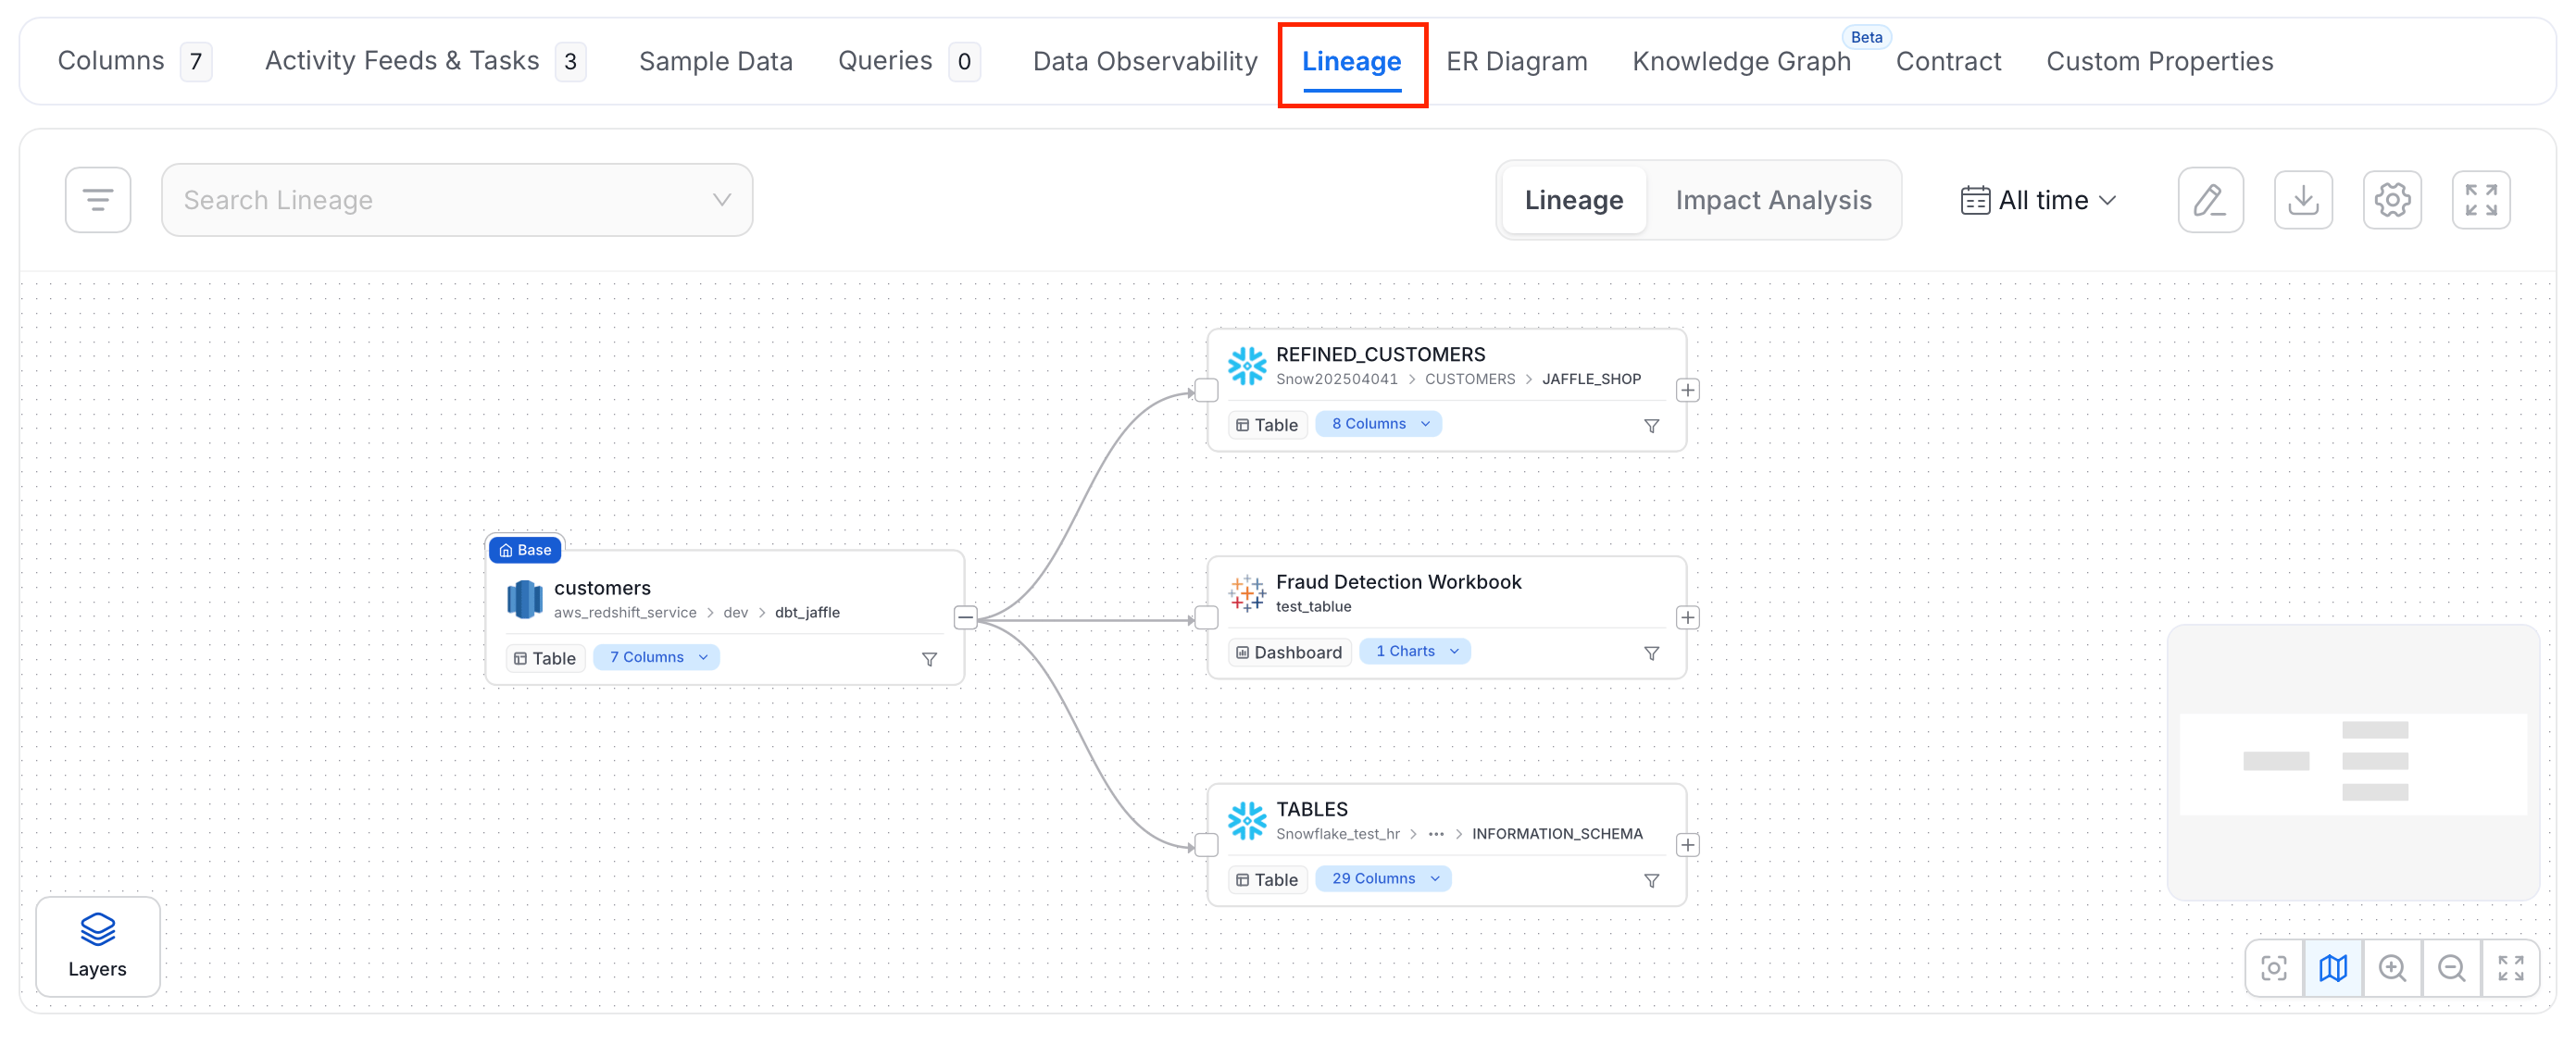 Use the **Settings** icon to configure how many upstream/downstream nodes and layers to display. Use the **Edit** icon to manually add or adjust lineage connections using the no-code editor.
## ER Diagram Tab
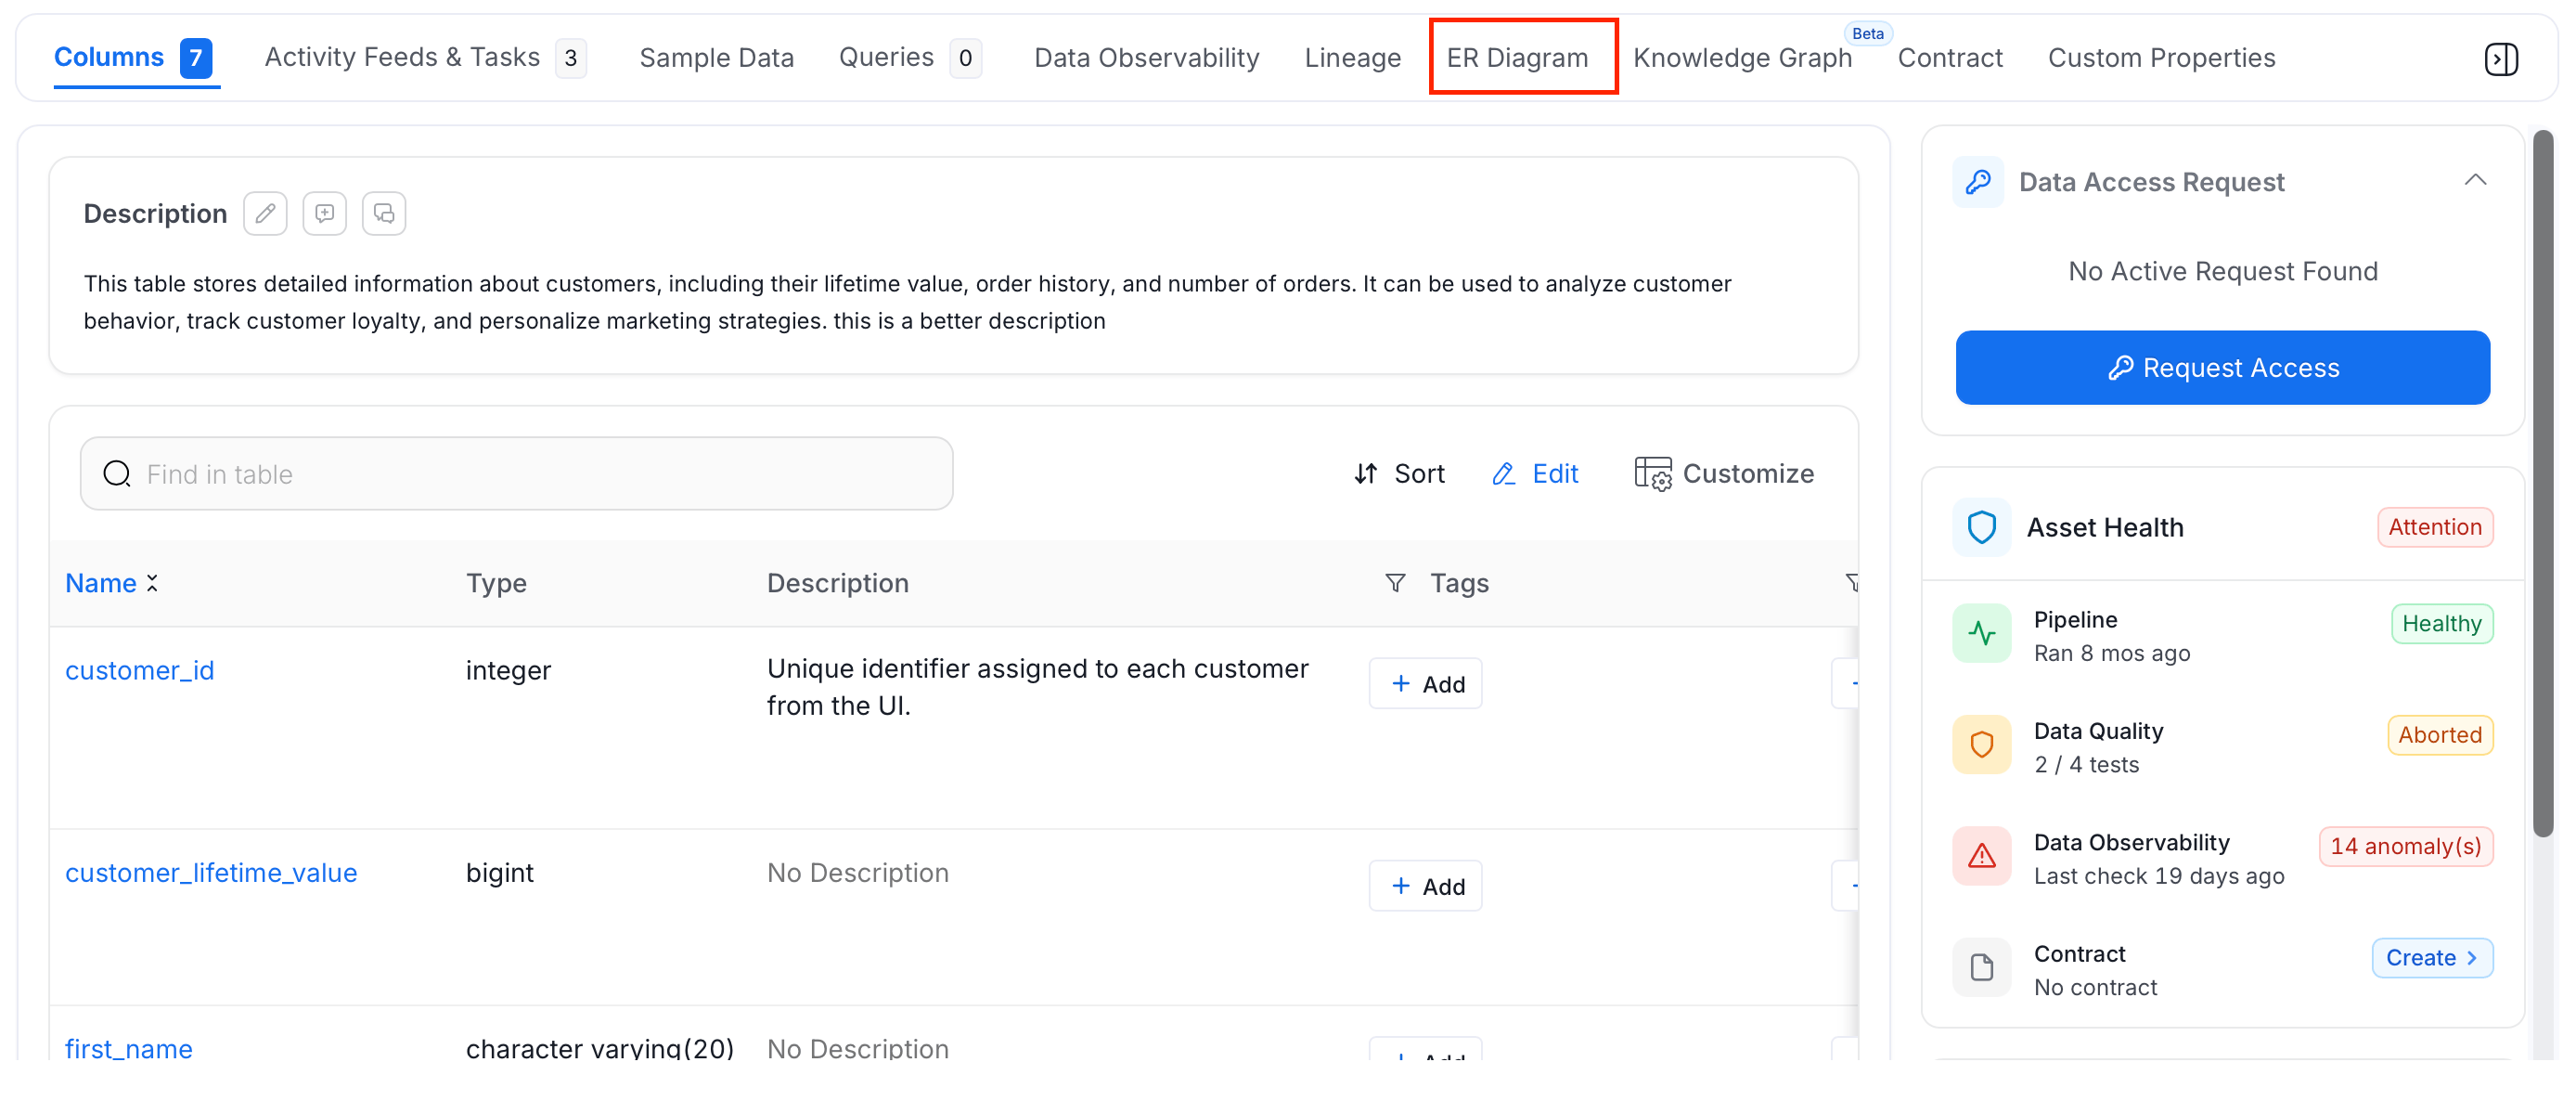
Available for **Tables only**. The ER Diagram tab shows the entity-relationship view of the table — how it connects to other tables through foreign keys and join patterns. This is useful for quickly understanding data model structure and table relationships.
Use the **Settings** icon to configure how many upstream/downstream nodes and layers to display. Use the **Edit** icon to manually add or adjust lineage connections using the no-code editor.
## ER Diagram Tab
Available for **Tables only**. The ER Diagram tab shows the entity-relationship view of the table — how it connects to other tables through foreign keys and join patterns. This is useful for quickly understanding data model structure and table relationships.
 ## Knowledge Graph Tab
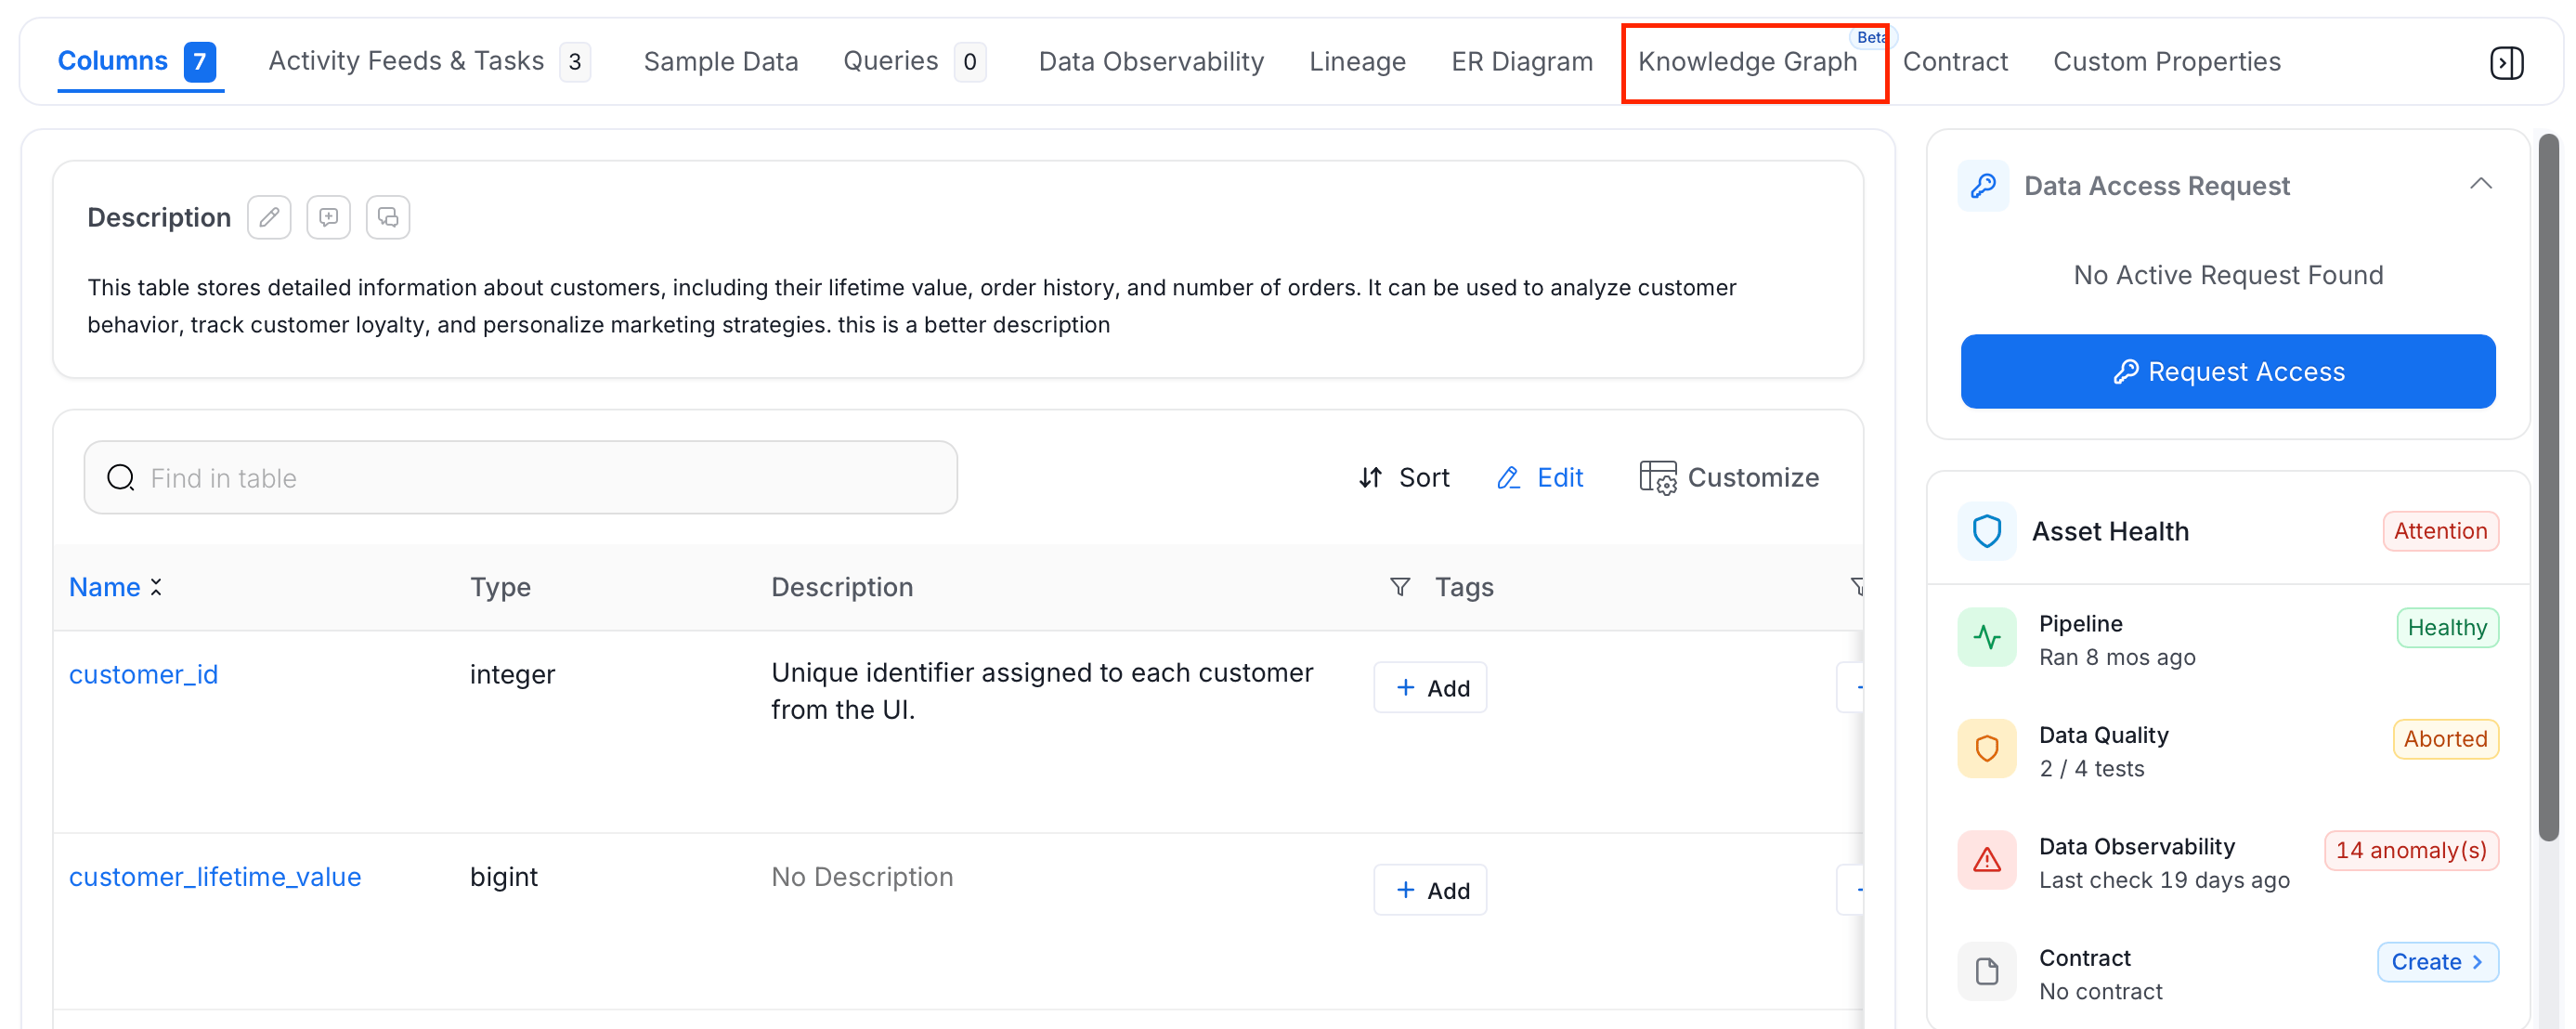
Available for **Tables** (Beta). The Knowledge Graph tab visualizes semantic relationships between the selected asset and other assets, glossary terms, and business concepts — surfacing hidden connections across your data platform.
## Knowledge Graph Tab
Available for **Tables** (Beta). The Knowledge Graph tab visualizes semantic relationships between the selected asset and other assets, glossary terms, and business concepts — surfacing hidden connections across your data platform.
 ## Contract Tab
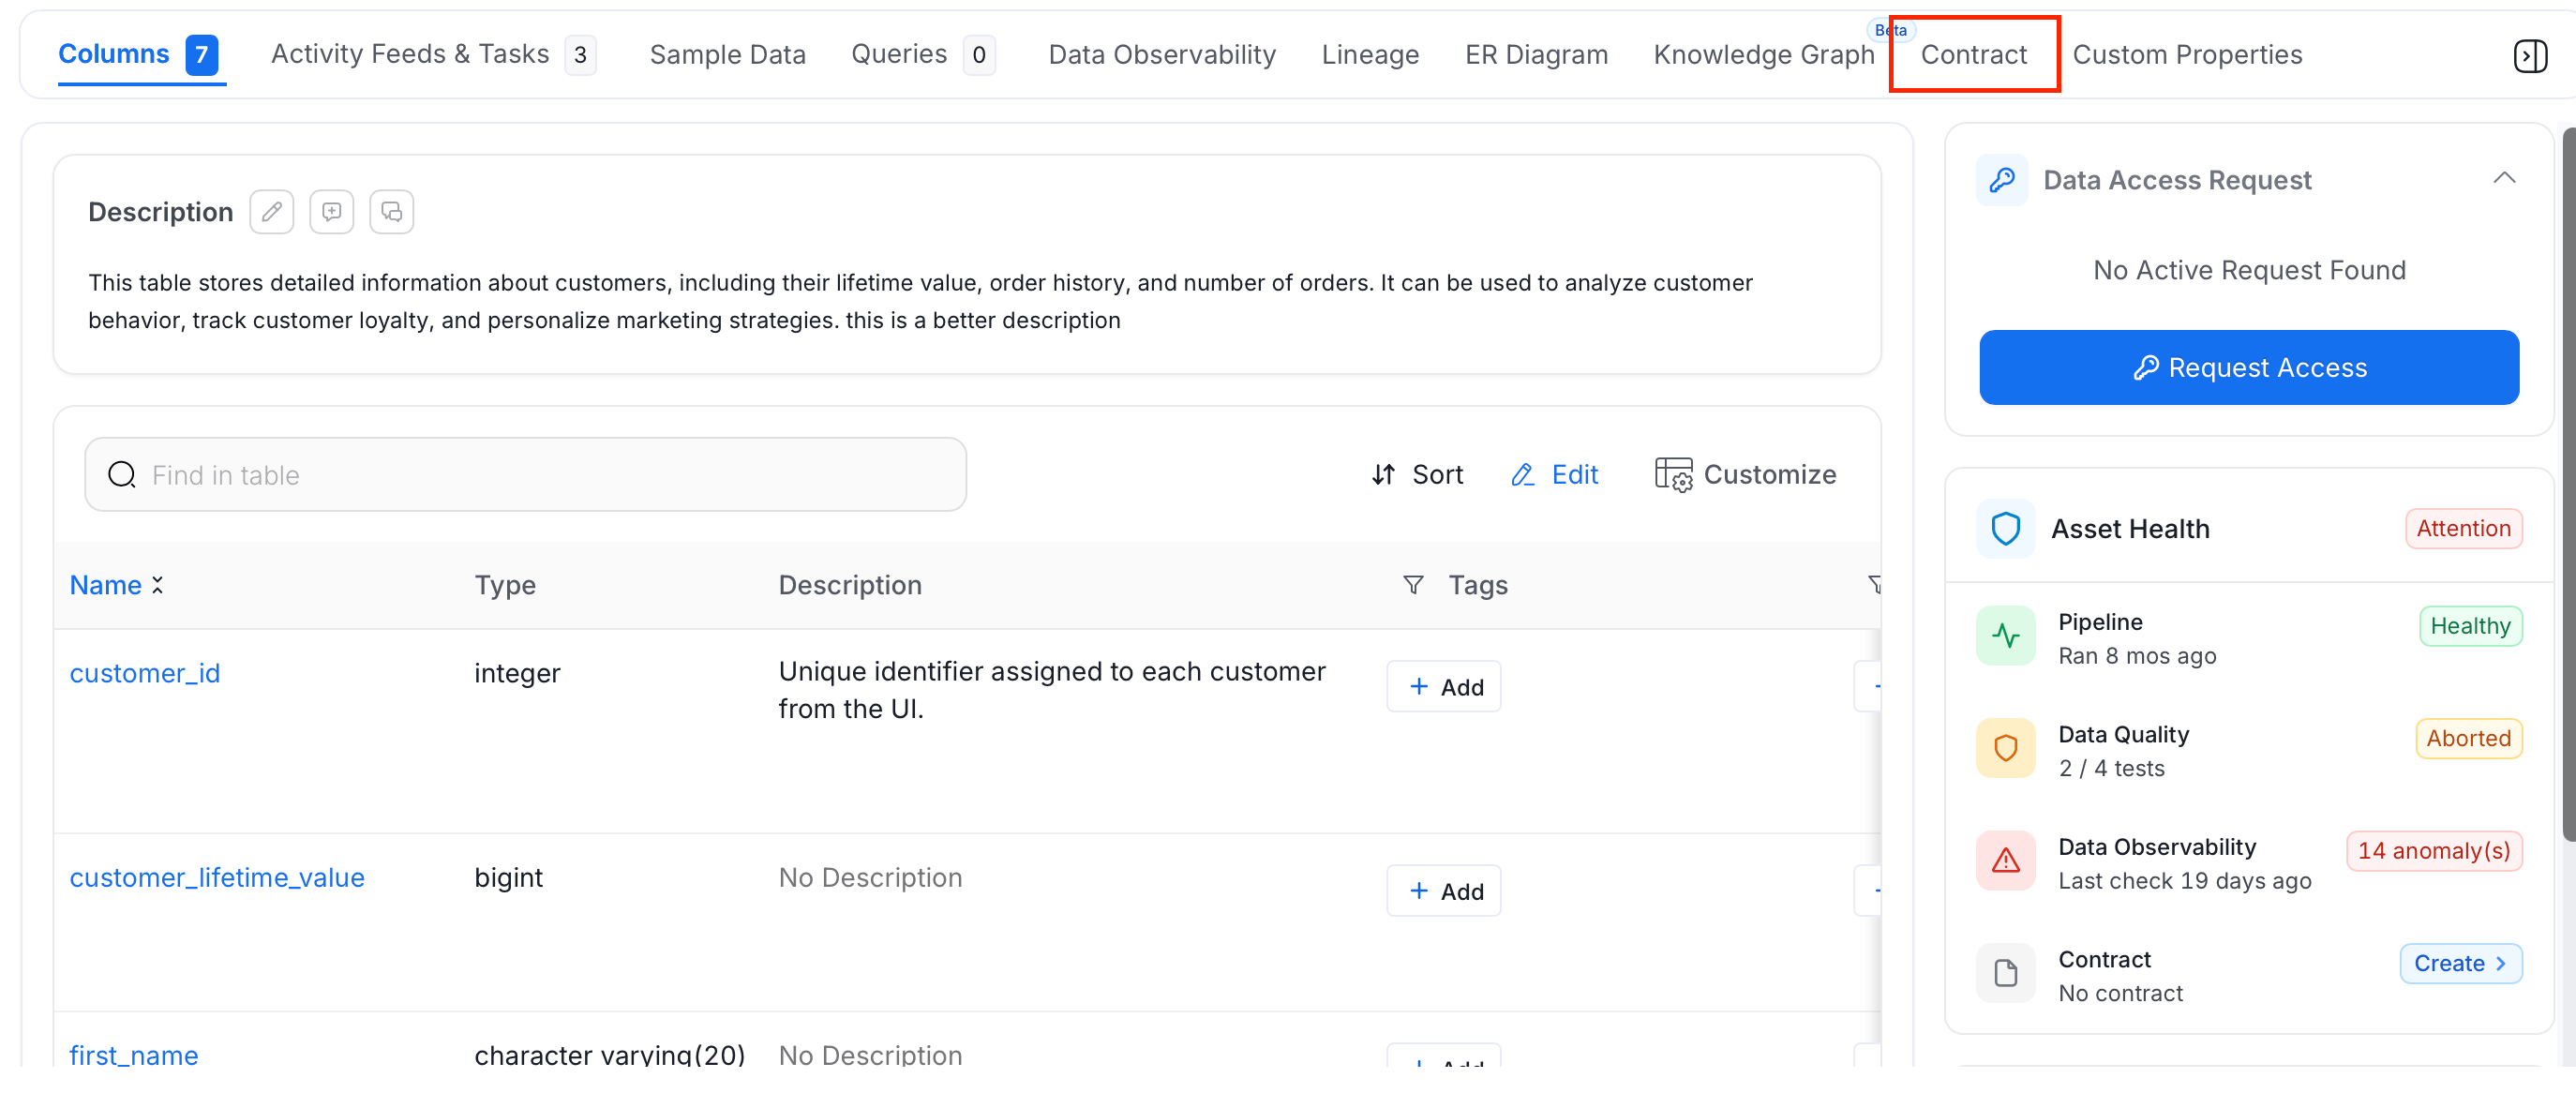
Available for **all asset types**. Data Contracts define the expected quality, schema, and ownership agreement for a data asset. From this tab you can:
* View any active contract and its compliance status
* Create a new contract if none exists
* Track who owns the contract and when it was last updated
## Contract Tab
Available for **all asset types**. Data Contracts define the expected quality, schema, and ownership agreement for a data asset. From this tab you can:
* View any active contract and its compliance status
* Create a new contract if none exists
* Track who owns the contract and when it was last updated
 ## Custom Properties Tab
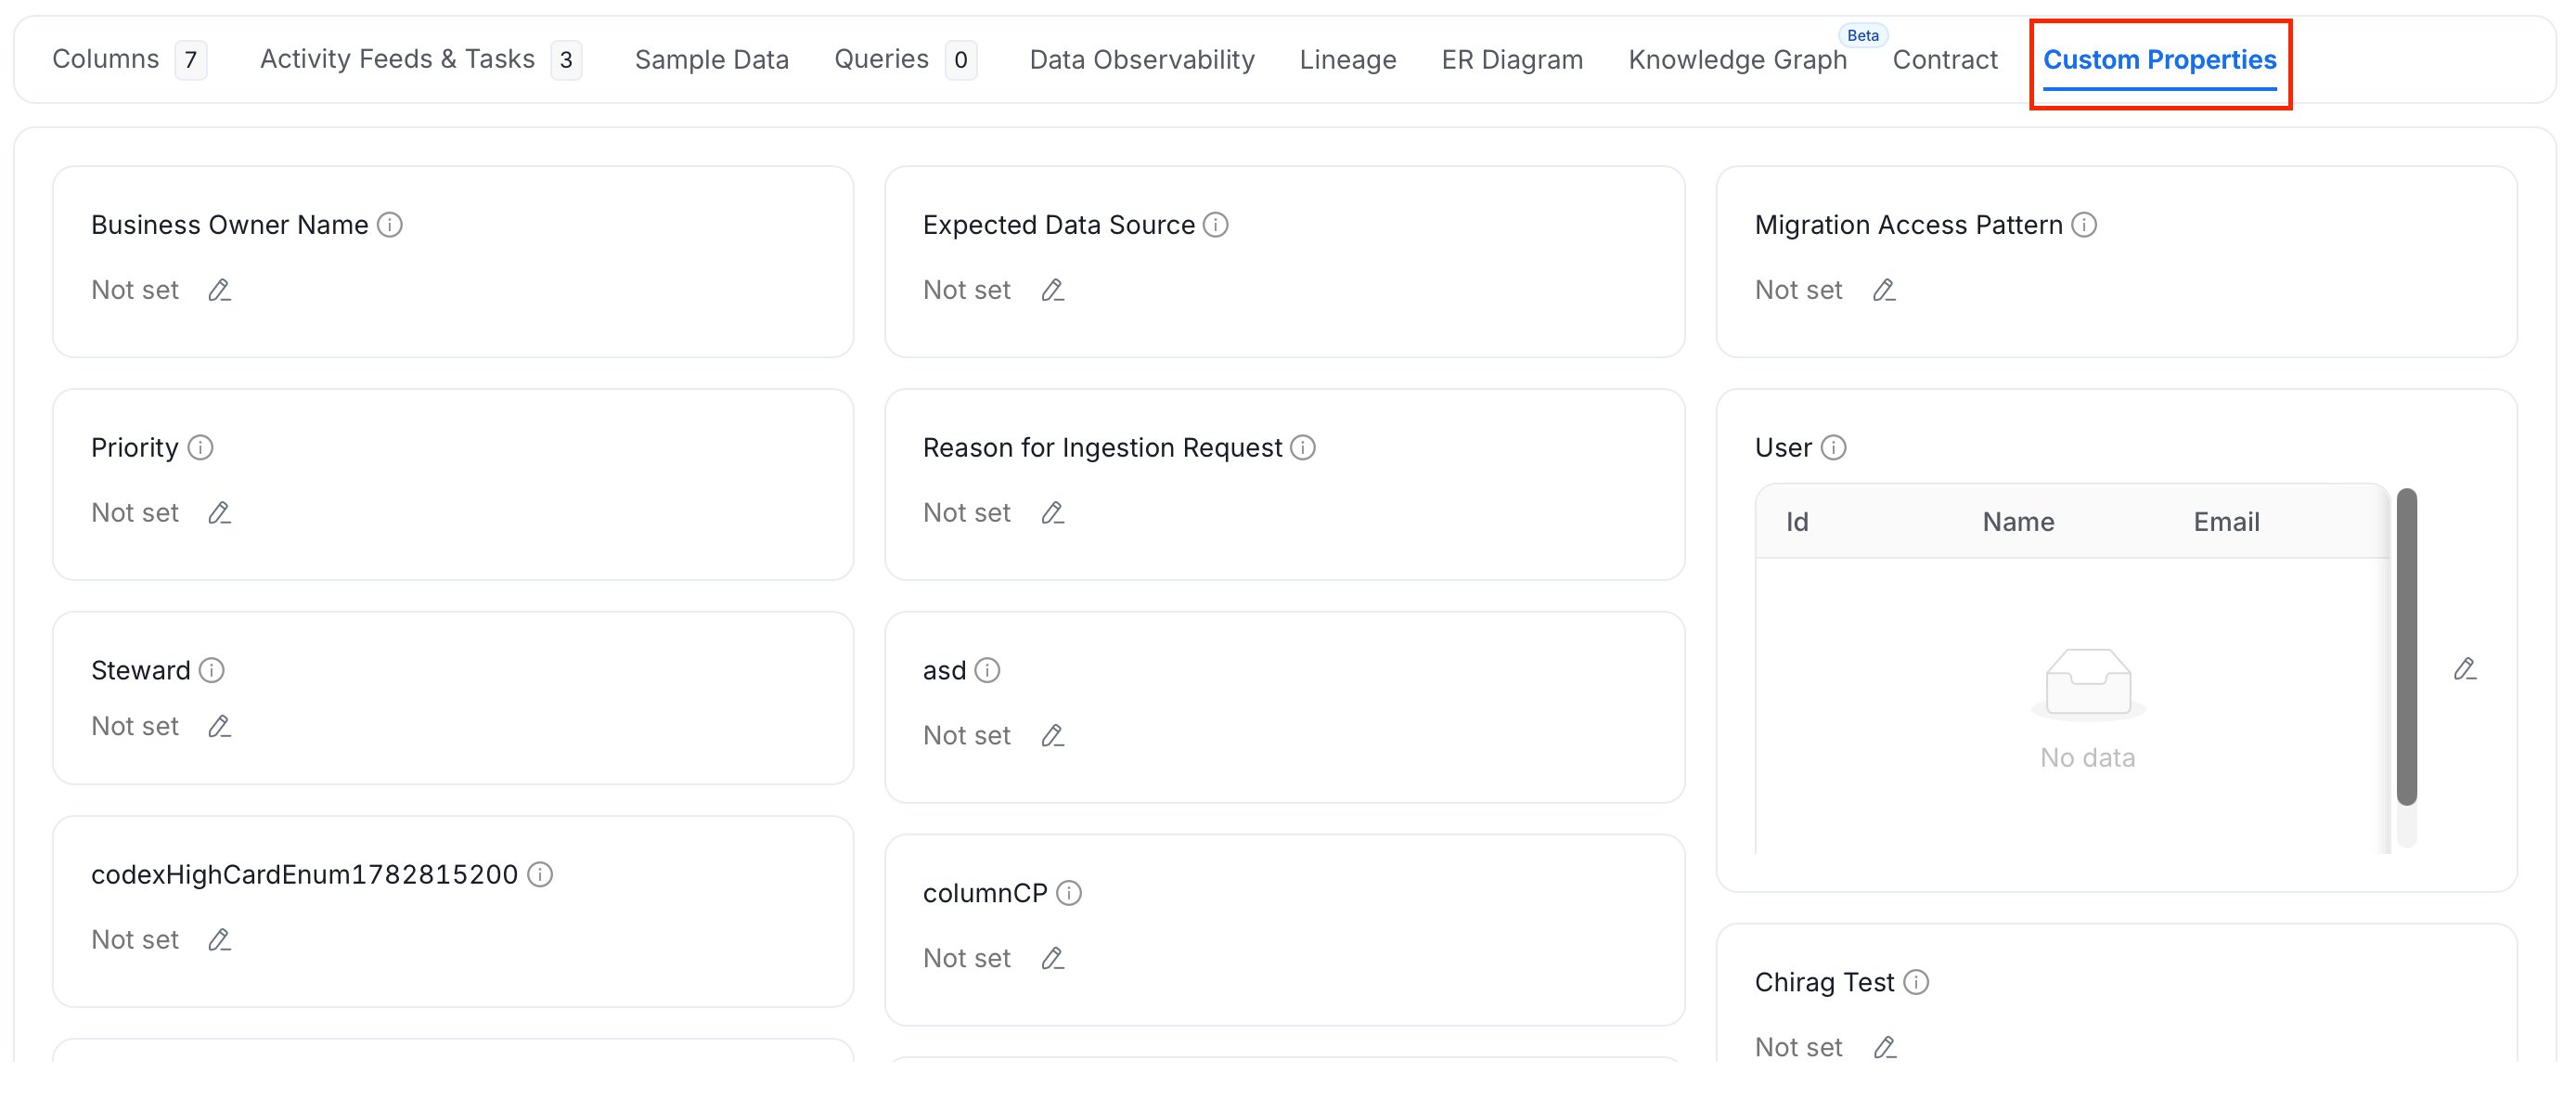
Available for **all asset types**. Organizations can define custom attributes to extend standard metadata. This tab lets users view and edit those values directly — for example, business owner name, data classification, compliance tier, or SLA requirements.
## Custom Properties Tab
Available for **all asset types**. Organizations can define custom attributes to extend standard metadata. This tab lets users view and edit those values directly — for example, business owner name, data classification, compliance tier, or SLA requirements.
 Learn [How to Create a Custom Property for a Data Asset](/ai-2-0/how-to-guides/guide-for-data-users/custom).
## Config Tab
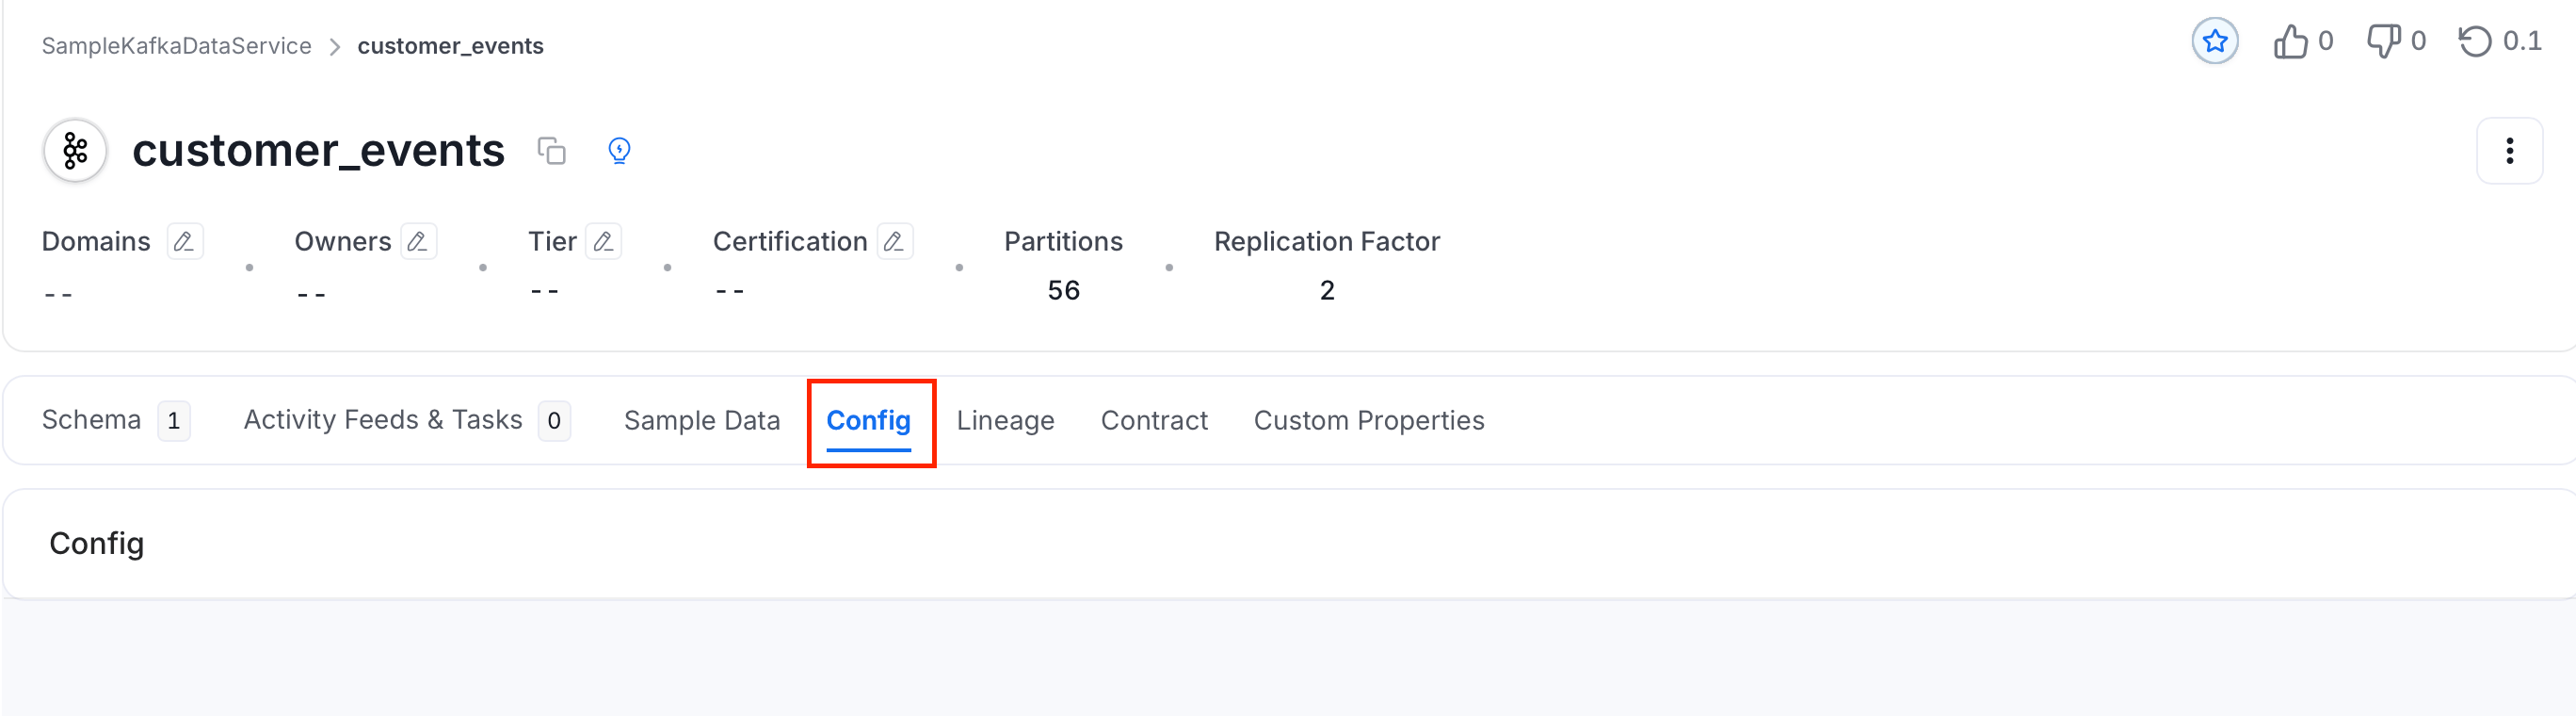
Available for **Topics only**. The Config tab shows the technical configuration of a messaging topic, such as partition count, replication factor, cleanup policy, and retention settings.
Learn [How to Create a Custom Property for a Data Asset](/ai-2-0/how-to-guides/guide-for-data-users/custom).
## Config Tab
Available for **Topics only**. The Config tab shows the technical configuration of a messaging topic, such as partition count, replication factor, cleanup policy, and retention settings.
 ## Details Tab
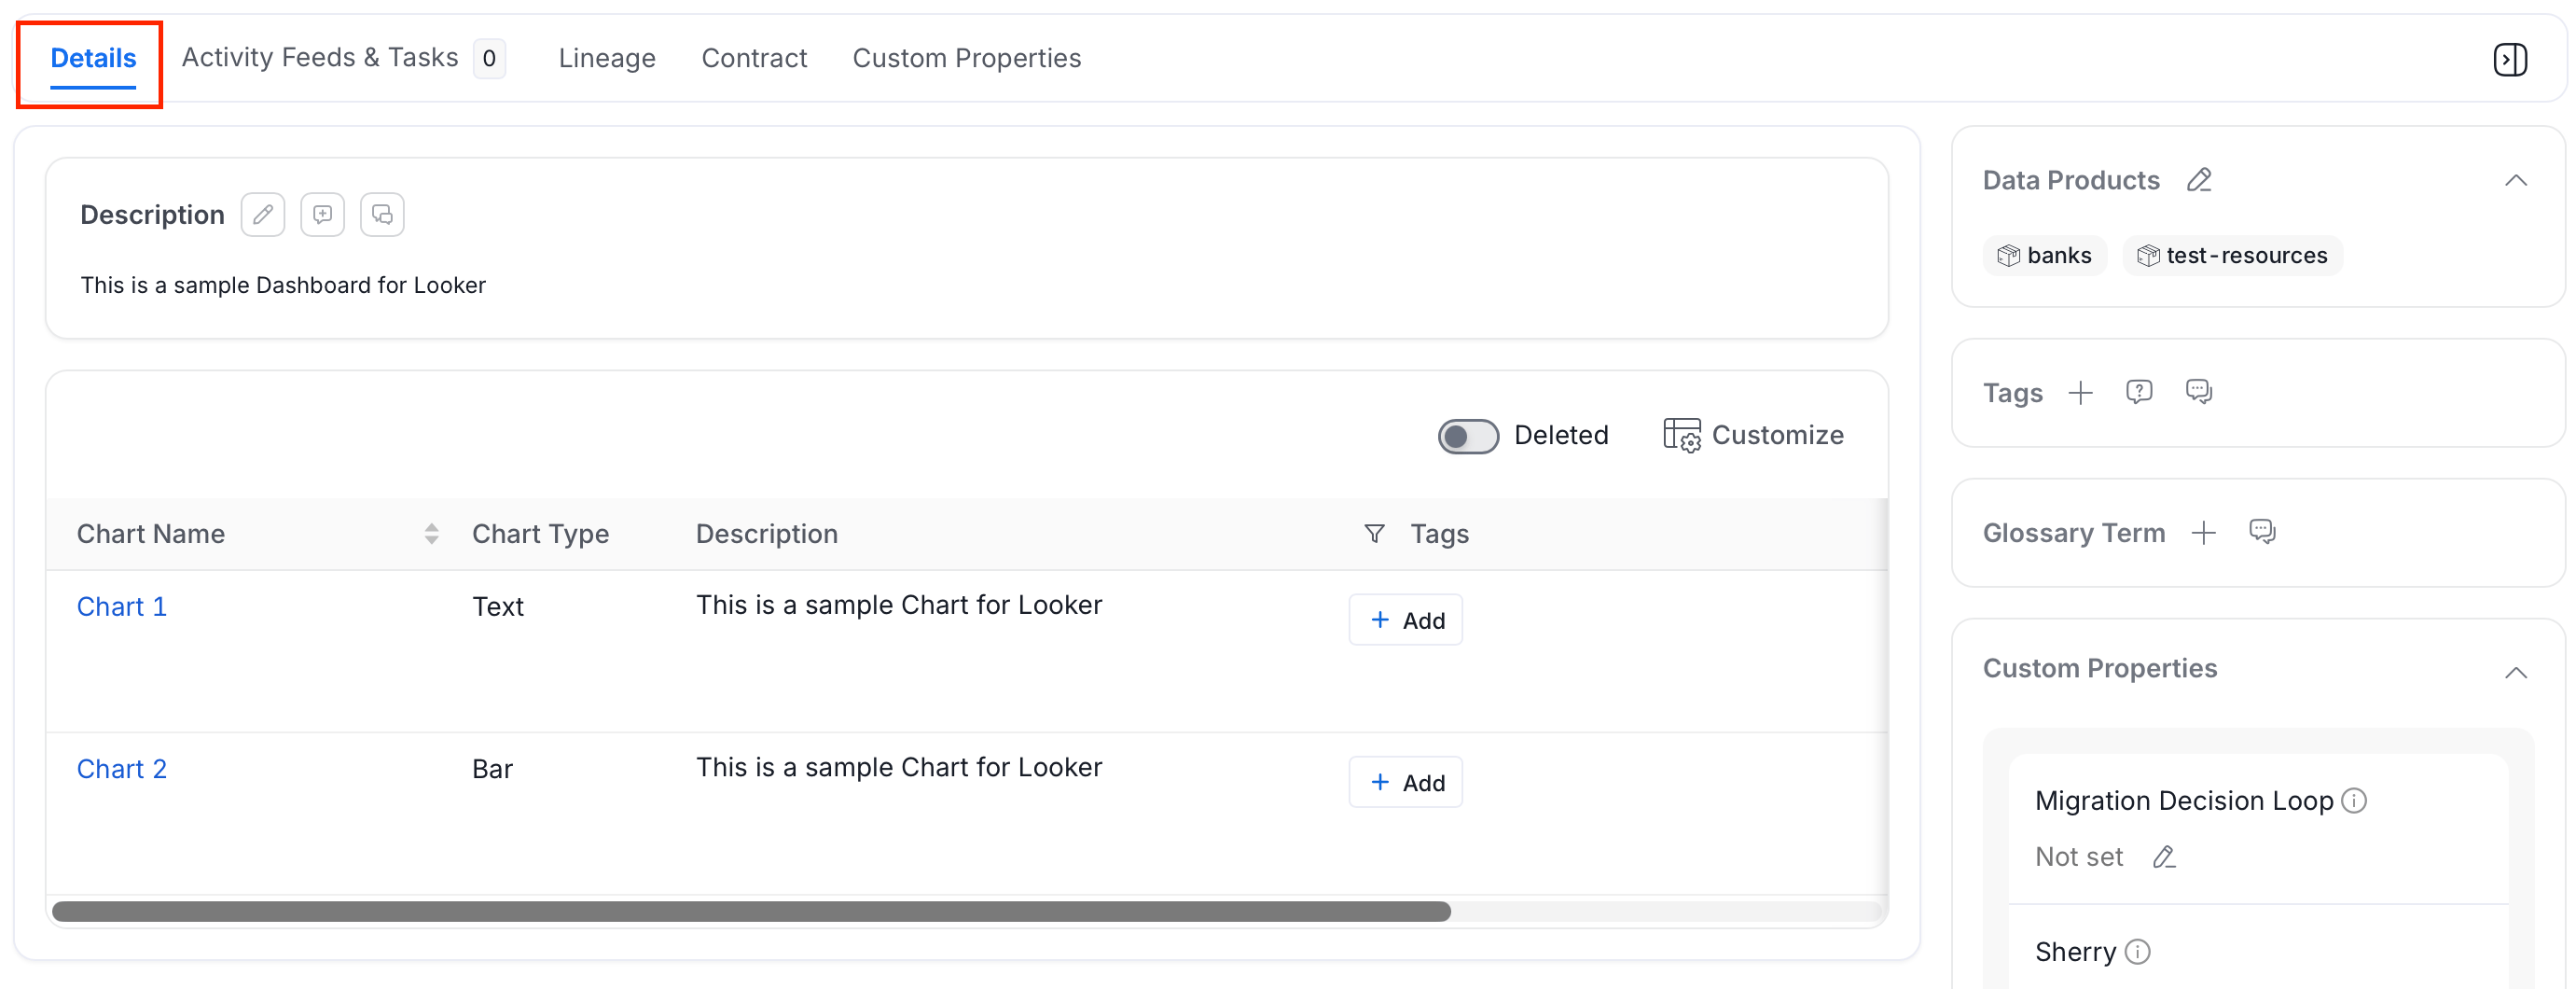
Available for **Dashboards and ML Models**.
**For Dashboards** — displays the list of charts with:
* Chart name and type
* Description and associated tags
**For ML Models** — displays Hyper Parameters and Model Store details.
## Details Tab
Available for **Dashboards and ML Models**.
**For Dashboards** — displays the list of charts with:
* Chart name and type
* Description and associated tags
**For ML Models** — displays Hyper Parameters and Model Store details.
 ## Executions Tab
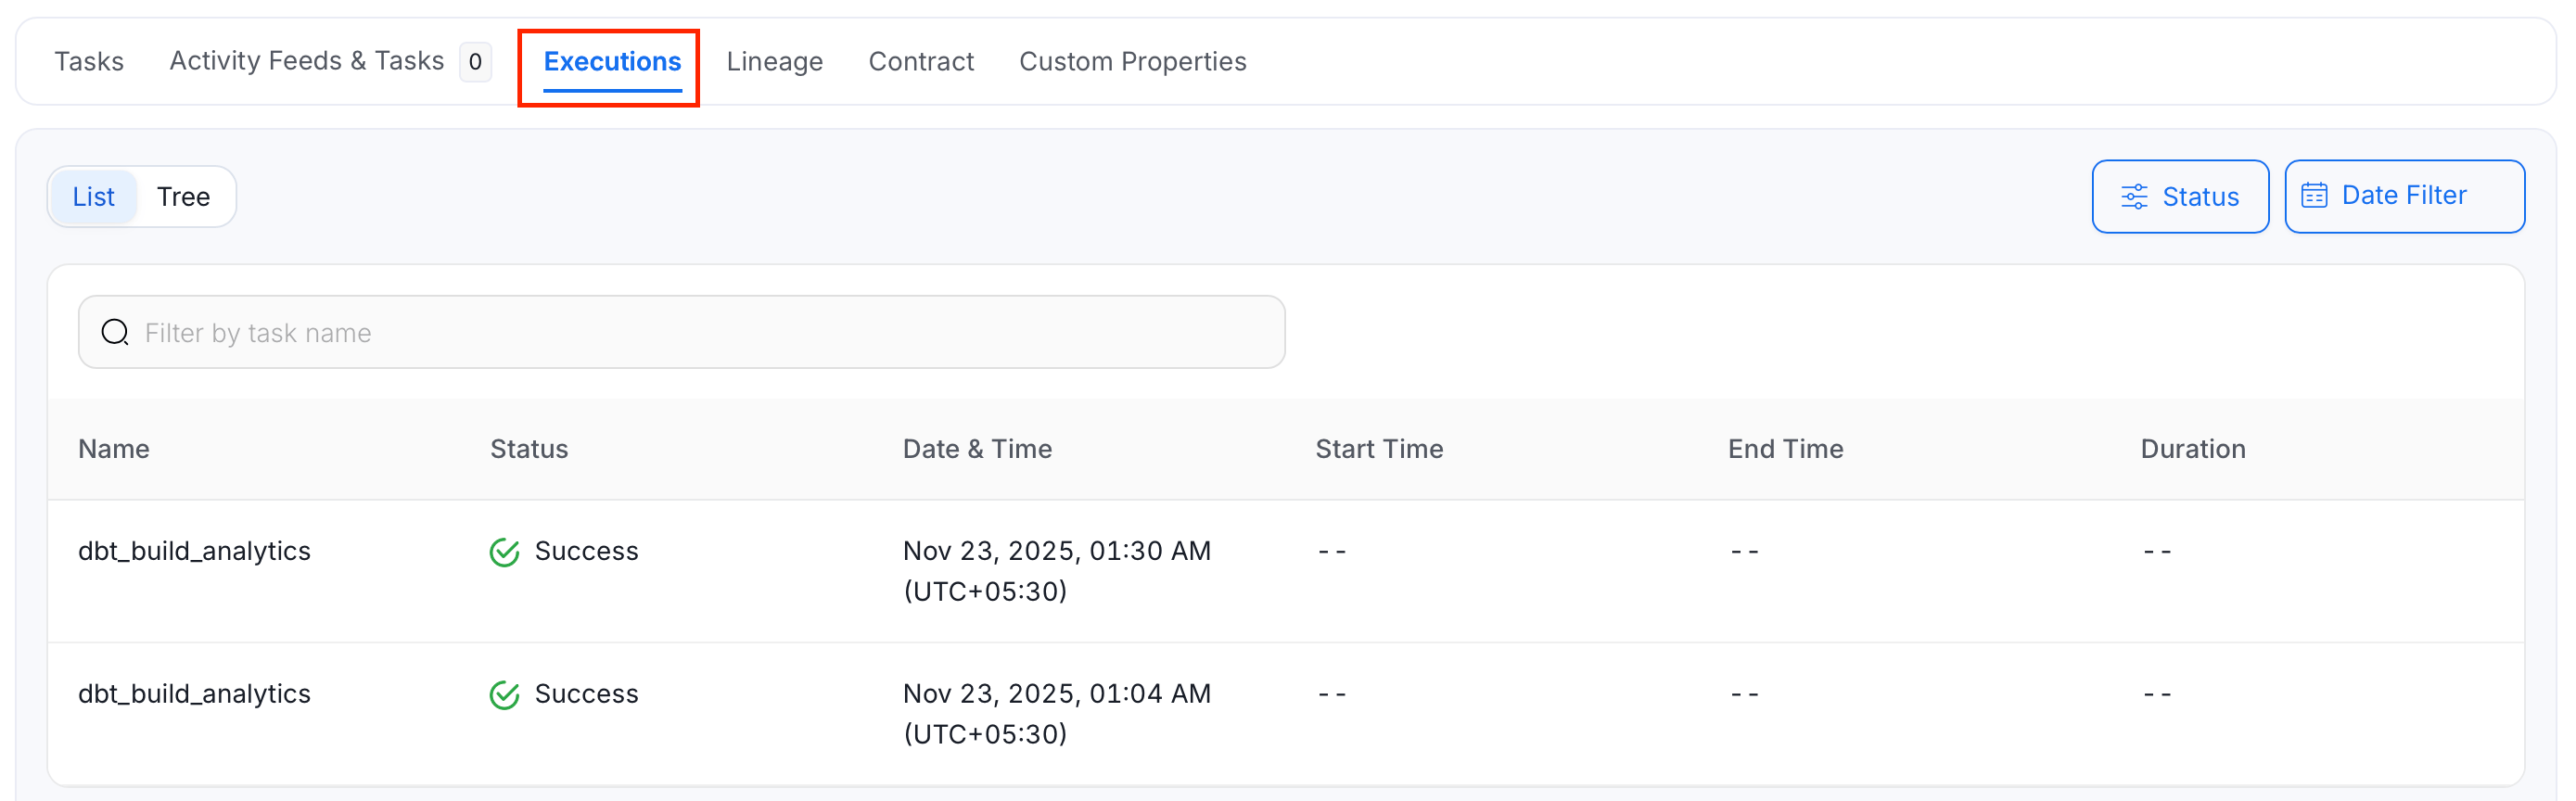
Available for **Pipelines only**. The Executions tab shows a history of all pipeline runs:
* Date, time, and duration of each run
* Status: **Success**, **Failure**, **Pending**, or **Aborted**
* View runs as a chronological list or as a tree
* Filter by status and date range
## Executions Tab
Available for **Pipelines only**. The Executions tab shows a history of all pipeline runs:
* Date, time, and duration of each run
* Status: **Success**, **Failure**, **Pending**, or **Aborted**
* View runs as a chronological list or as a tree
* Filter by status and date range
 ## Features Tab
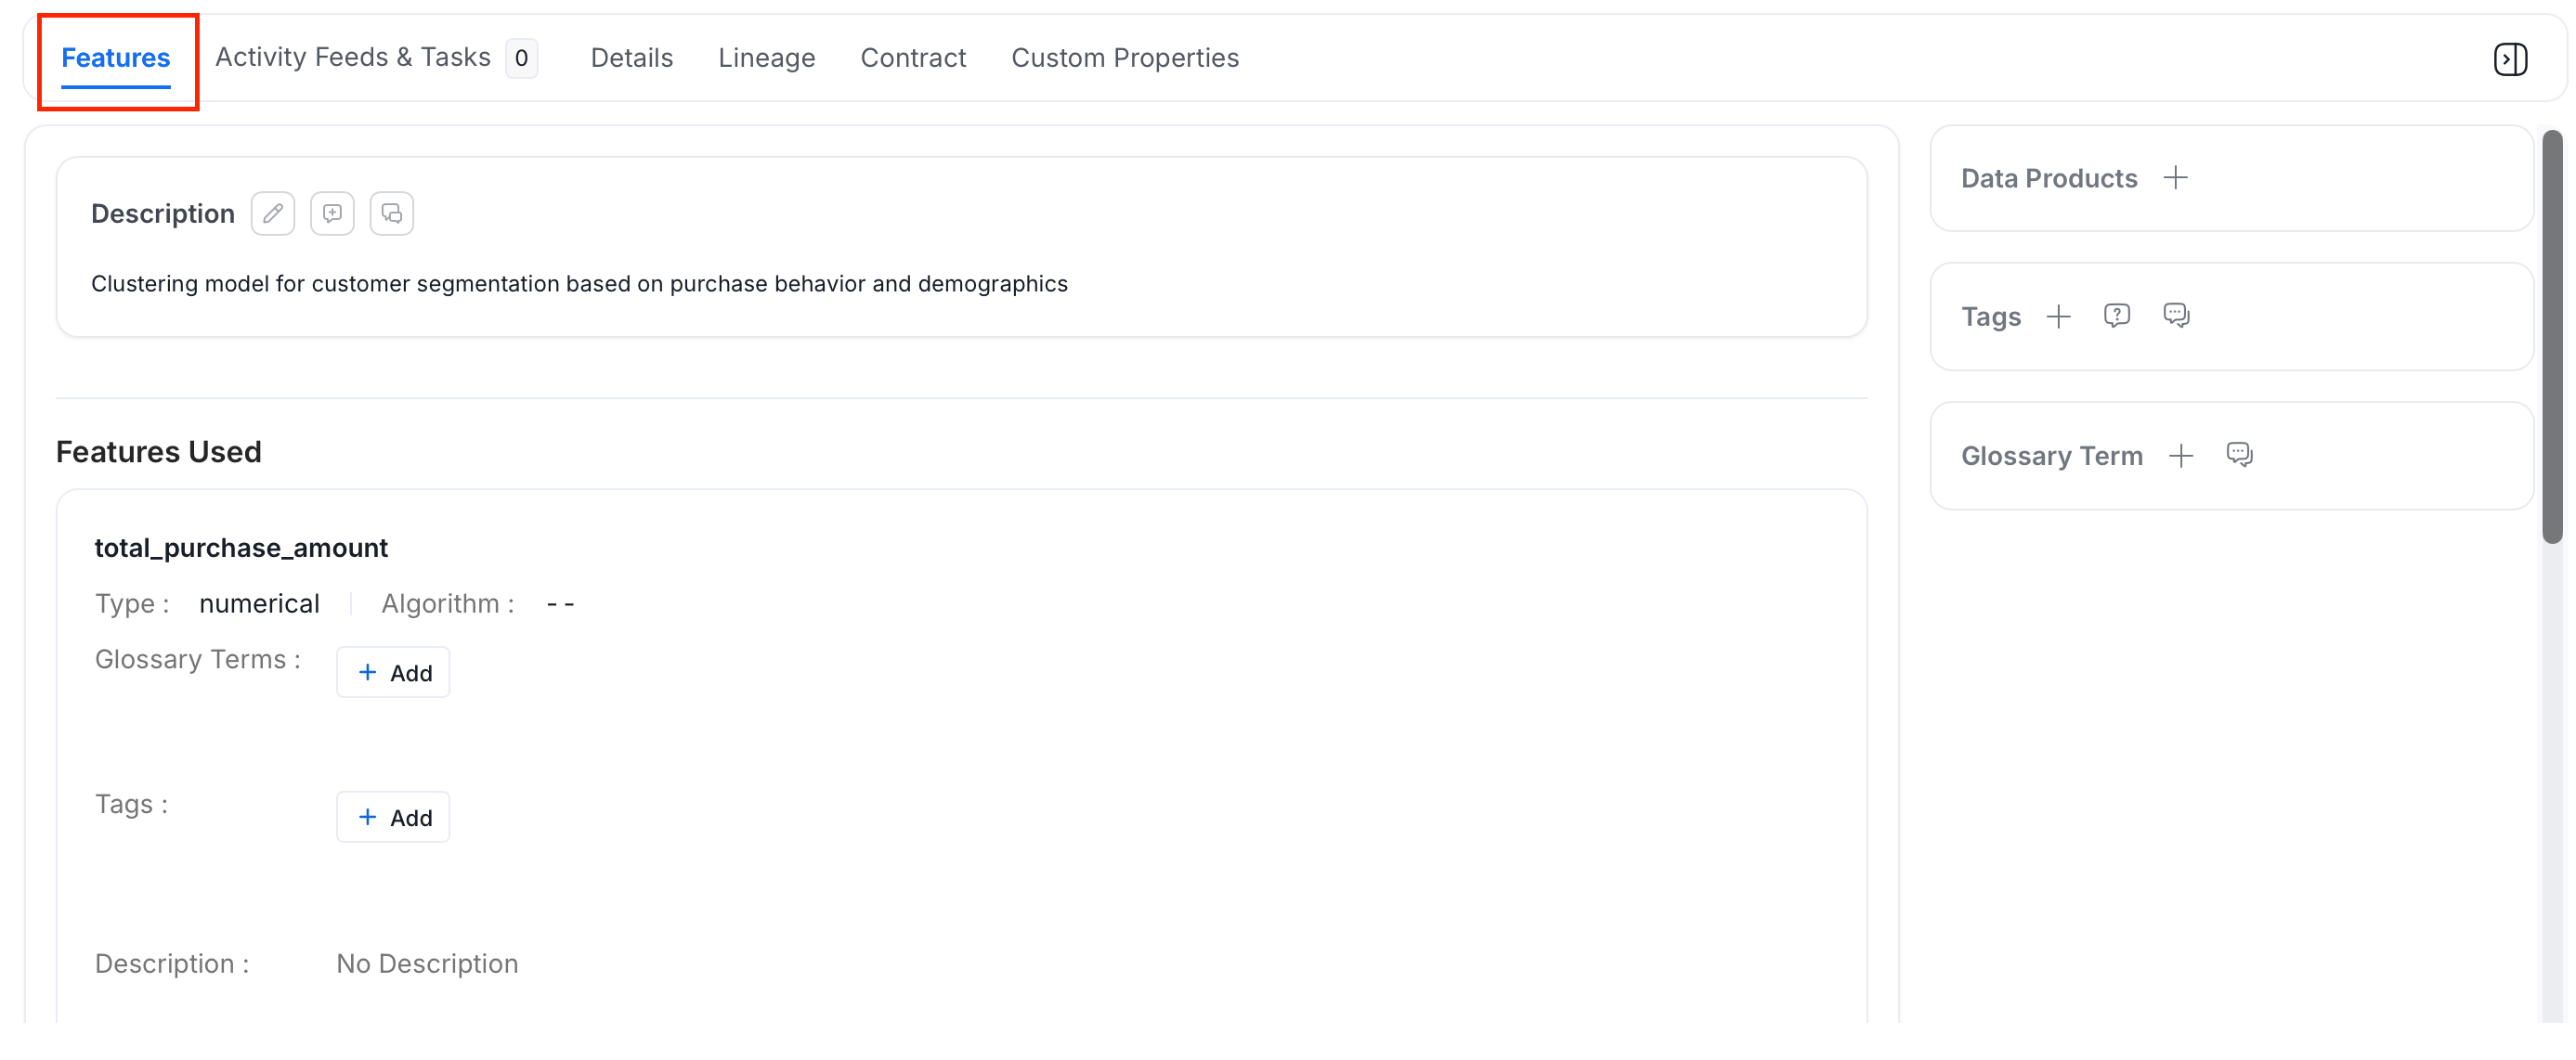
Available for **ML Models only**. This tab describes the inputs used to train the model:
* Model description
* Each feature with its type, algorithm, and description
* Data sources for each feature
* Associated glossary terms and tags
## Features Tab
Available for **ML Models only**. This tab describes the inputs used to train the model:
* Model description
* Each feature with its type, algorithm, and description
* Data sources for each feature
* Associated glossary terms and tags
 ## Children Tab
Available for **Containers only**. Lists all nested assets within the container — for example, files or sub-folders inside a storage bucket.
## Version History and Other Details
The toolbar in the top-right of any data asset page provides quick access to:
* **Tasks** — circular icon showing the count of open tasks
* **Version History** — clock icon showing a log of major and minor metadata changes
* **Follow** — star icon showing follower count; click to follow the asset and receive updates
* **Share** — copy and share a direct link to this asset
* **Announcements** — via the **⋮** menu; create or view time-bound announcements for the asset
* **Rename** — via the **⋮** menu; rename the asset
* **Delete** — via the **⋮** menu; permanently remove the asset
## Children Tab
Available for **Containers only**. Lists all nested assets within the container — for example, files or sub-folders inside a storage bucket.
## Version History and Other Details
The toolbar in the top-right of any data asset page provides quick access to:
* **Tasks** — circular icon showing the count of open tasks
* **Version History** — clock icon showing a log of major and minor metadata changes
* **Follow** — star icon showing follower count; click to follow the asset and receive updates
* **Share** — copy and share a direct link to this asset
* **Announcements** — via the **⋮** menu; create or view time-bound announcements for the asset
* **Rename** — via the **⋮** menu; rename the asset
* **Delete** — via the **⋮** menu; permanently remove the asset
 Describe your data assets using Markdown