> ## Documentation Index
> Fetch the complete documentation index at: https://docs.getcollate.io/llms.txt
> Use this file to discover all available pages before exploring further.
# How to Visualize Test Results
> View data quality test results by entity, test suite, or individual test case from the Data Quality page or directly on a table.
# How to Visualize Test Results
Collate gives you two main entry points for reviewing test results: the **Data Quality** page and the table page.
## From the Data Quality Page
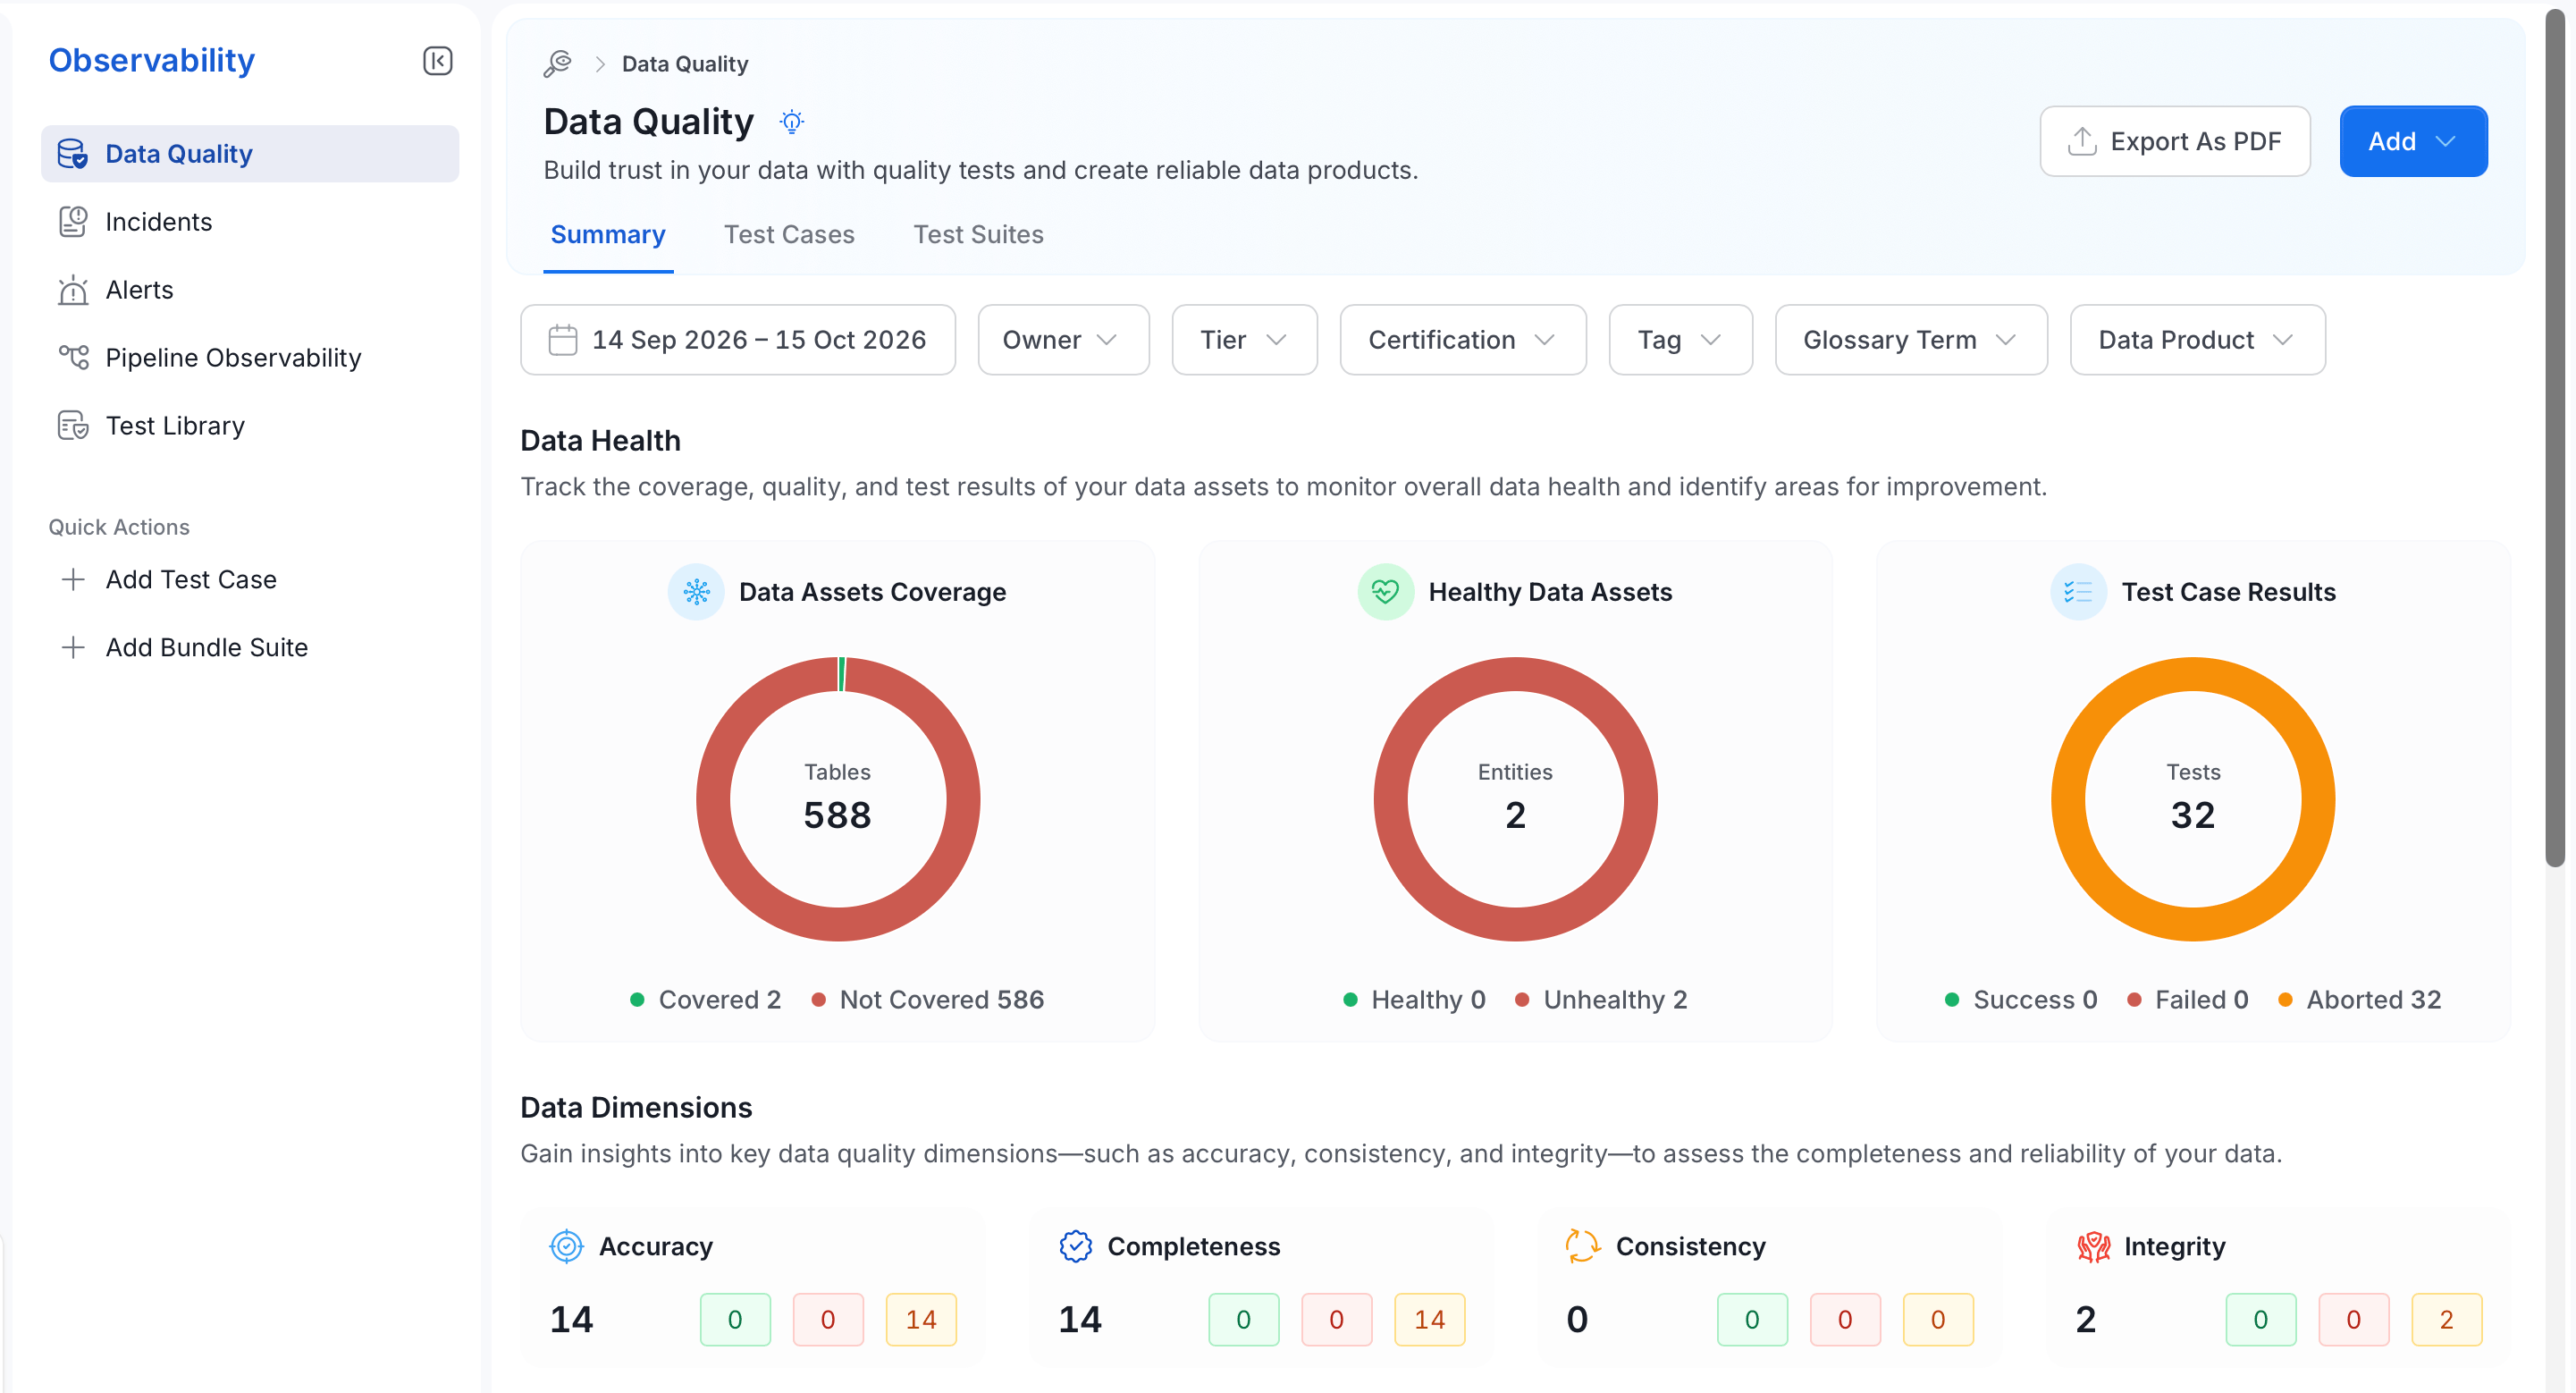
Select the **Profile** icon and navigate to **Observability** > **Data Quality**. The page has three tabs:
* **Summary**: Data health, data dimensions, and overall test results.
* **Test Cases**: Every test case, with filters.
* **Test Suites**: Test results grouped by test suite.
 ### View Results by Test Suite
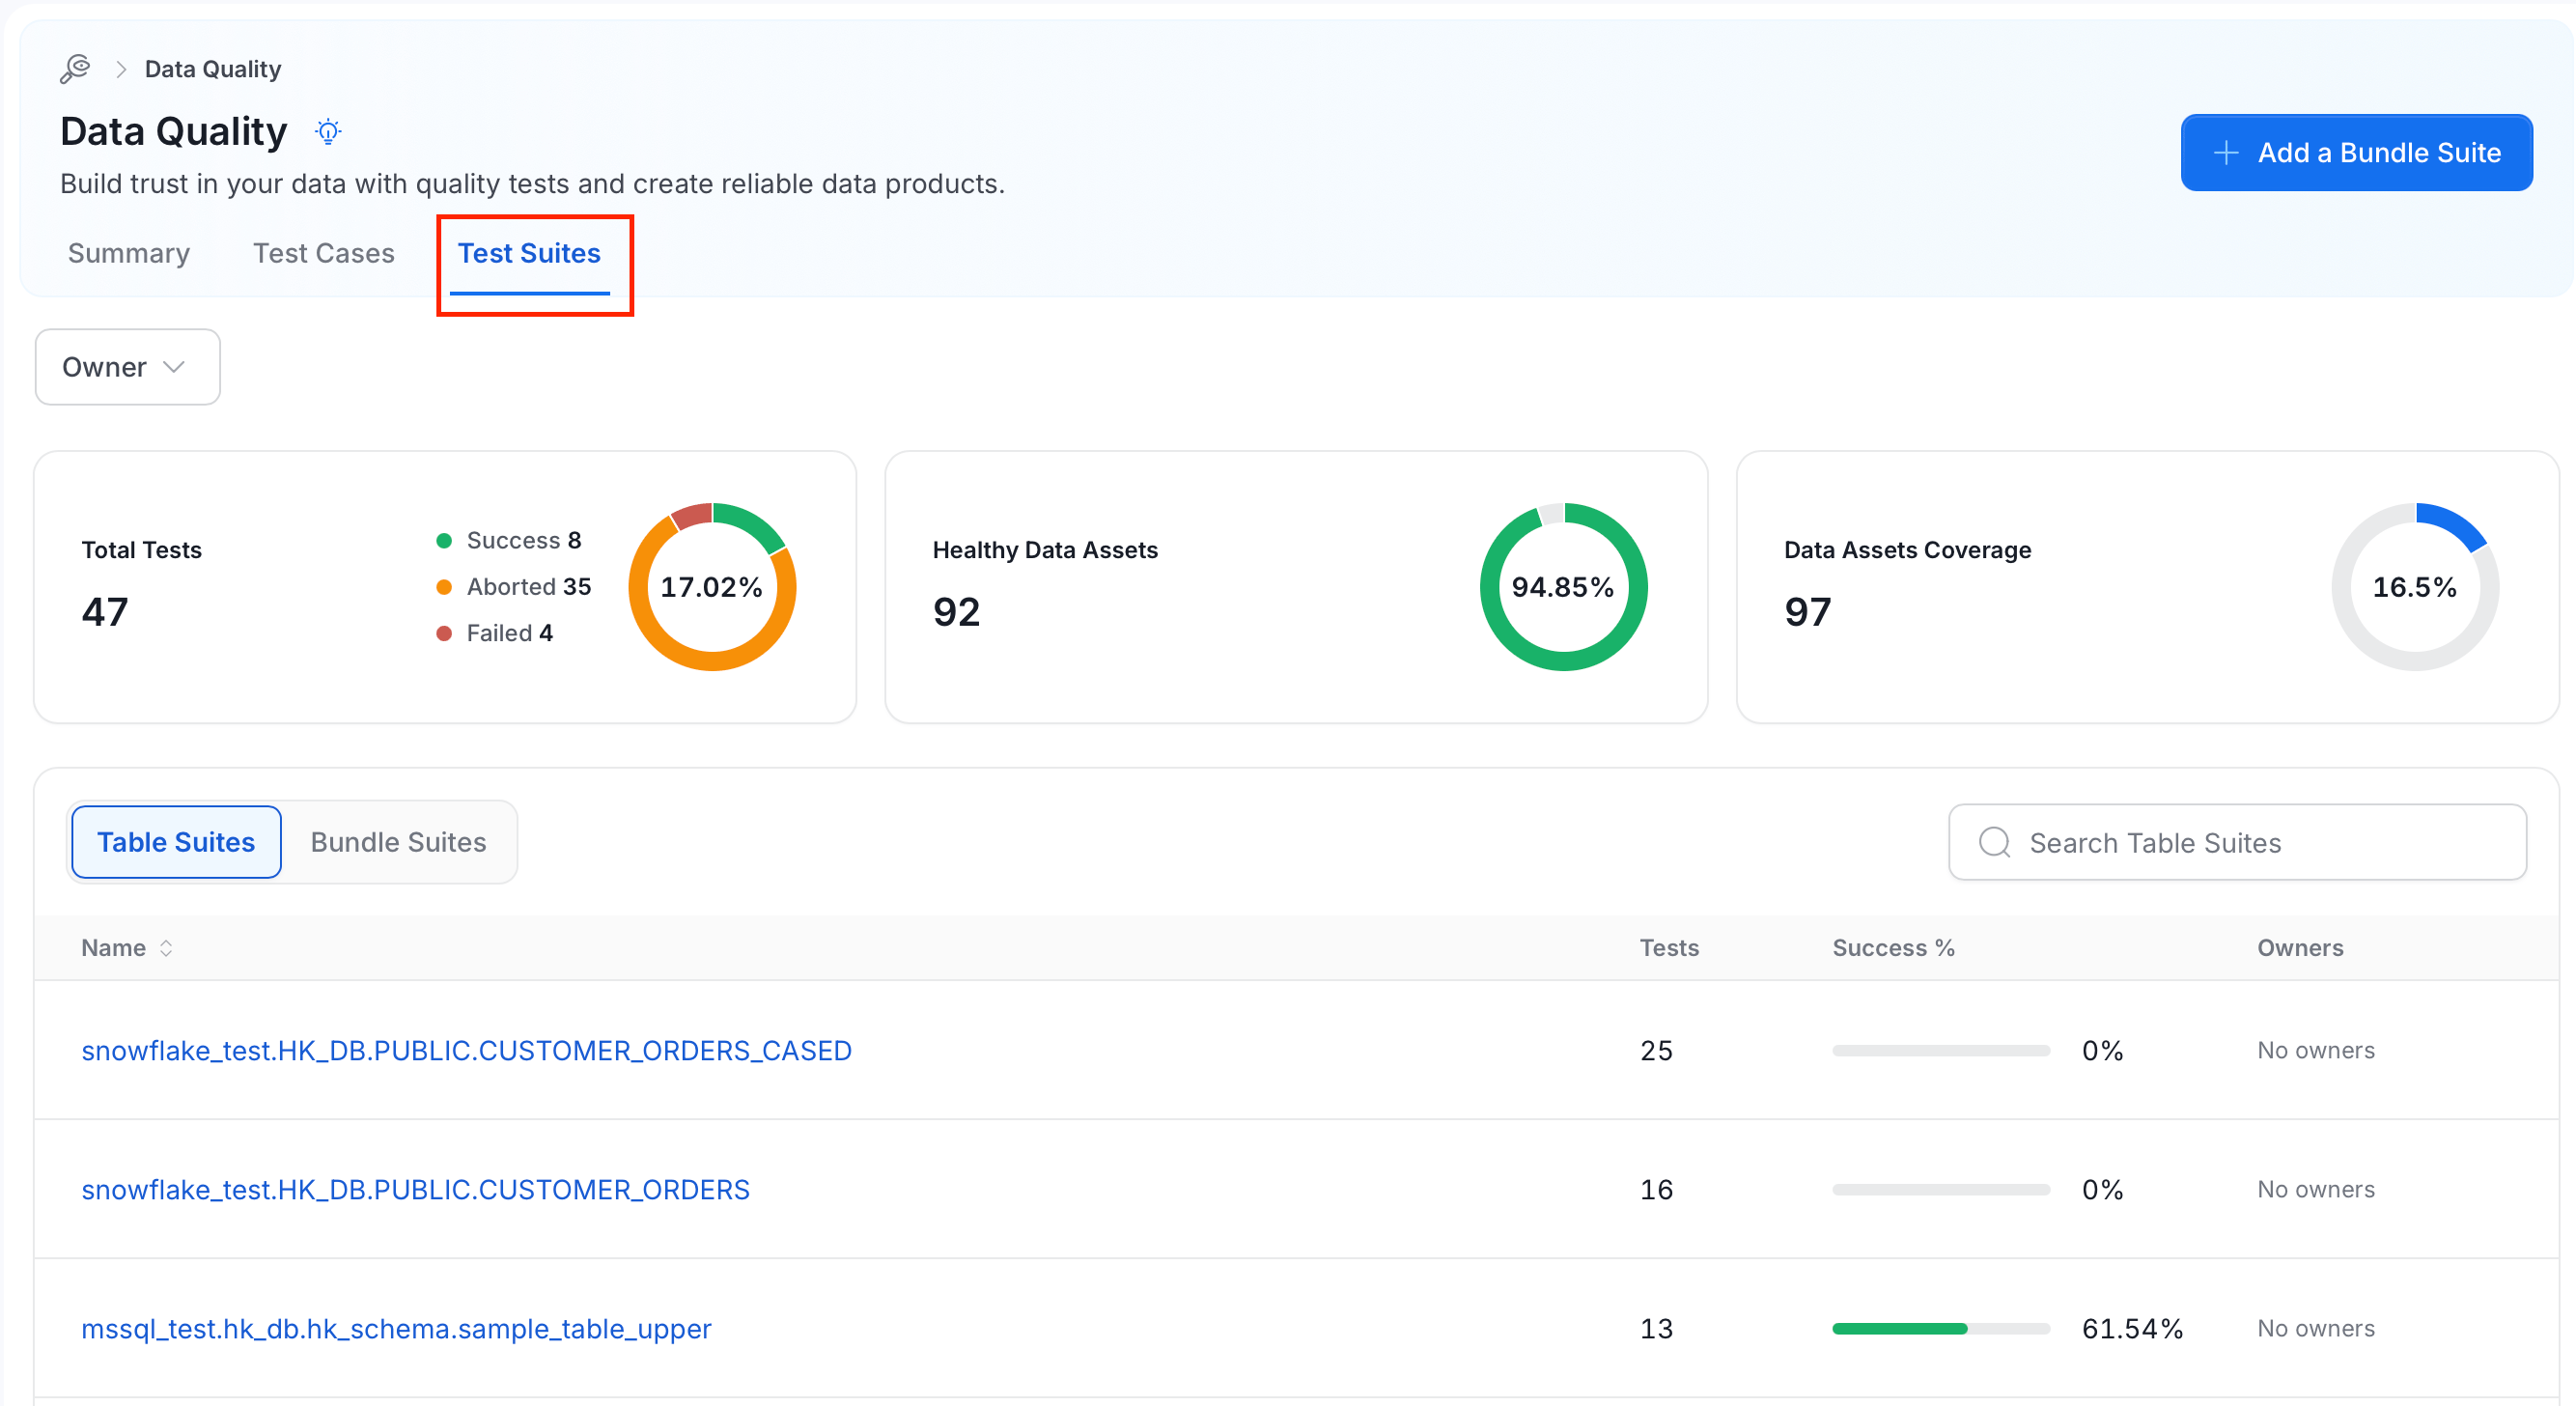
To look at your tests grouped by test suite, select the **Test Suites** tab. Use **Table Suites** and **Bundle Suites** to switch between the two kinds of suites. Each row shows the suite **Name**, the number of **Tests**, the **Success %**, and the **Owners**. To find a suite, enter its name in **Search Table Suites**.
### View Results by Test Suite
To look at your tests grouped by test suite, select the **Test Suites** tab. Use **Table Suites** and **Bundle Suites** to switch between the two kinds of suites. Each row shows the suite **Name**, the number of **Tests**, the **Success %**, and the **Owners**. To find a suite, enter its name in **Search Table Suites**.
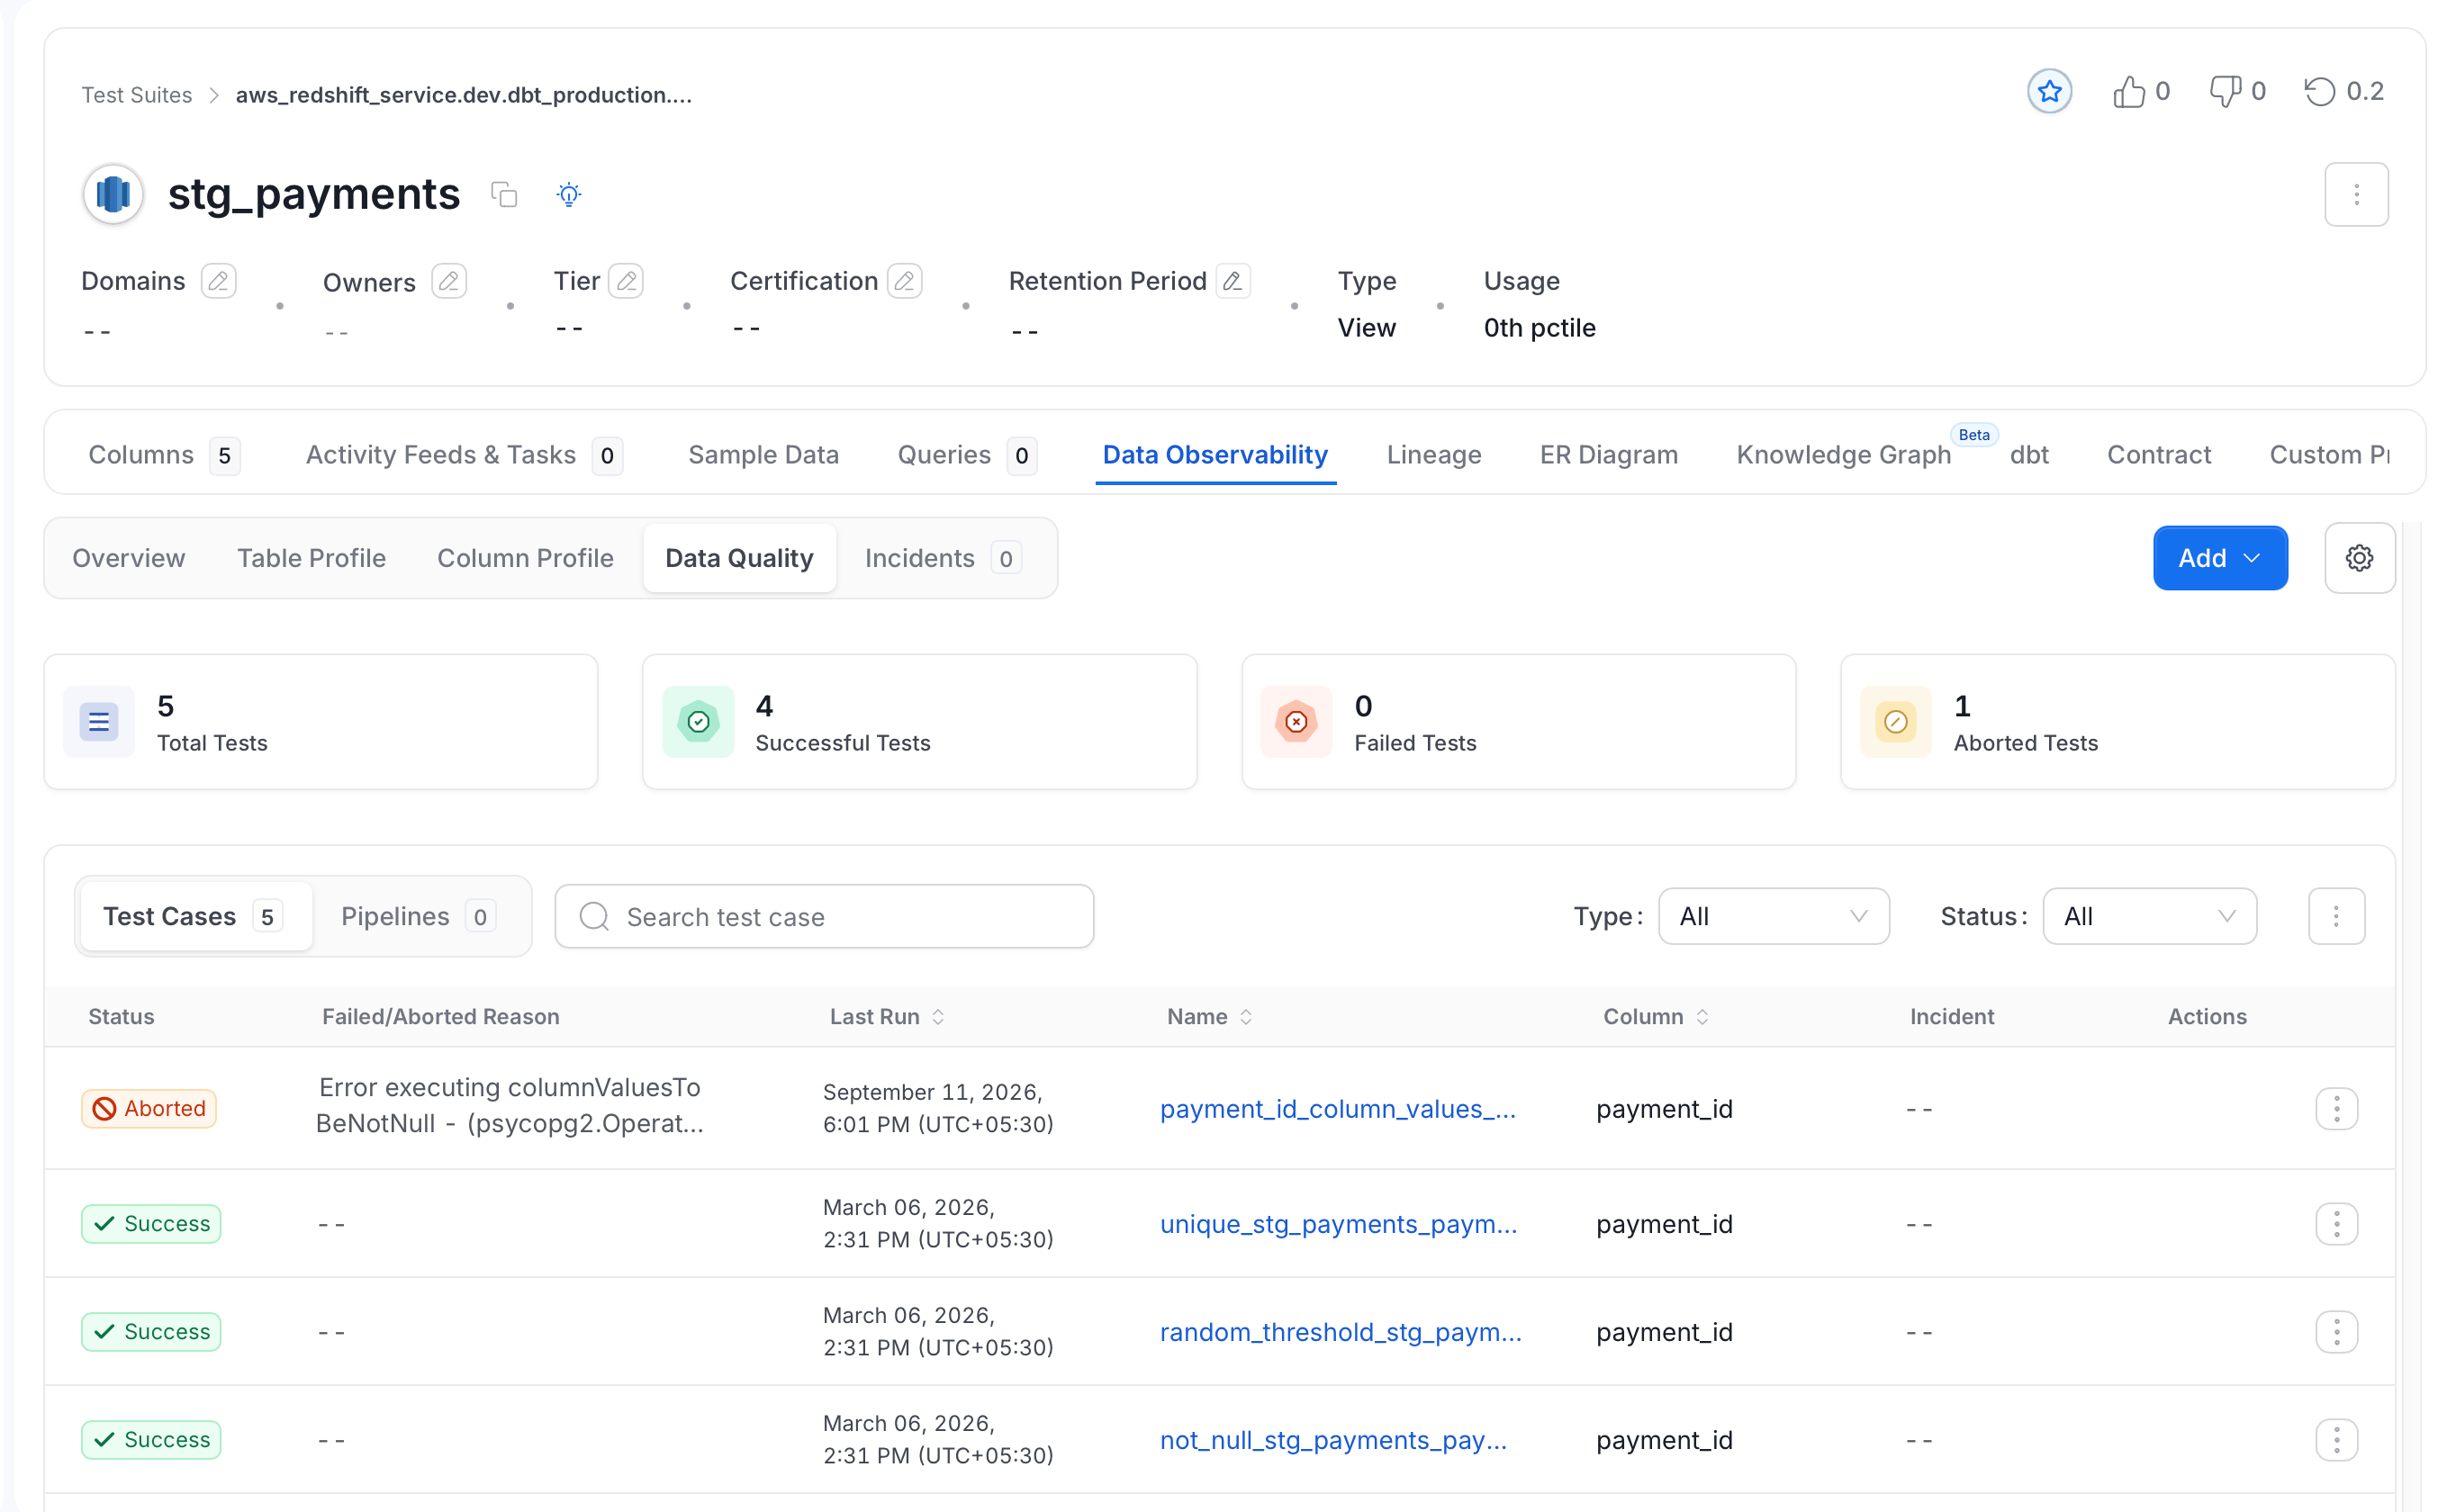
 Select a test suite to visualize the results associated with it. The suite page opens on the **Data Observability** tab, with the **Data Quality** sub-tab selected. It shows the number of total, successful, failed, and aborted tests, and the **Test Cases** list of the suite.
 ### Filter Test Cases by Status
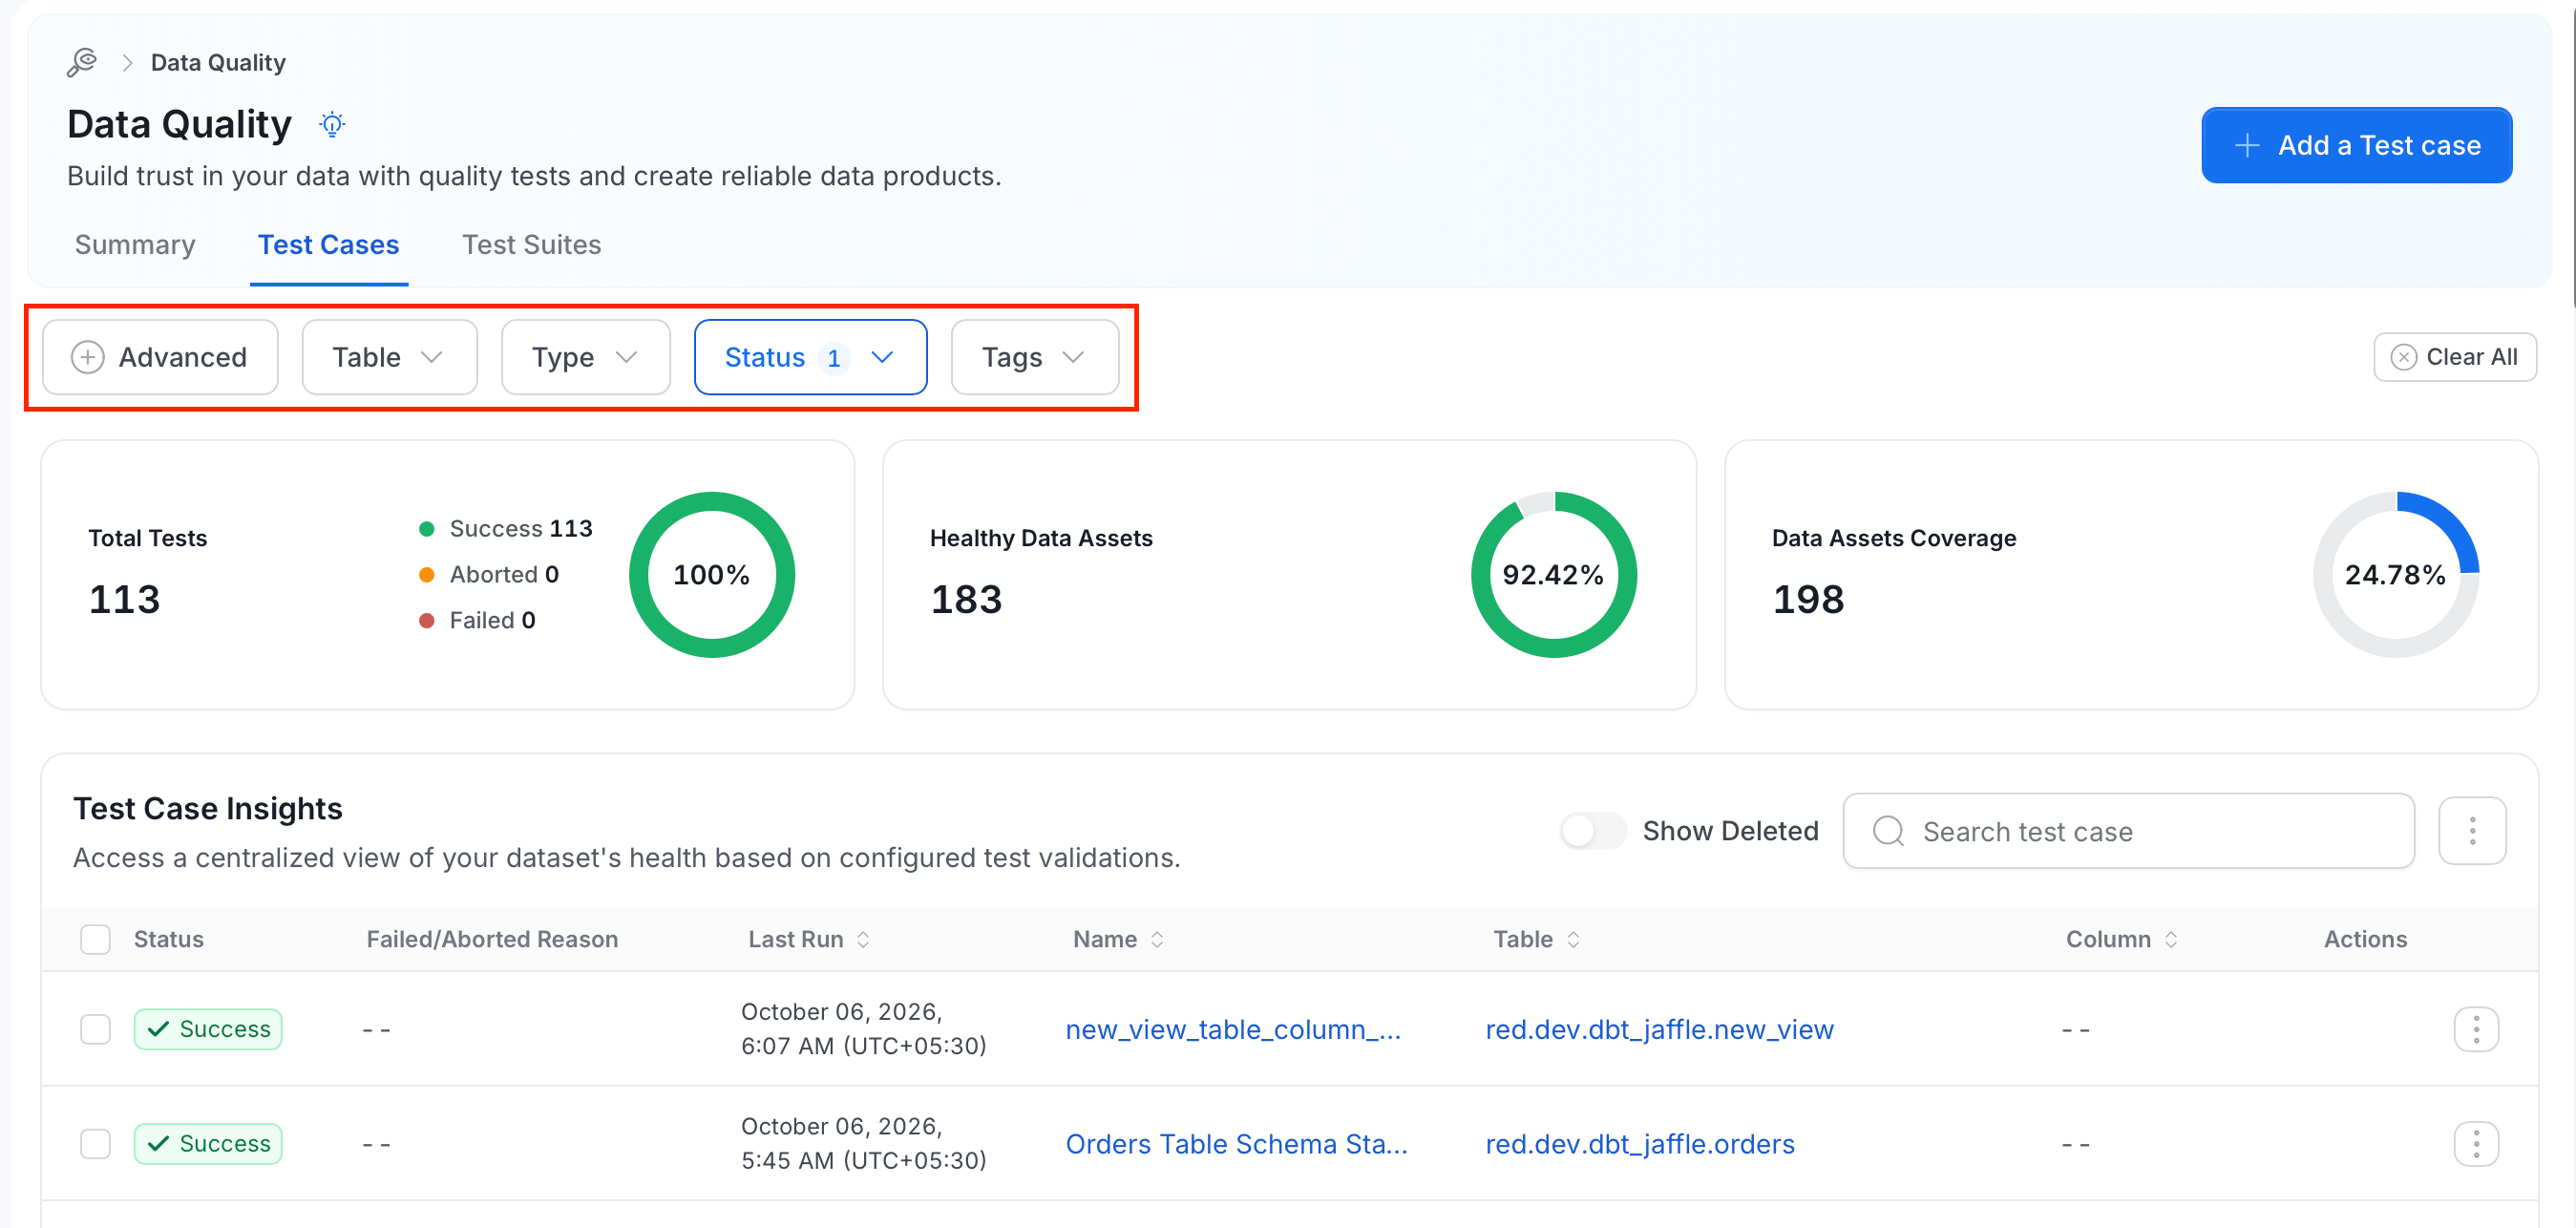
On the **Test Cases** tab, the filter bar has **Advanced**, **Table**, **Type**, **Status**, and **Tags** filters. Select **Clear all** to reset them.
### Filter Test Cases by Status
On the **Test Cases** tab, the filter bar has **Advanced**, **Table**, **Type**, **Status**, and **Tags** filters. Select **Clear all** to reset them.
 The **Status** filter accepts several values at once. To filter by more than one status:
1. Select **Status**.
2. Select one or more of **Aborted**, **Failed**, **Queued**, and **Success**.
3. Select **Apply**. The button shows how many statuses you selected, for example **Apply (2)**.
The **Status** filter accepts several values at once. To filter by more than one status:
1. Select **Status**.
2. Select one or more of **Aborted**, **Failed**, **Queued**, and **Success**.
3. Select **Apply**. The button shows how many statuses you selected, for example **Apply (2)**.
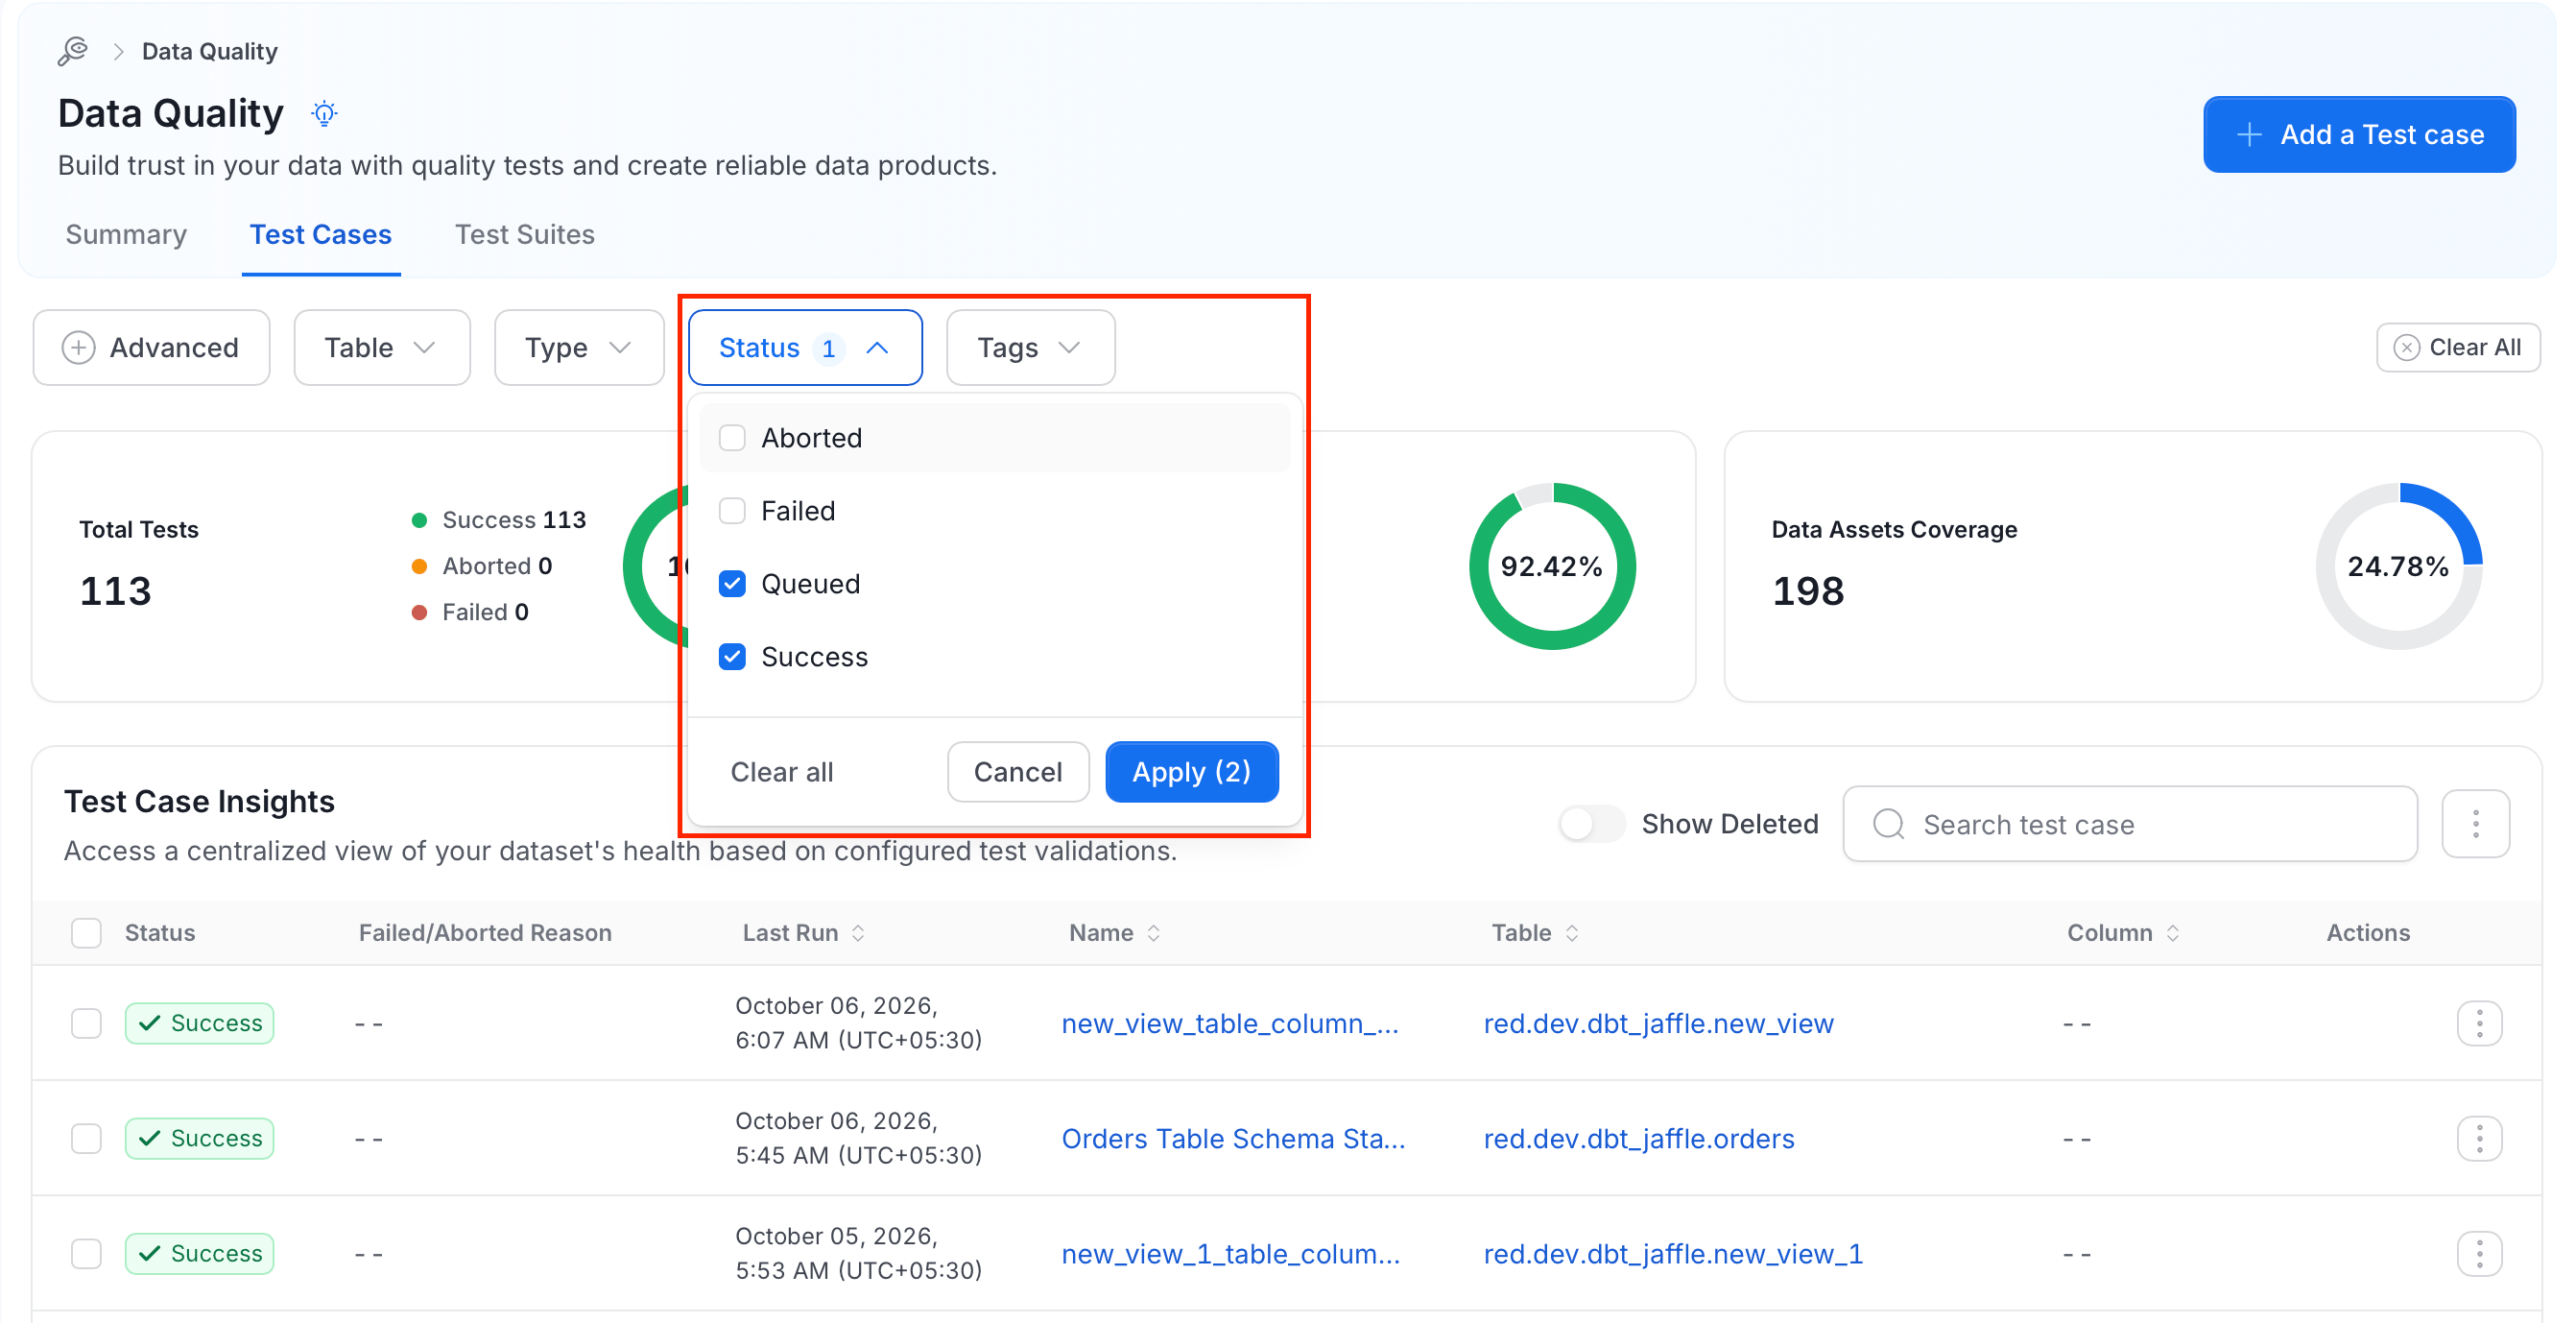 A test case matches if it has any of the selected statuses. A number next to **Status** shows how many statuses are applied. Select **Clear all** in the dropdown to remove the selection, or **Cancel** to close it without changes.
To filter by several statuses through the API, see [Filter by Multiple Statuses](/ai-2-0/developer-guide/api-reference/data-quality/test-cases/list#filter-by-multiple-statuses).
### Open Test Cases From the Summary Tab
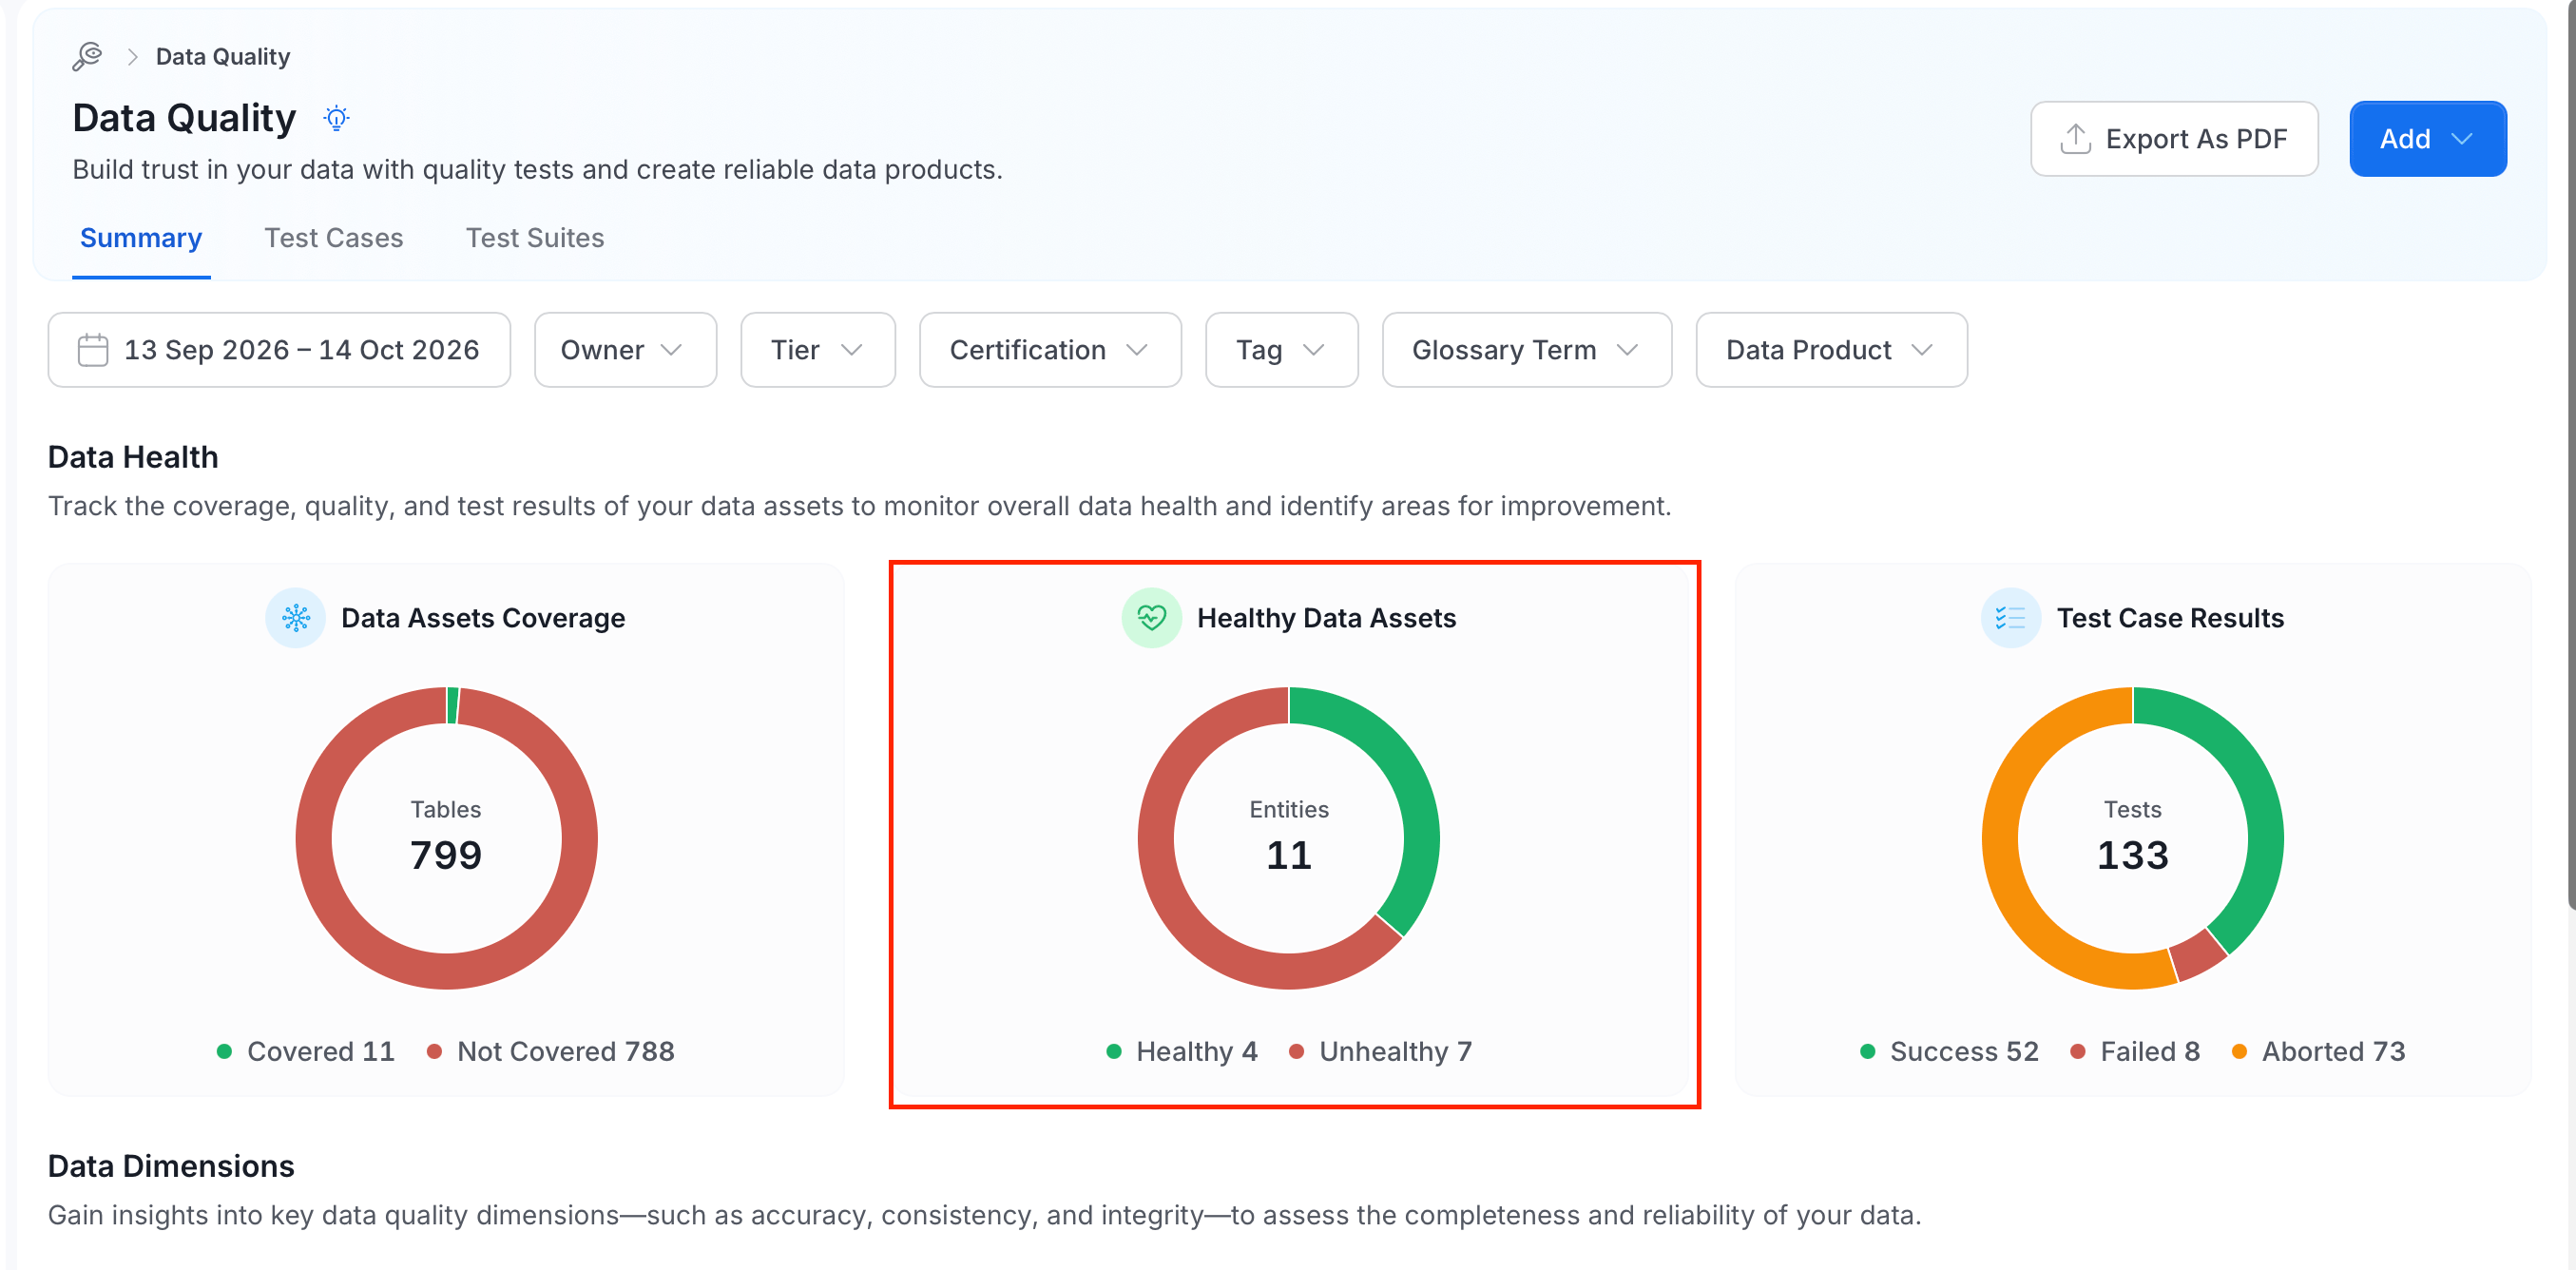
In **Data Health** on the **Summary** tab, the **Healthy Data Assets** card has a **Healthy** segment and an **Unhealthy** segment. Select a segment to open the **Test Cases** tab with the matching statuses already applied:
* **Healthy**: `Success` and `Queued`.
* **Unhealthy**: `Failed` and `Aborted`.
A test case matches if it has any of the selected statuses. A number next to **Status** shows how many statuses are applied. Select **Clear all** in the dropdown to remove the selection, or **Cancel** to close it without changes.
To filter by several statuses through the API, see [Filter by Multiple Statuses](/ai-2-0/developer-guide/api-reference/data-quality/test-cases/list#filter-by-multiple-statuses).
### Open Test Cases From the Summary Tab
In **Data Health** on the **Summary** tab, the **Healthy Data Assets** card has a **Healthy** segment and an **Unhealthy** segment. Select a segment to open the **Test Cases** tab with the matching statuses already applied:
* **Healthy**: `Success` and `Queued`.
* **Unhealthy**: `Failed` and `Aborted`.
 ## From a Table Page
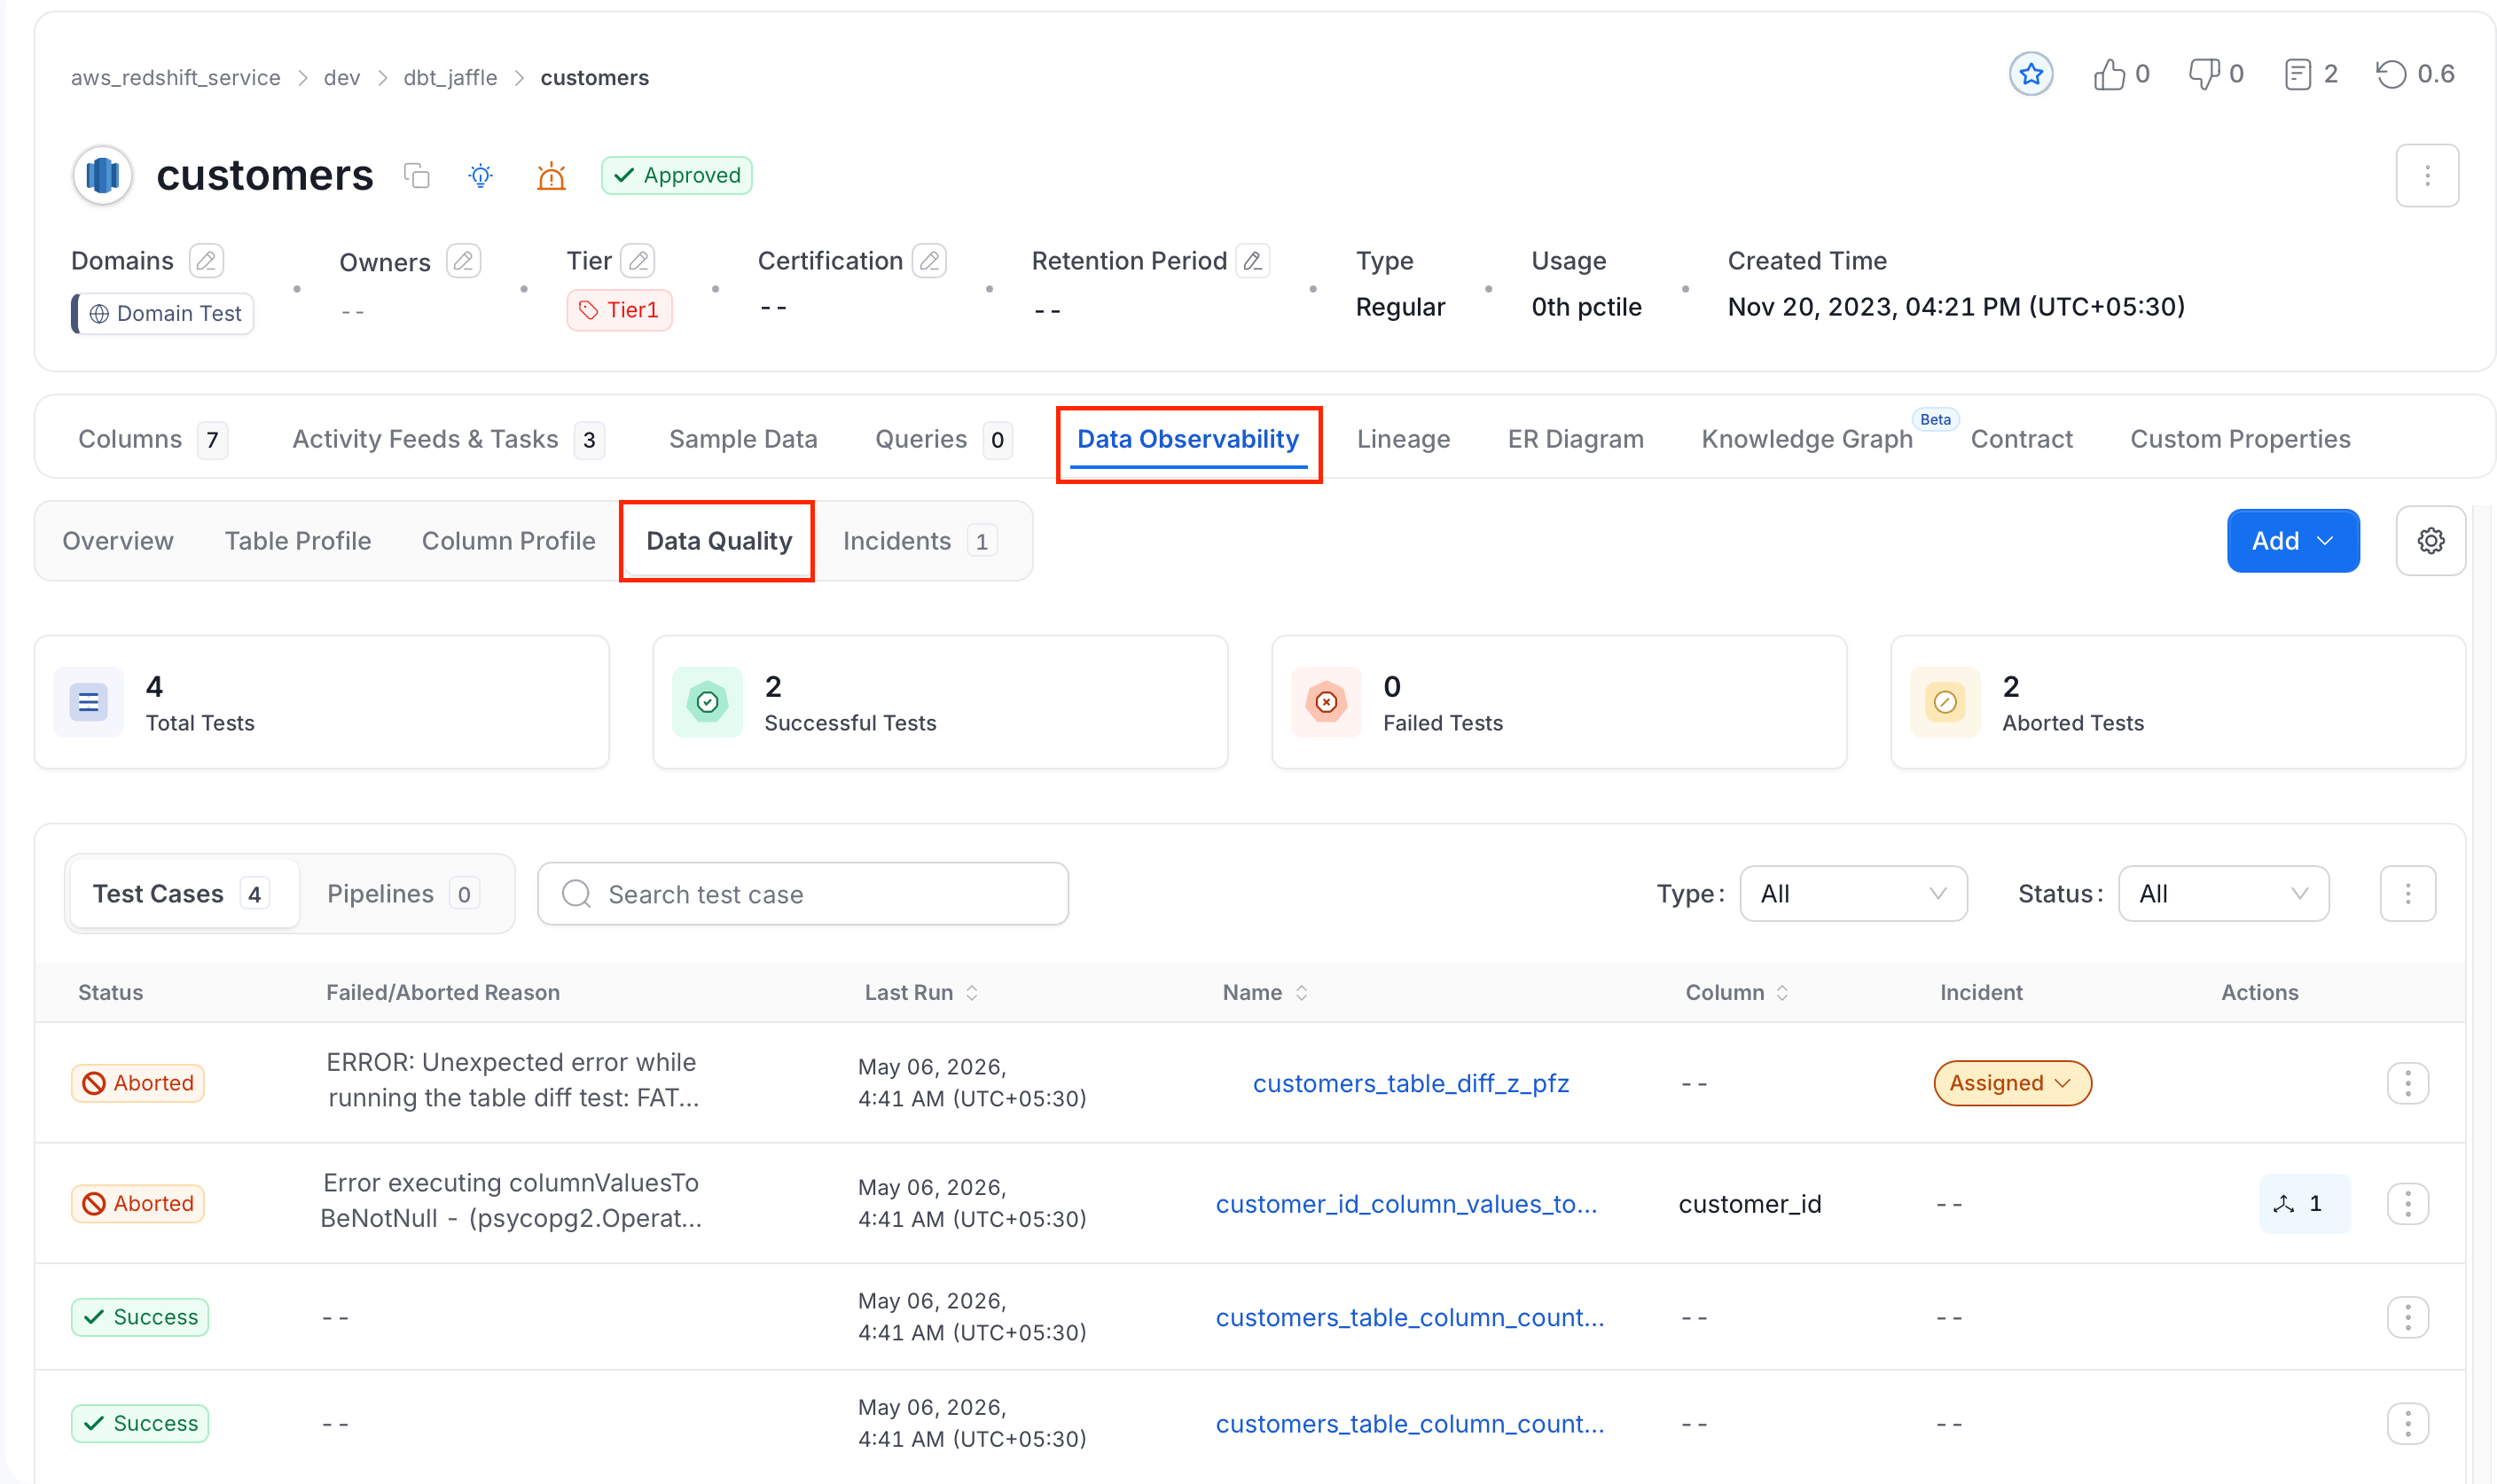
Open the table page and select the **Data Observability** tab. The sub-tabs are **Overview**, **Table Profile**, **Column Profile**, **Data Quality**, and **Incidents**. Select **Data Quality** to see the test results at the table level and the column level.
The page shows the number of total, successful, failed, and aborted tests. Below the numbers, the **Test Cases** list shows the **Status**, the **Failed/Aborted Reason**, the **Last Run** time, the **Name**, the **Column**, and the **Incident** of each test case. Use the **Type** and **Status** filters, or **Search test case**, to narrow the list.
## From a Table Page
Open the table page and select the **Data Observability** tab. The sub-tabs are **Overview**, **Table Profile**, **Column Profile**, **Data Quality**, and **Incidents**. Select **Data Quality** to see the test results at the table level and the column level.
The page shows the number of total, successful, failed, and aborted tests. Below the numbers, the **Test Cases** list shows the **Status**, the **Failed/Aborted Reason**, the **Last Run** time, the **Name**, the **Column**, and the **Incident** of each test case. Use the **Type** and **Status** filters, or **Search test case**, to narrow the list.
 ## Review Result History and Run Details
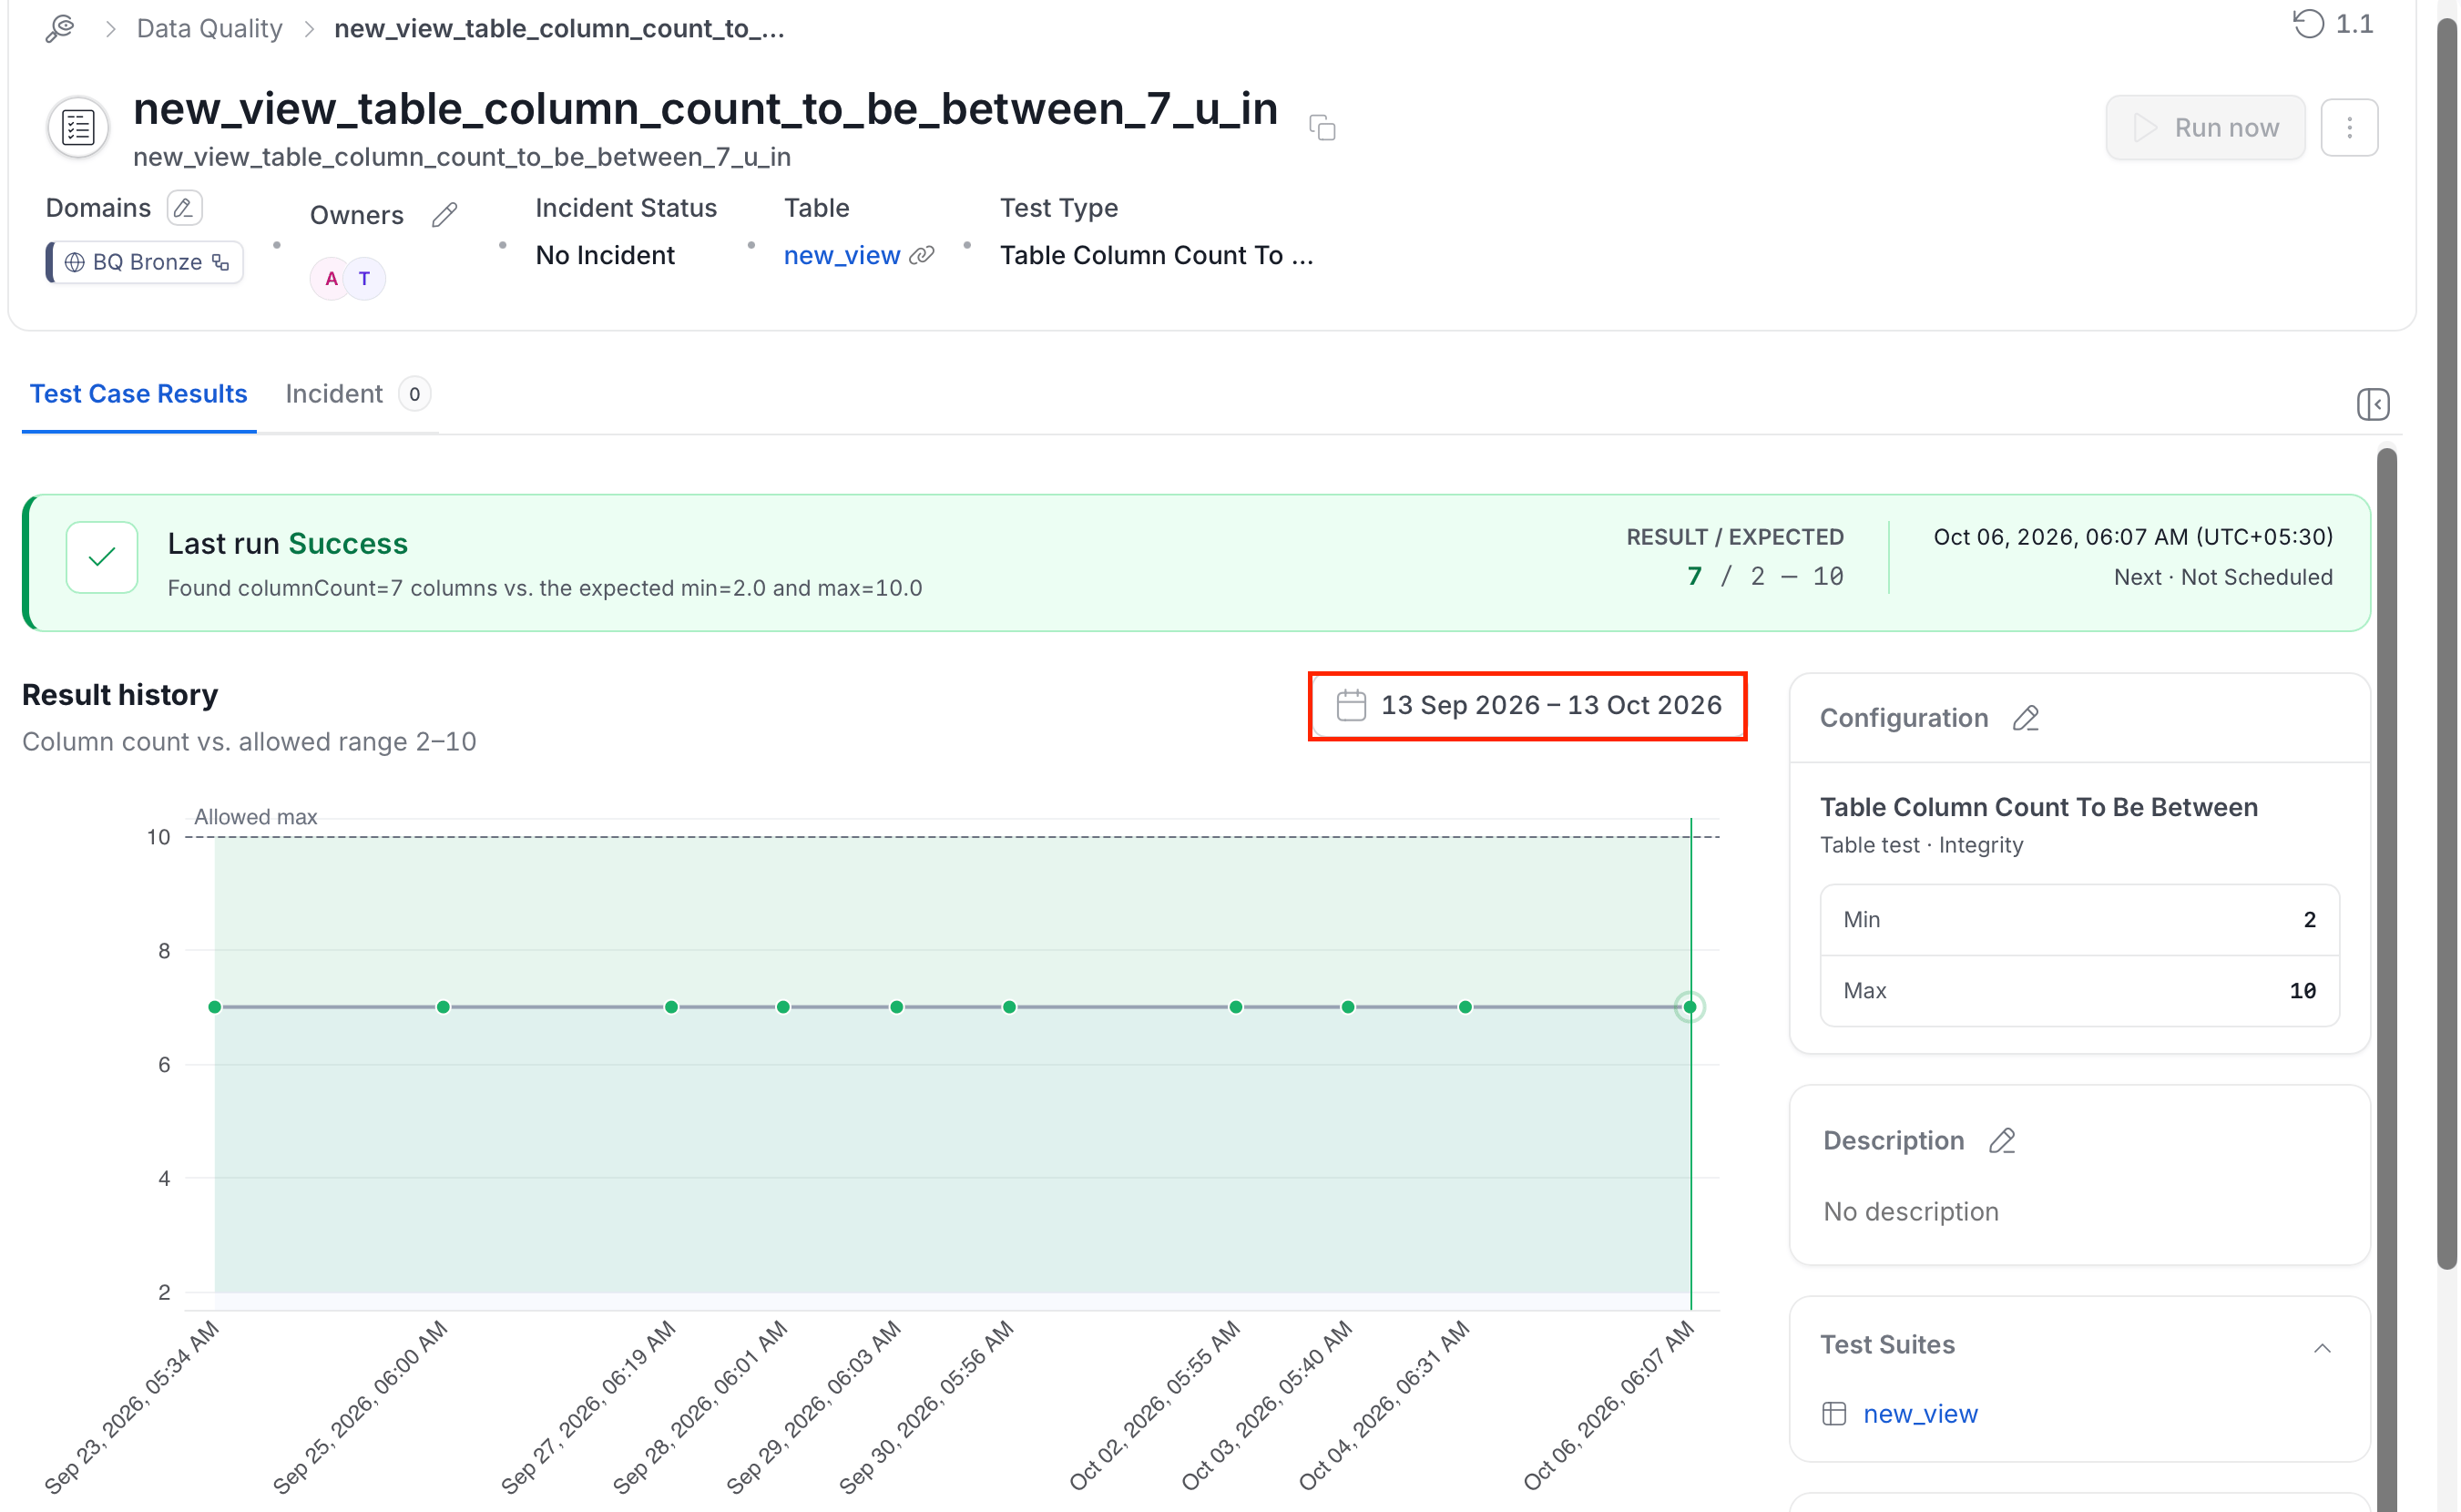
Open a test case from **Data Quality** > **Test Cases**, or from the **Data Quality** sub-tab of a table, to see how the test has performed over time. The **Test Case Results** tab shows:
* **Last run**: The latest status and a message with the measured value and the expected range. It also shows the **Result / Expected** values, the run time, and when the next run is due, or **Not Scheduled**.
* **Result history**: A chart of the measured value over time. The caption names what Collate measures and what it compares against, for example "Column count vs. allowed range 2–10". A dashed line marks the allowed limit. A key under the chart names each marker, and aborted runs appear as hollow markers.
* **Configuration**, **Description**, **Test Suites**, **Tags**, **Glossary Term**, and **Data Products** panels beside the chart.
## Review Result History and Run Details
Open a test case from **Data Quality** > **Test Cases**, or from the **Data Quality** sub-tab of a table, to see how the test has performed over time. The **Test Case Results** tab shows:
* **Last run**: The latest status and a message with the measured value and the expected range. It also shows the **Result / Expected** values, the run time, and when the next run is due, or **Not Scheduled**.
* **Result history**: A chart of the measured value over time. The caption names what Collate measures and what it compares against, for example "Column count vs. allowed range 2–10". A dashed line marks the allowed limit. A key under the chart names each marker, and aborted runs appear as hollow markers.
* **Configuration**, **Description**, **Test Suites**, **Tags**, **Glossary Term**, and **Data Products** panels beside the chart.
 ### Change the Result History Time Window
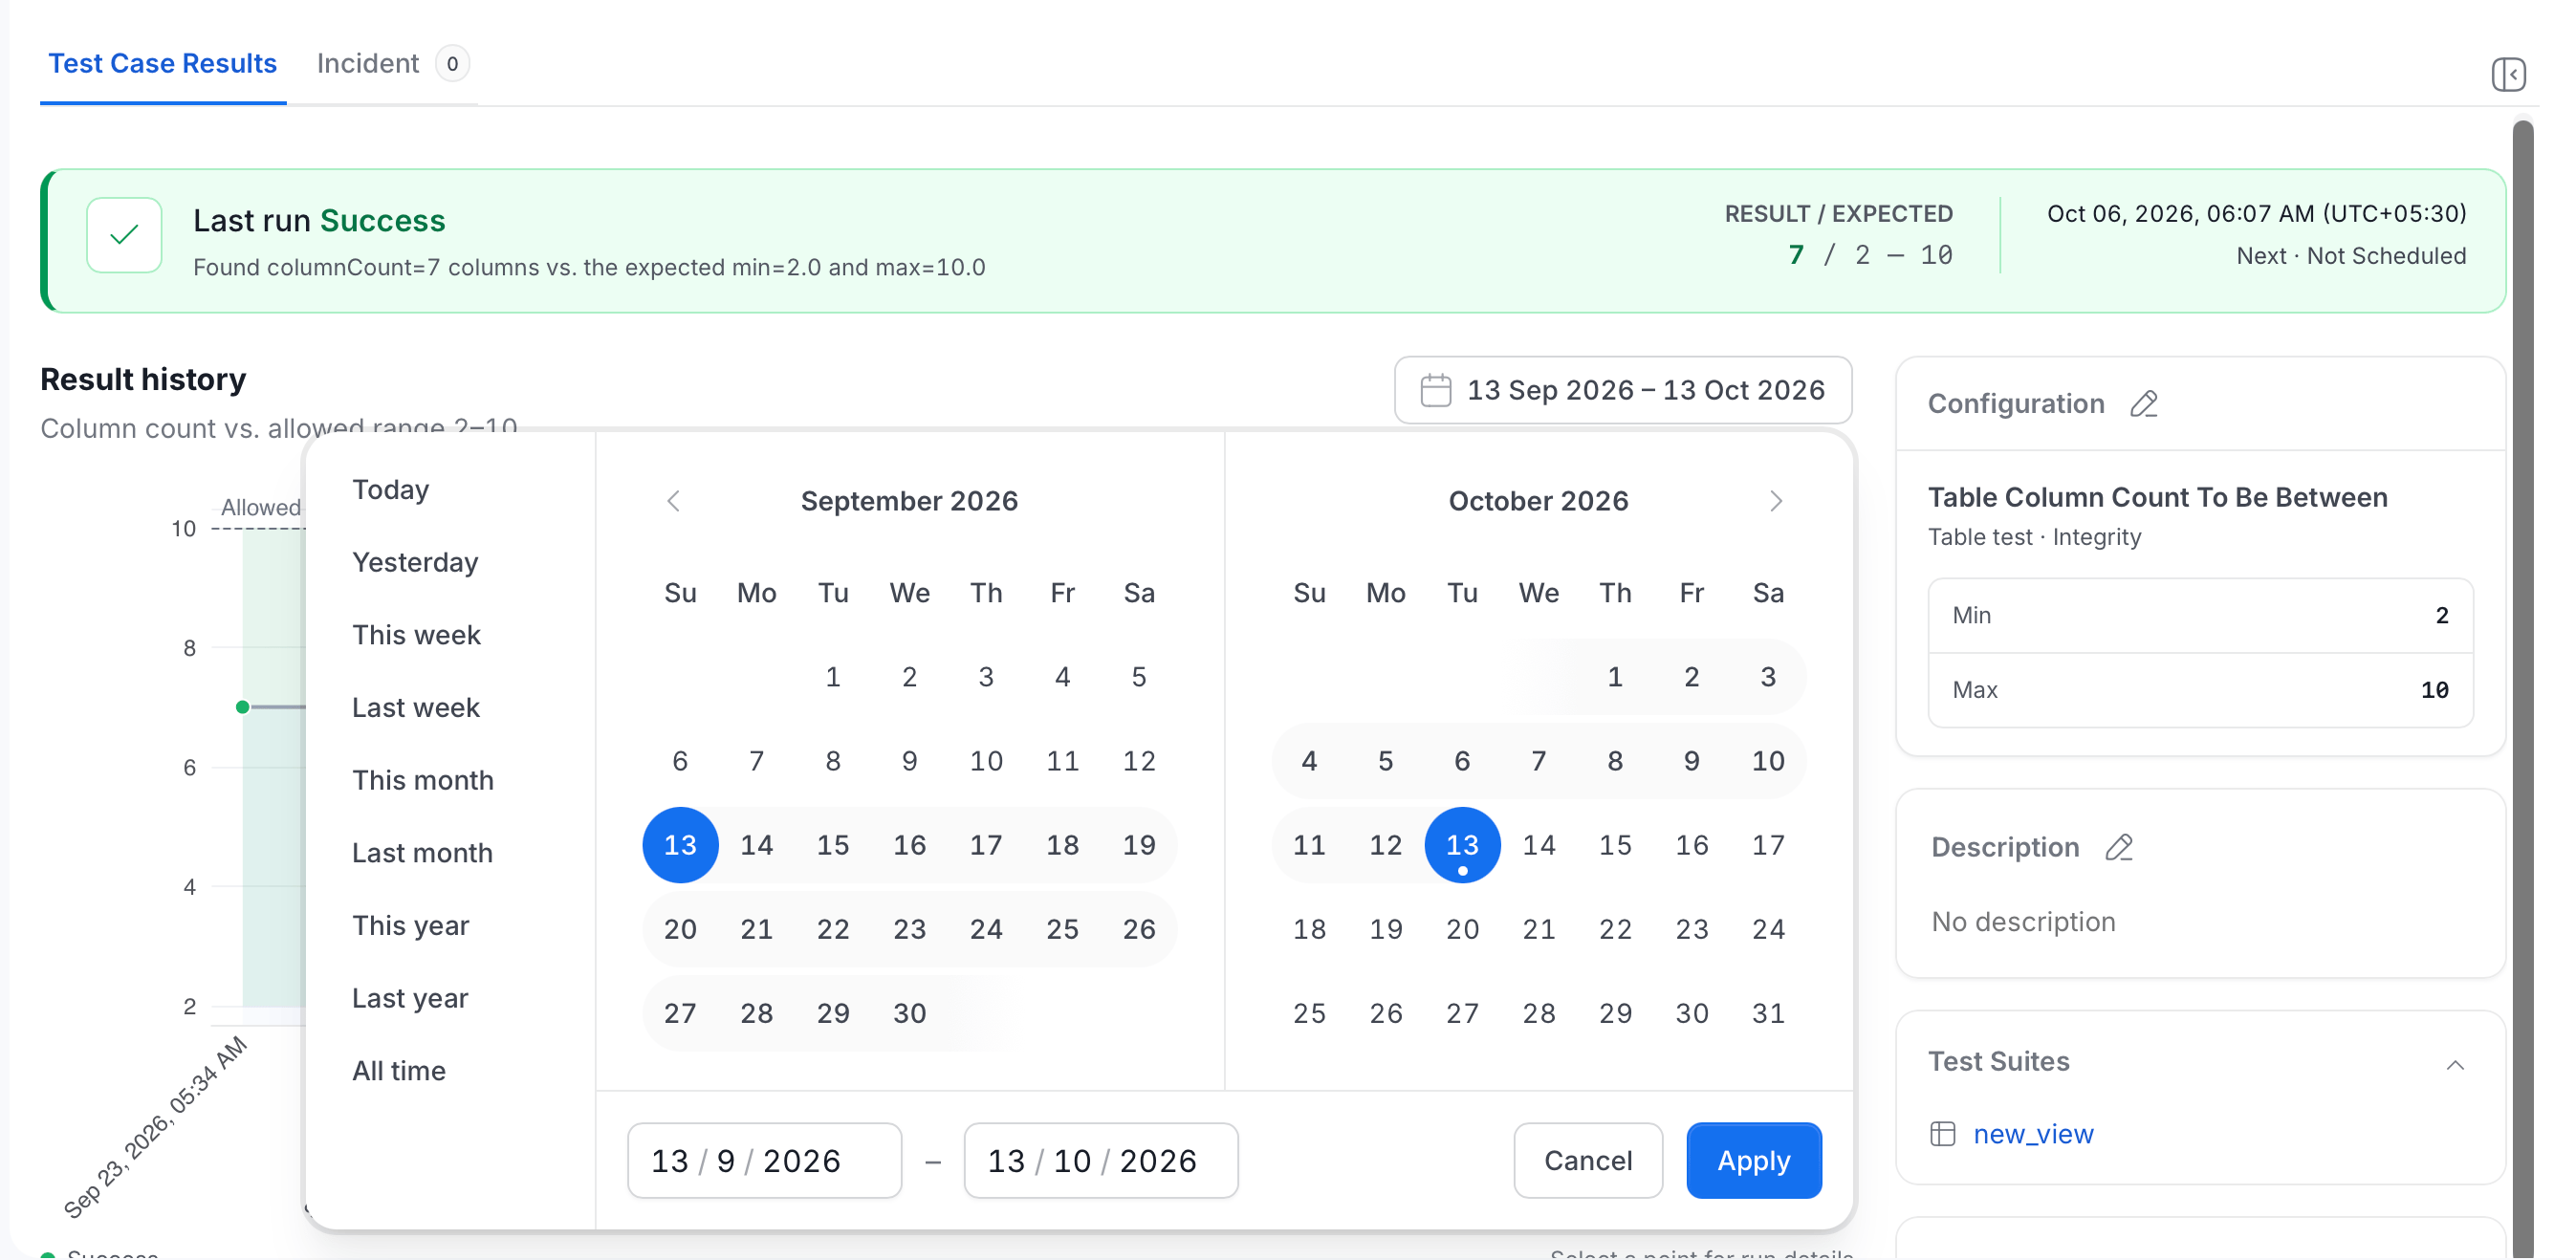
By default, **Result history** covers the last 30 days and ends today. To change the time window:
1. Select the date range on the **Result history** card.
2. Choose a time range in one of two ways:
* Select a preset: **Today**, **Yesterday**, **This week**, **Last week**, **This month**, **Last month**, **This year**, **Last year**, or **All time**.
* Pick start and end dates on the calendars, or type them in the date fields.
3. Select **Apply**.
### Change the Result History Time Window
By default, **Result history** covers the last 30 days and ends today. To change the time window:
1. Select the date range on the **Result history** card.
2. Choose a time range in one of two ways:
* Select a preset: **Today**, **Yesterday**, **This week**, **Last week**, **This month**, **Last month**, **This year**, **Last year**, or **All time**.
* Pick start and end dates on the calendars, or type them in the date fields.
3. Select **Apply**.
 ### Read the Run Summary Tiles
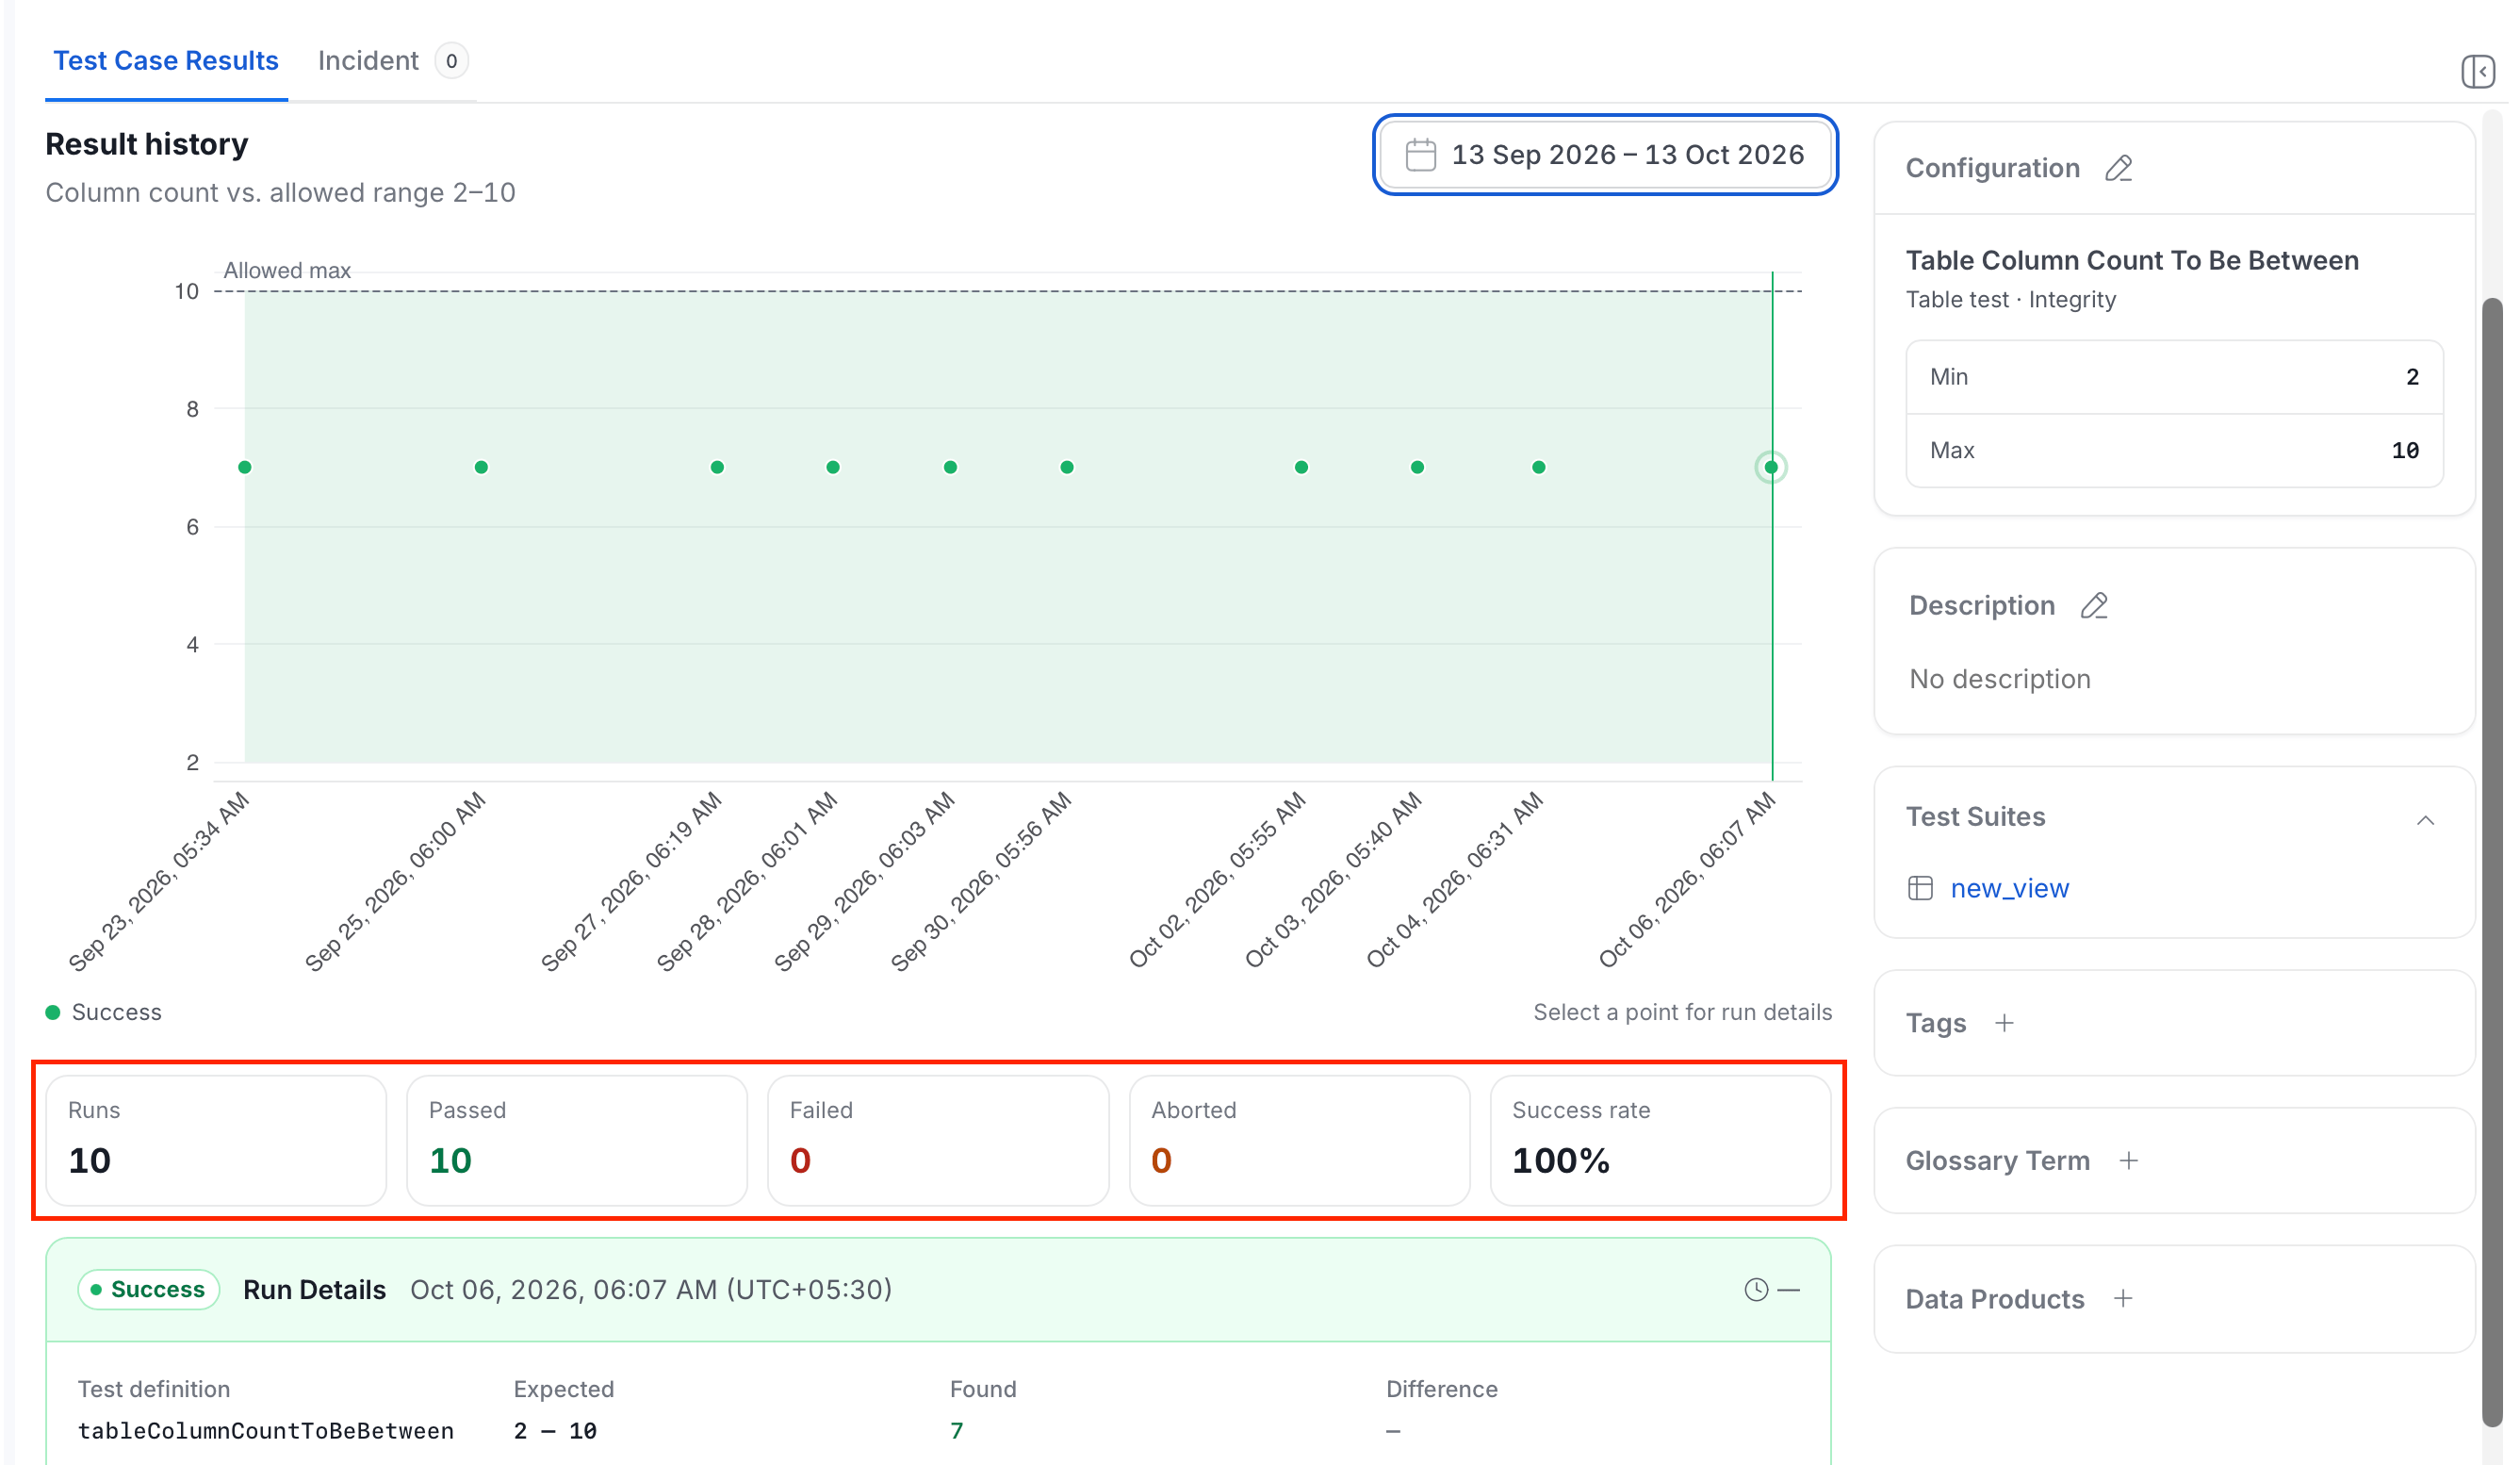
Below the chart, five tiles summarize the selected time window:
| Tile | Meaning |
| - | - |
| **Runs** | All runs, including queued runs. |
| **Passed** | Runs that succeeded. |
| **Failed** | Runs that failed. |
| **Aborted** | Runs that ended with an error before producing a result. |
| **Success rate** | Passed runs as a share of all runs that aren't queued. |
Queued runs count toward **Runs** but not toward the success rate, so the tiles might not add up to **Runs**. The success rate shows a dash when no run has finished.
### Read the Run Summary Tiles
Below the chart, five tiles summarize the selected time window:
| Tile | Meaning |
| - | - |
| **Runs** | All runs, including queued runs. |
| **Passed** | Runs that succeeded. |
| **Failed** | Runs that failed. |
| **Aborted** | Runs that ended with an error before producing a result. |
| **Success rate** | Passed runs as a share of all runs that aren't queued. |
Queued runs count toward **Runs** but not toward the success rate, so the tiles might not add up to **Runs**. The success rate shows a dash when no run has finished.
 ### Review Run Details
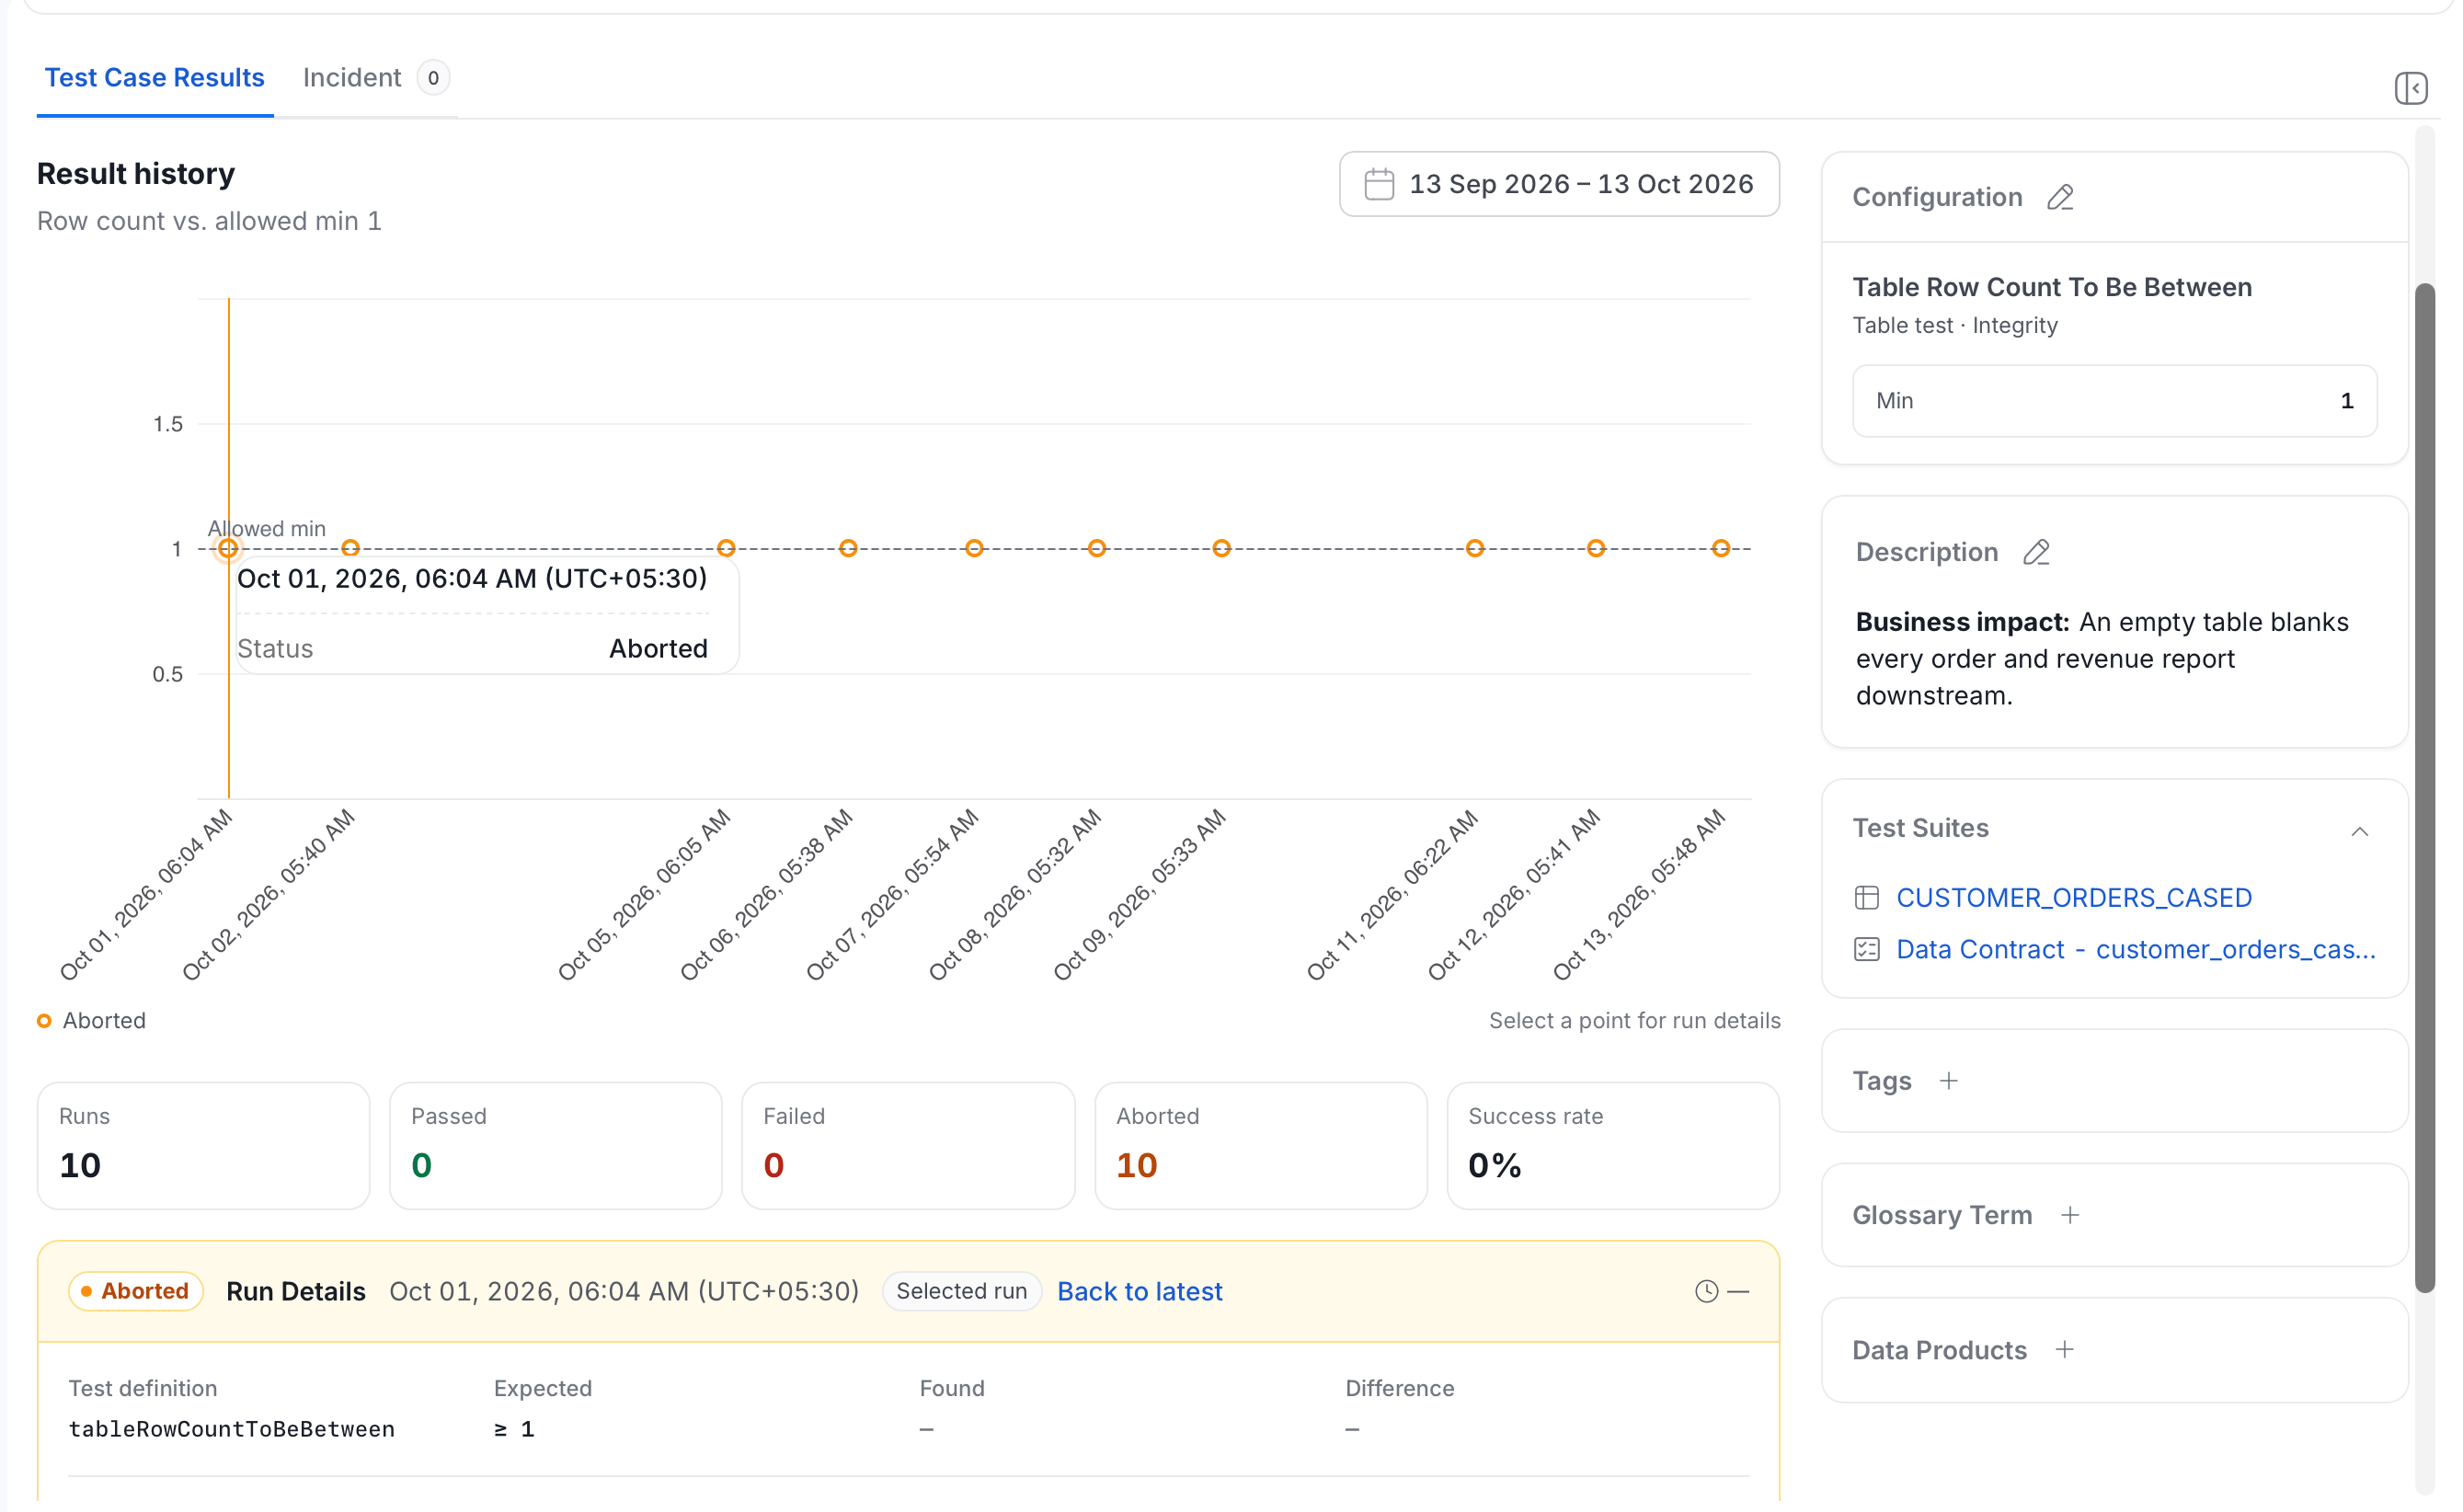
Below the tiles, the **Run Details** card shows the latest run by default. Hover over a marker on the chart to see its time and status, and select the marker to show that run instead. The card then shows a **Selected run** label, and **Back to latest** returns to the latest run.
The card shows the following:
* The run status, the date and time of the run, and how long the run took. If the run timed out, the duration is marked **(timeout)**.
* **Test definition**: The test that ran.
* **Expected**: The value or range that the test expects.
* **Found**: The value that the run measured.
* **Difference**: How far the measured value is from what the test expects.
For an aborted run, **Found** and **Difference** show a dash, because the run didn't produce a result.
### Review Run Details
Below the tiles, the **Run Details** card shows the latest run by default. Hover over a marker on the chart to see its time and status, and select the marker to show that run instead. The card then shows a **Selected run** label, and **Back to latest** returns to the latest run.
The card shows the following:
* The run status, the date and time of the run, and how long the run took. If the run timed out, the duration is marked **(timeout)**.
* **Test definition**: The test that ran.
* **Expected**: The value or range that the test expects.
* **Found**: The value that the run measured.
* **Difference**: How far the measured value is from what the test expects.
For an aborted run, **Found** and **Difference** show a dash, because the run didn't produce a result.
 An aborted run also shows an **Execution error** section below those values. It shows the type of the error and the message from the failed run, for example a database connection error, and the traceback when the run recorded one. Long messages are shortened. Select **more** to read the rest.
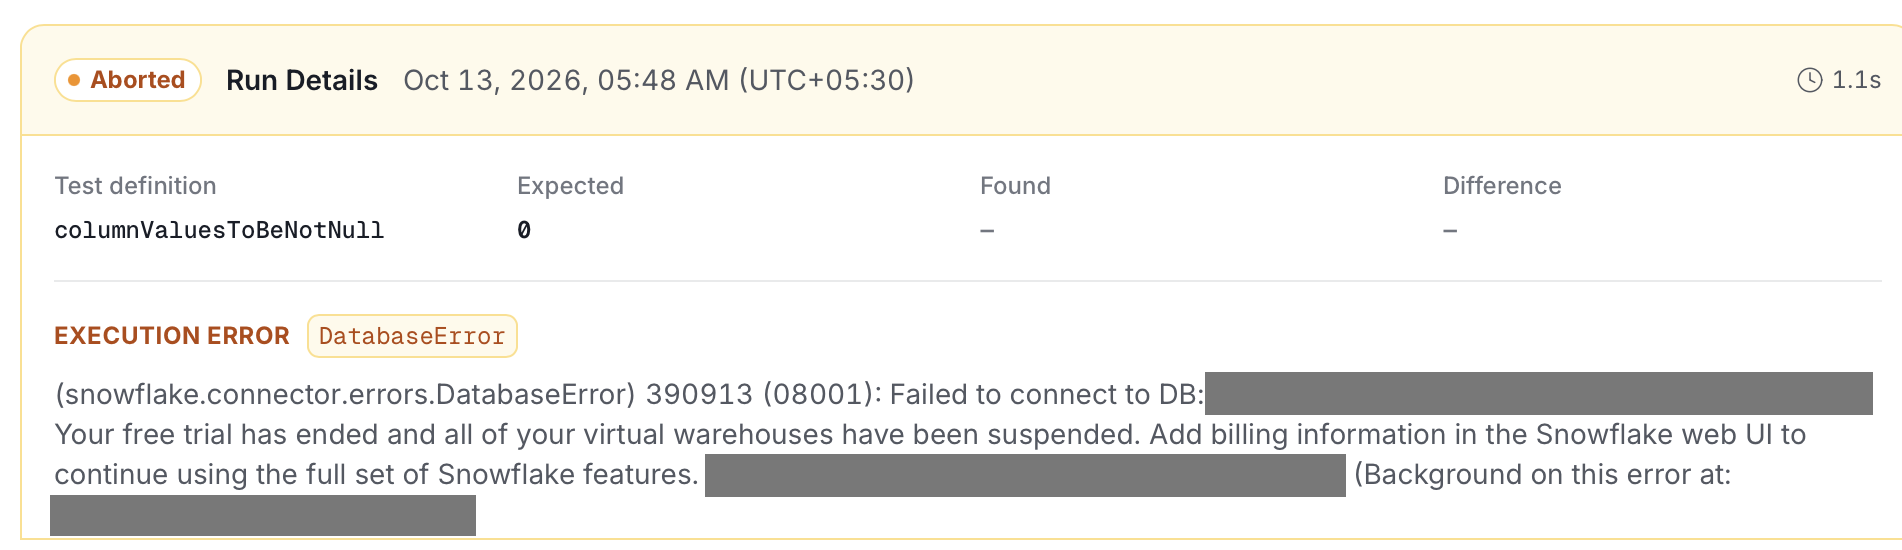 **Warning**: The error text can include host names, SQL text, and file paths from the run. Treat it as sensitive when you share it.
This documentation is built and hosted on [Mintlify](https://mintlify.com), a developer documentation platform.
**Warning**: The error text can include host names, SQL text, and file paths from the run. Treat it as sensitive when you share it.
This documentation is built and hosted on [Mintlify](https://mintlify.com), a developer documentation platform.