> ## Documentation Index
> Fetch the complete documentation index at: https://docs.getcollate.io/llms.txt
> Use this file to discover all available pages before exploring further.
# Custom Metrics
> Define SQL-based custom metrics at the table and column level to track aggregate values alongside built-in profiler metrics.
# Custom Metrics
Custom metrics let you define SQL-based metrics that the profiler computes alongside built-in system metrics. Add them at the table level to track aggregate values across rows, or at the column level to measure values for a specific column. Computed results appear in the **Table Profile** and **Column Profile** tabs after the Profiler Agent runs.
## Table-Level Metrics
Table-level metrics track a custom aggregate value computed across all rows in a table.
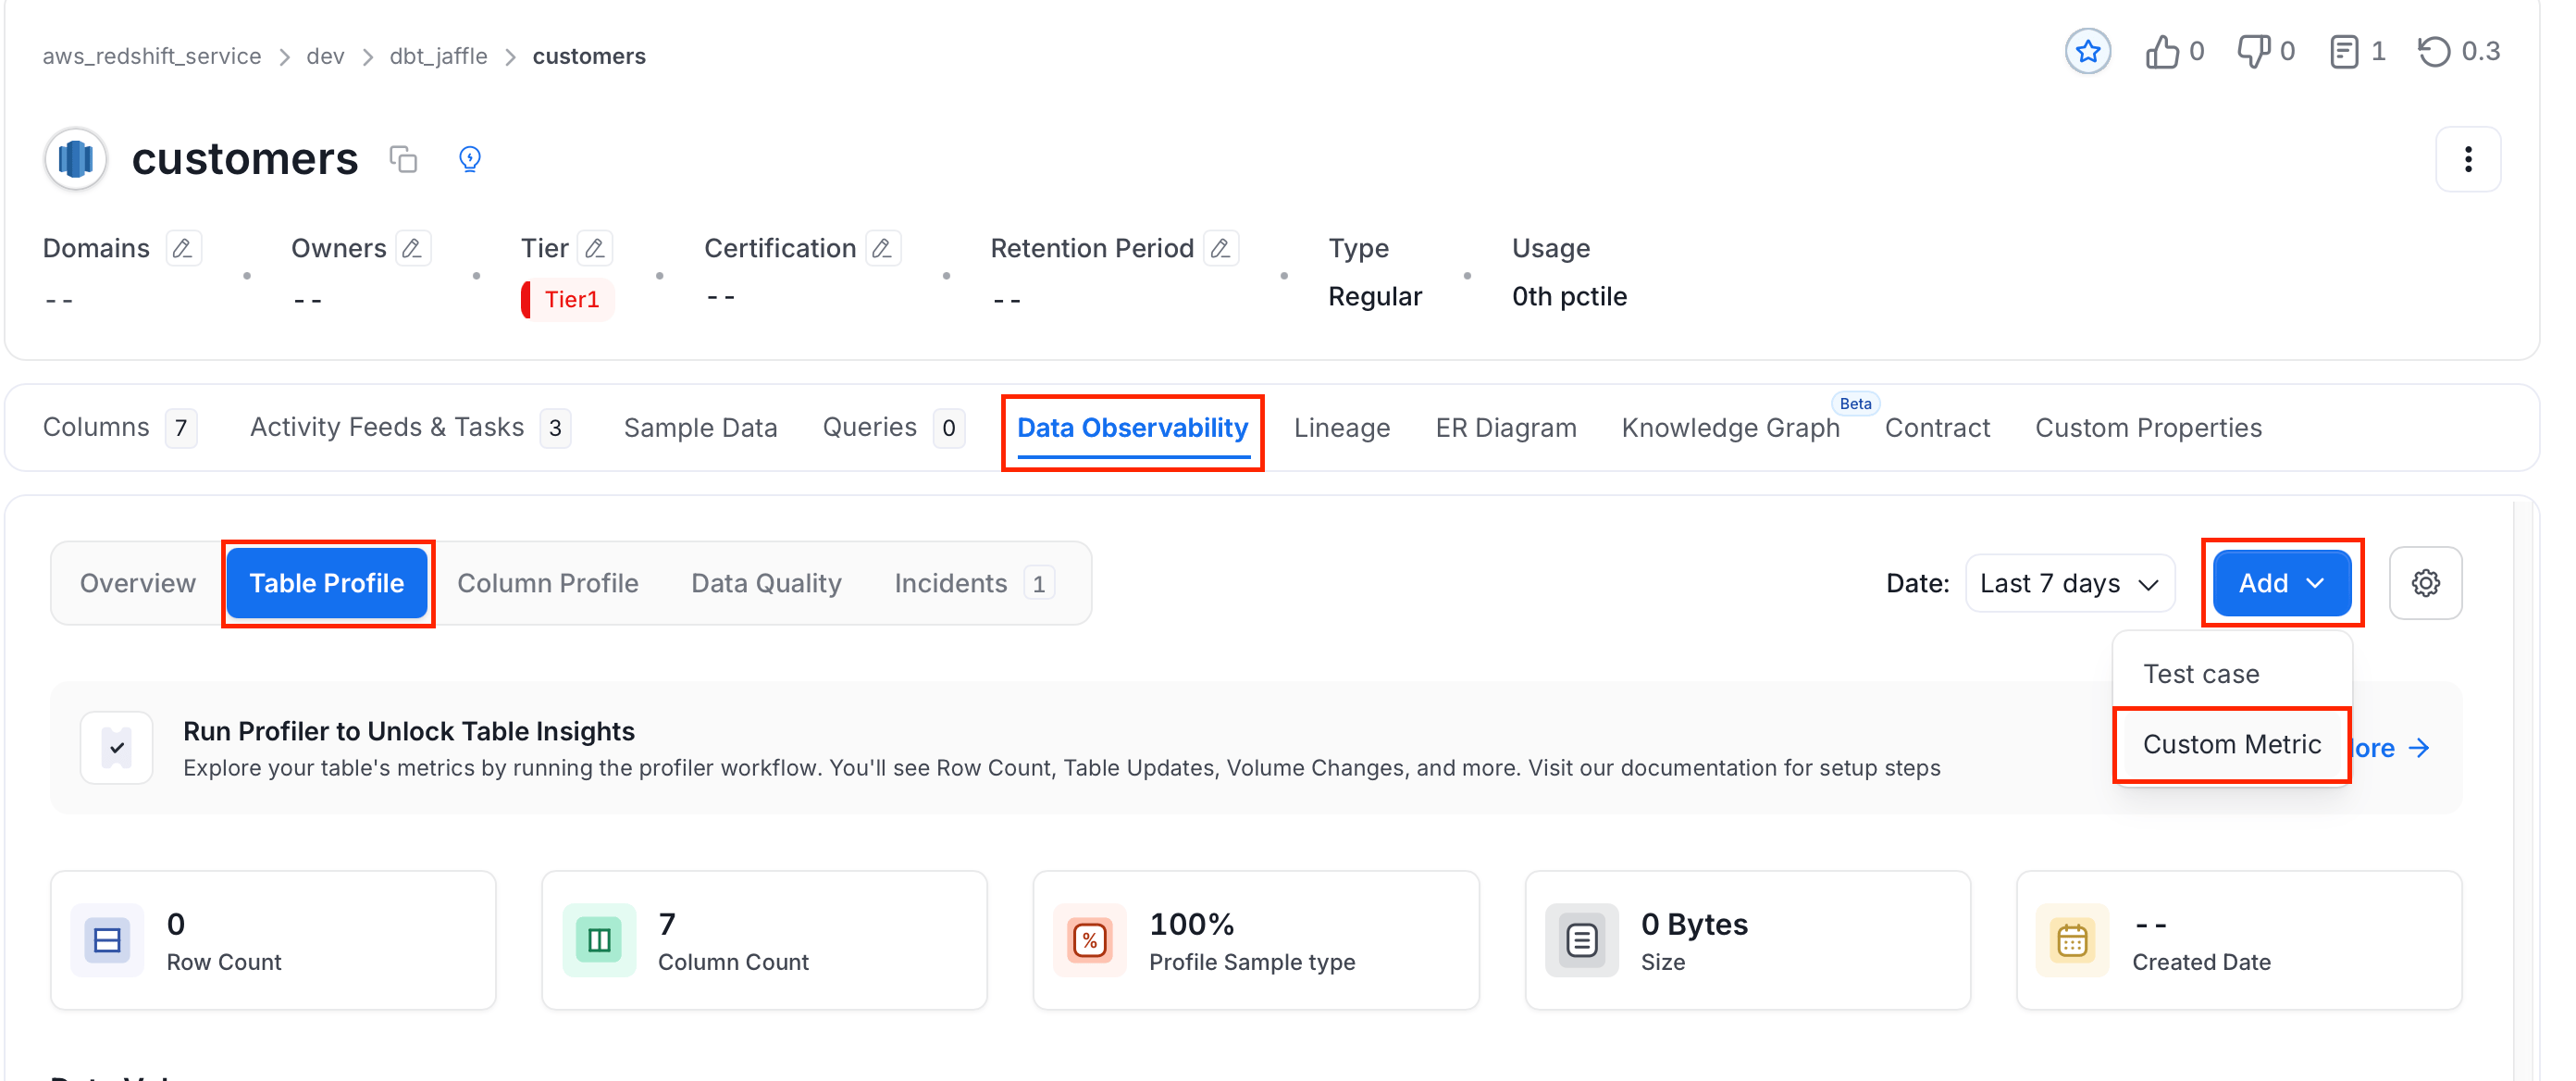
1. In the table's details page, navigate to the **Data Observability** tab and click **Table Profile**.
2. Click **Add** and select **Custom Metric**.
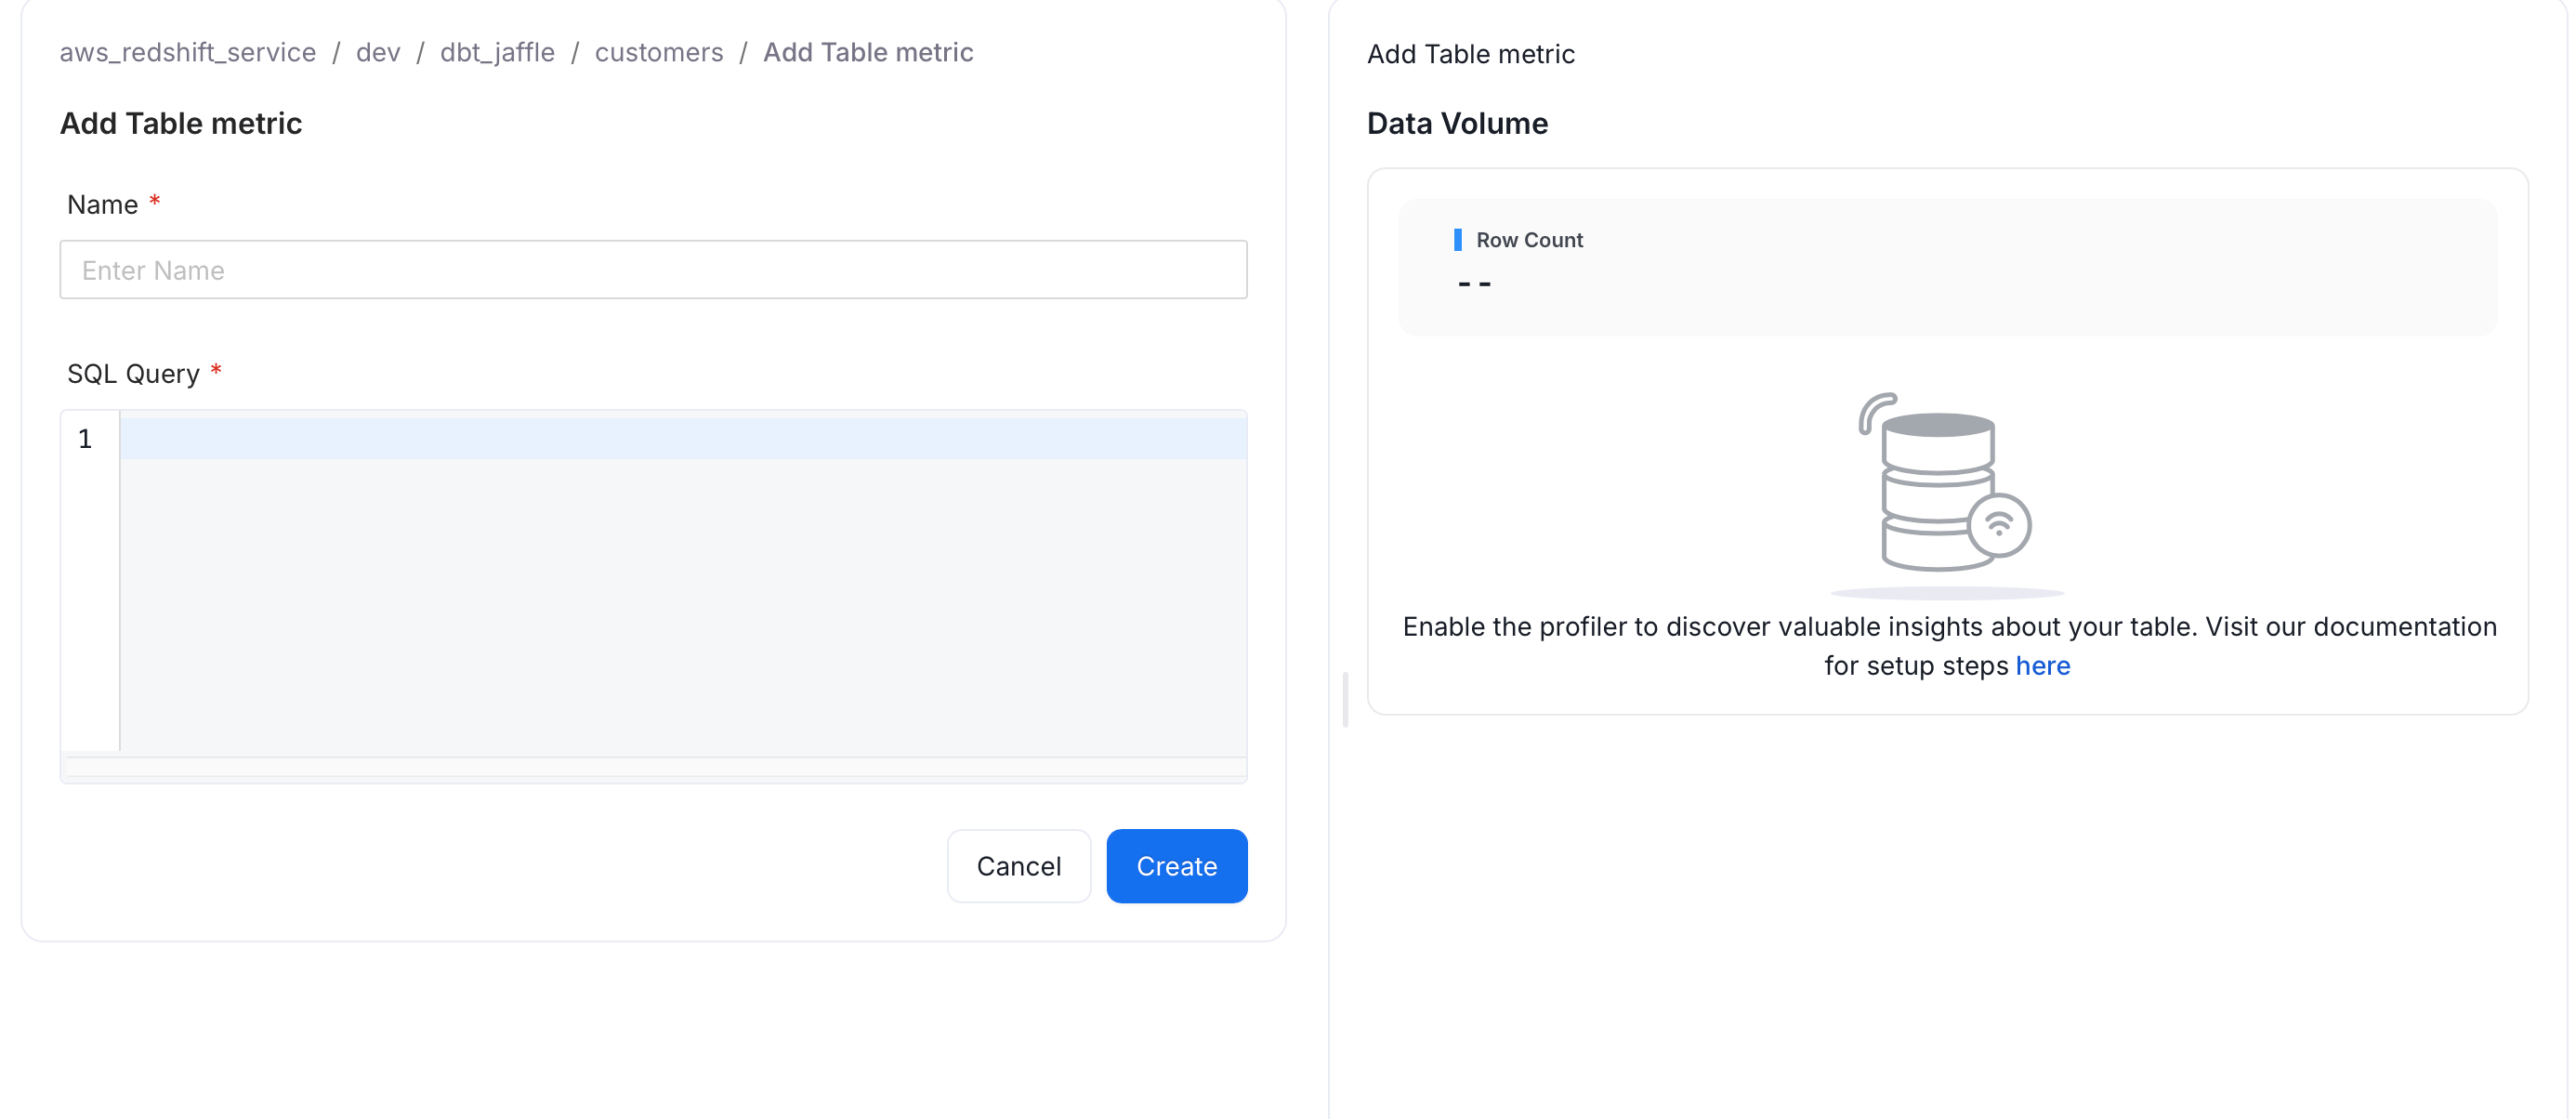
 3. In the **Add Table metric** form, fill in the following required fields and click **Create**:
* **Name**: A unique descriptive name for this metric.
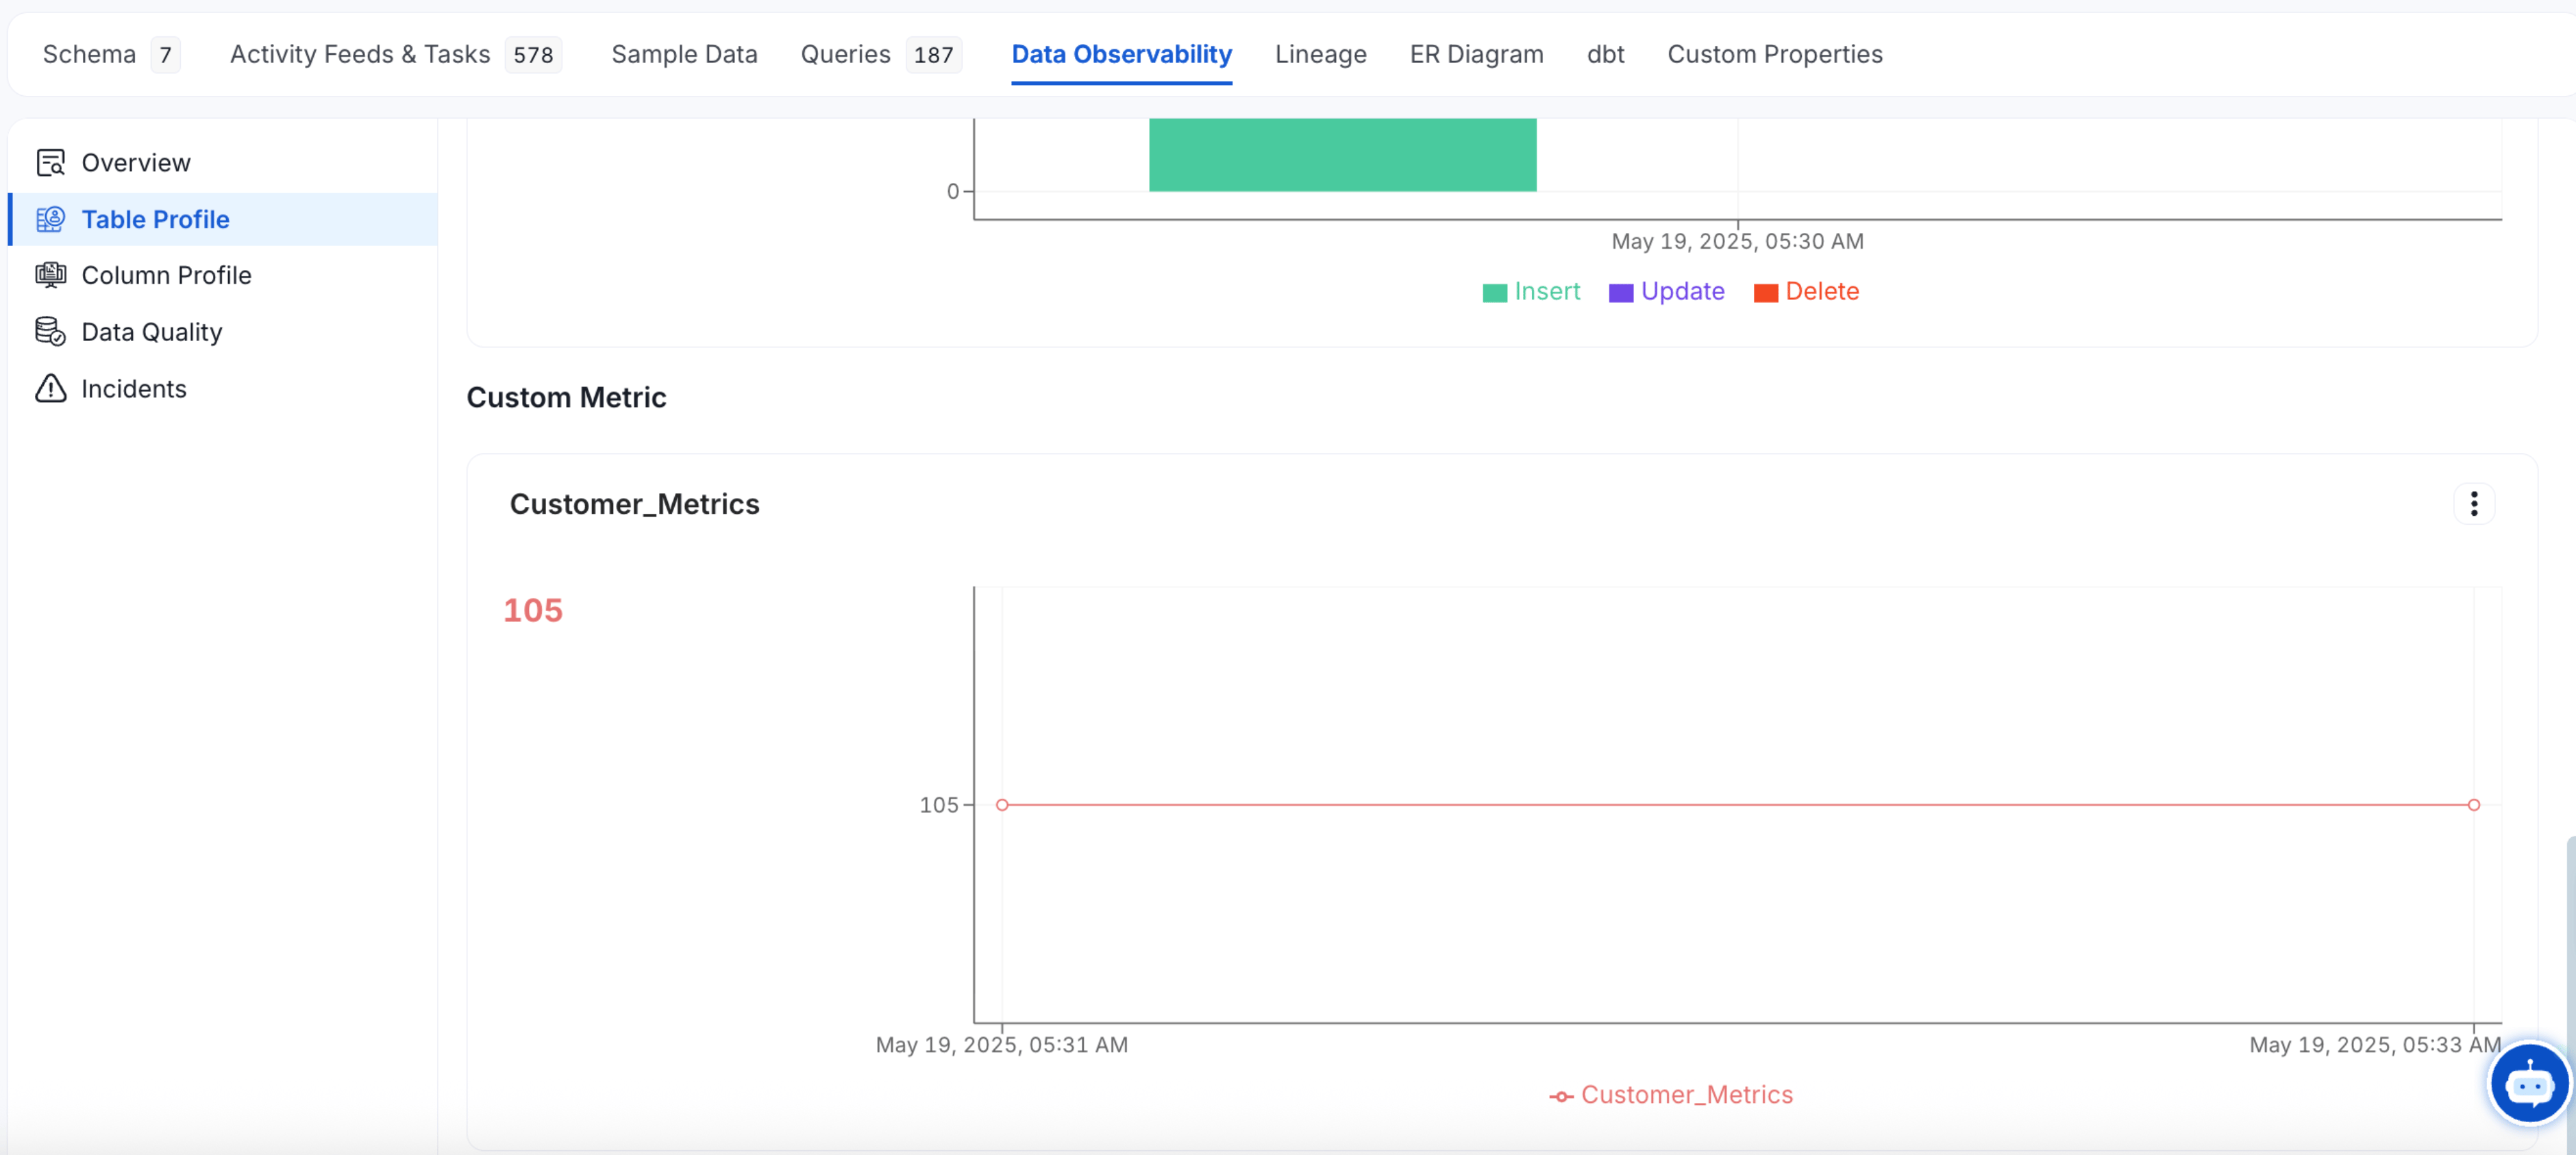
* **SQL Query**: A SQL expression that returns a single numeric value. The result appears as a custom metric under **Data Volume** on the **Table Profile** tab.
3. In the **Add Table metric** form, fill in the following required fields and click **Create**:
* **Name**: A unique descriptive name for this metric.
* **SQL Query**: A SQL expression that returns a single numeric value. The result appears as a custom metric under **Data Volume** on the **Table Profile** tab.
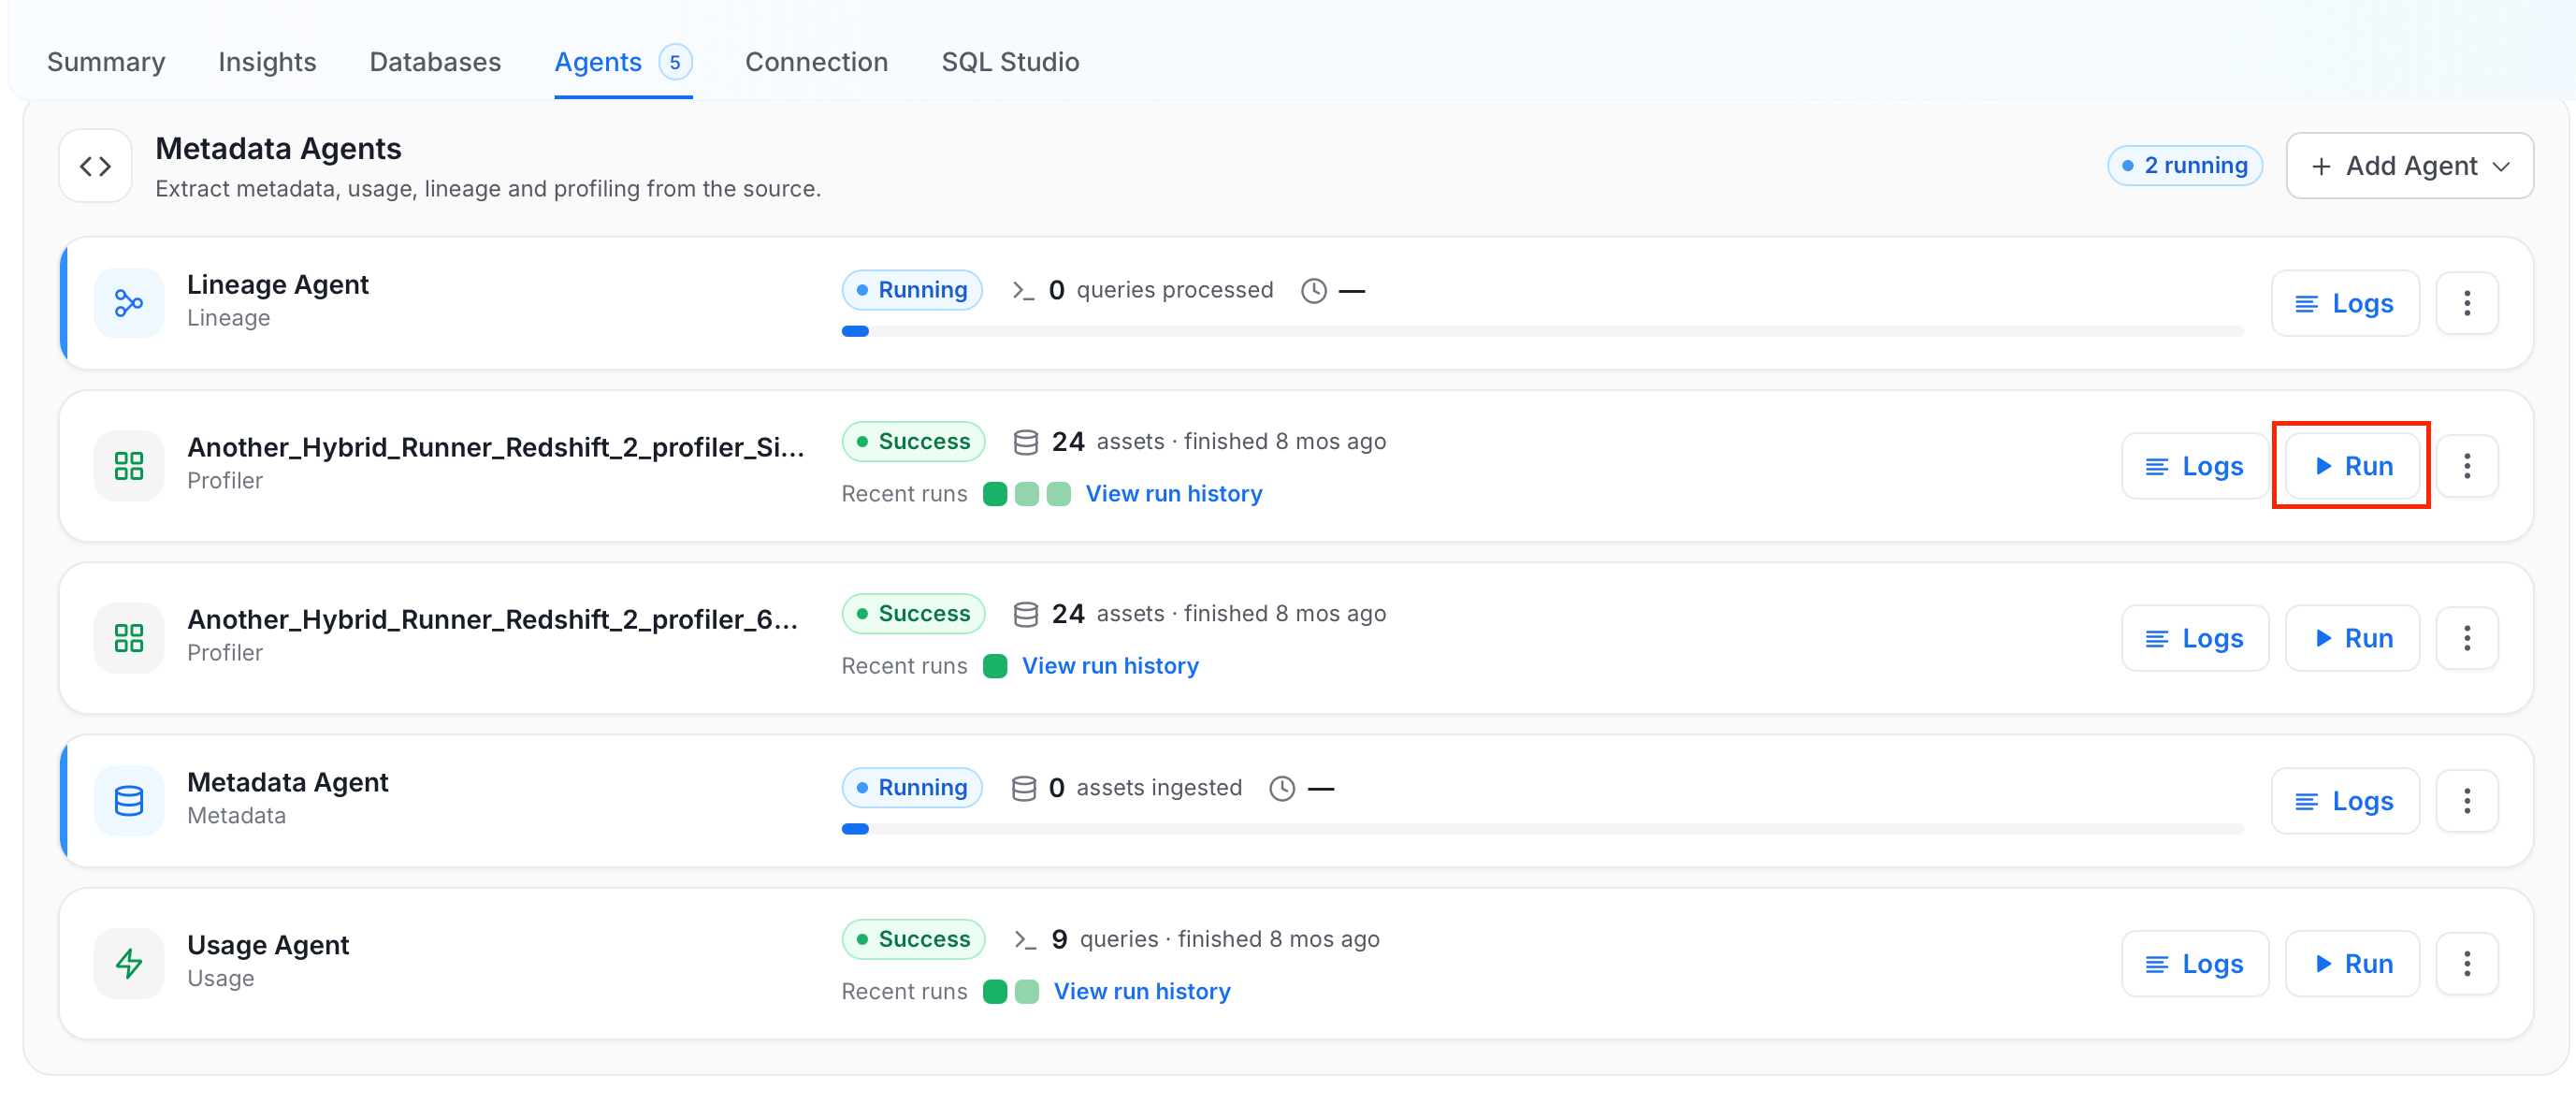
 4. After the custom metric is added, navigate to the database service and run the **Profiler Agent** from the **Agents** tab.
 5. After the run is completed, return to the table to view the computed custom metric on the **Table Profile** tab.
 ## Column-Level Metrics
Column-level metrics track a custom value computed for a specific column in a table.
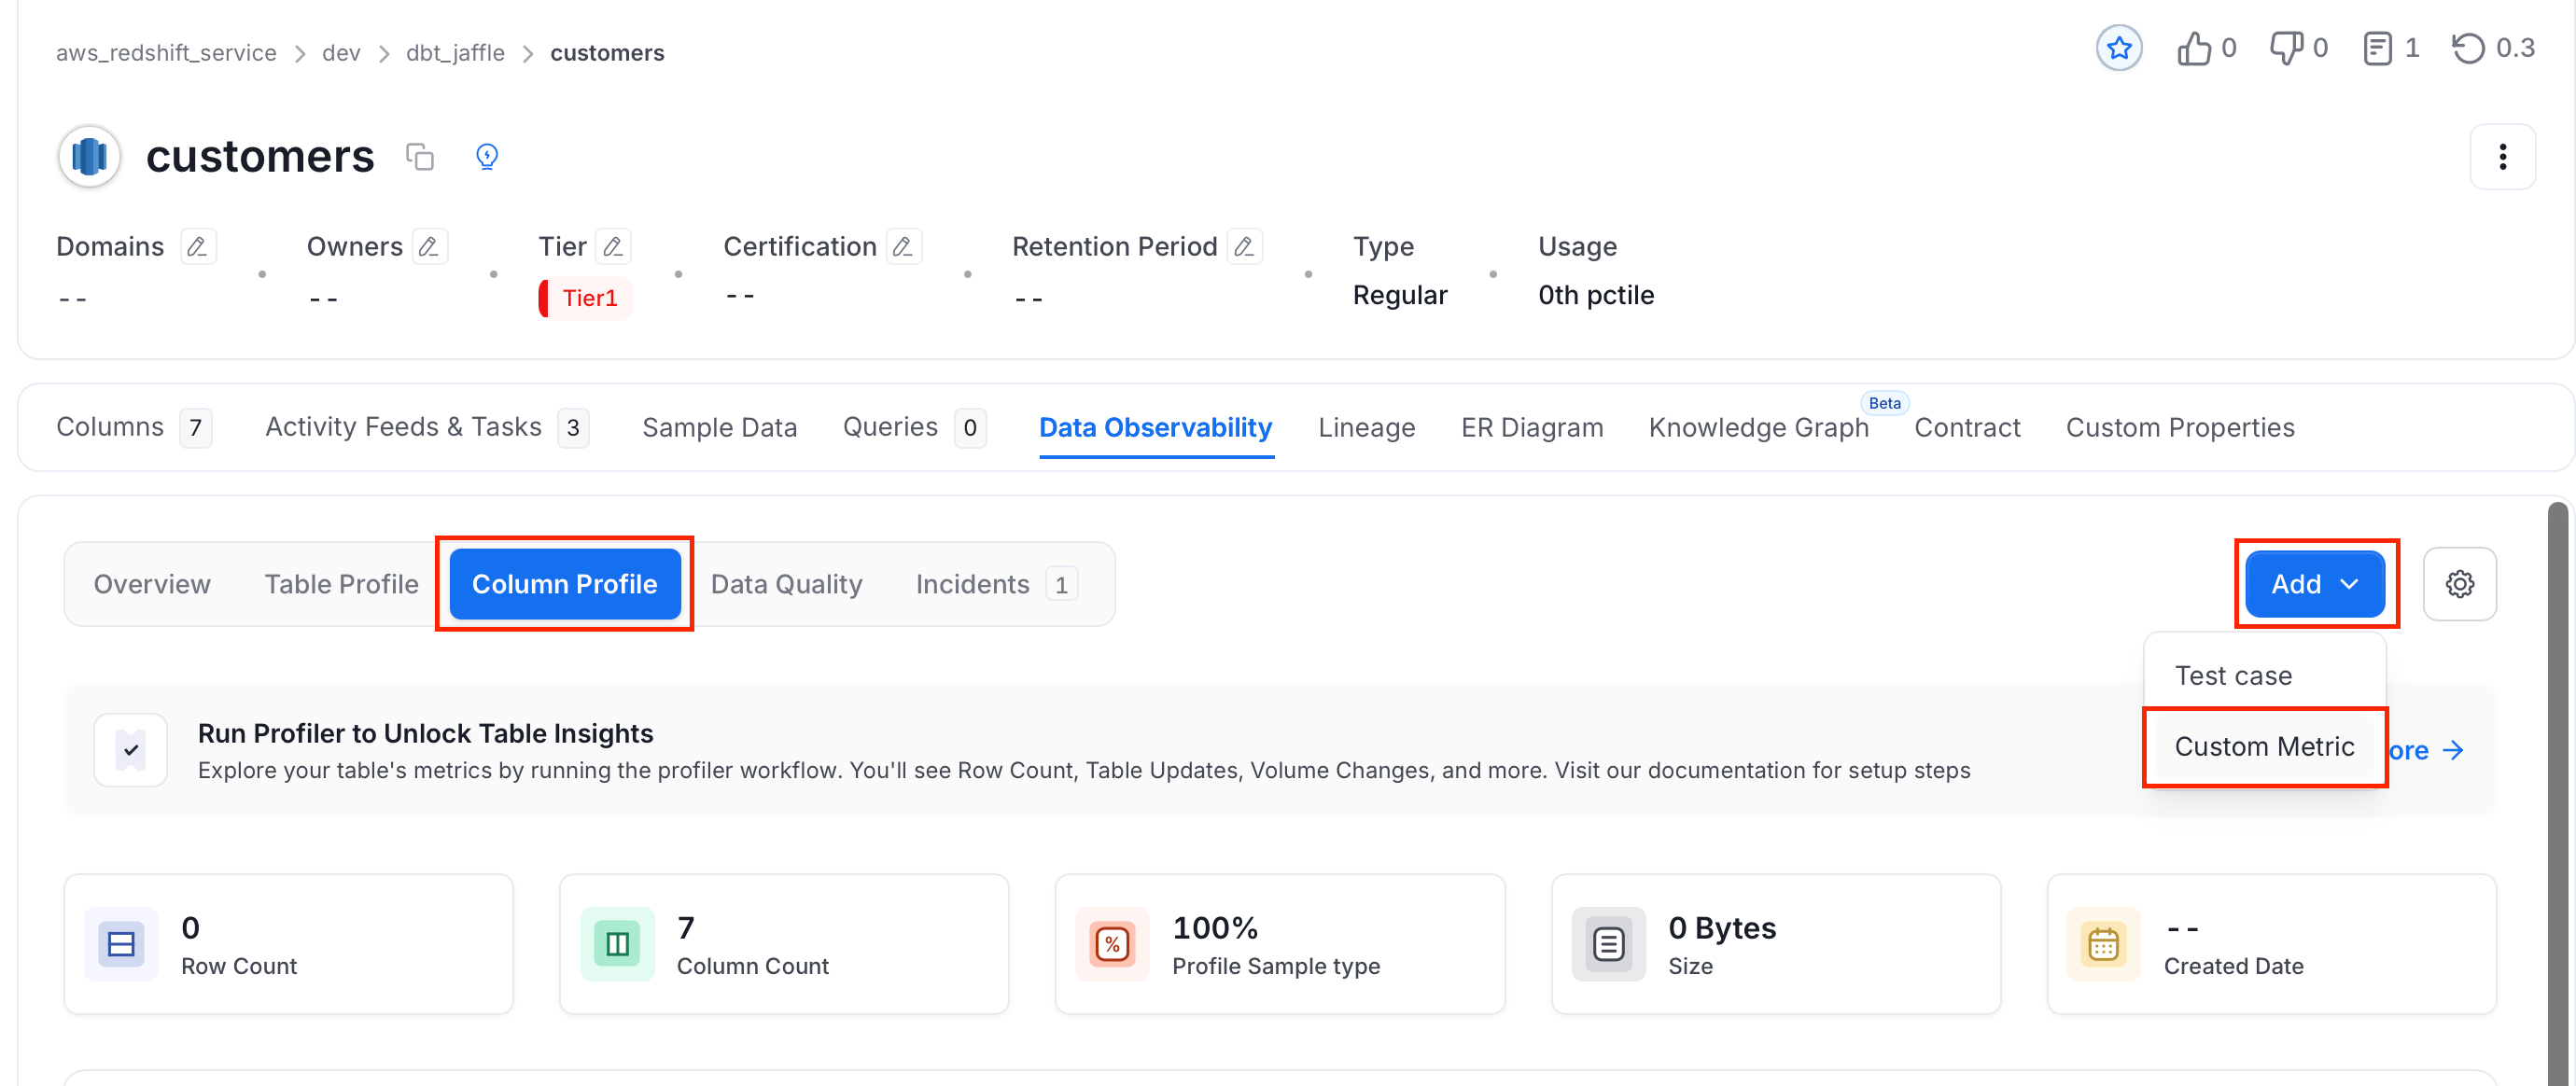
1. In the table's details page, navigate to the **Data Observability** tab and click **Column Profile**.
2. Click **Add** and select **Custom Metric**.
## Column-Level Metrics
Column-level metrics track a custom value computed for a specific column in a table.
1. In the table's details page, navigate to the **Data Observability** tab and click **Column Profile**.
2. Click **Add** and select **Custom Metric**.
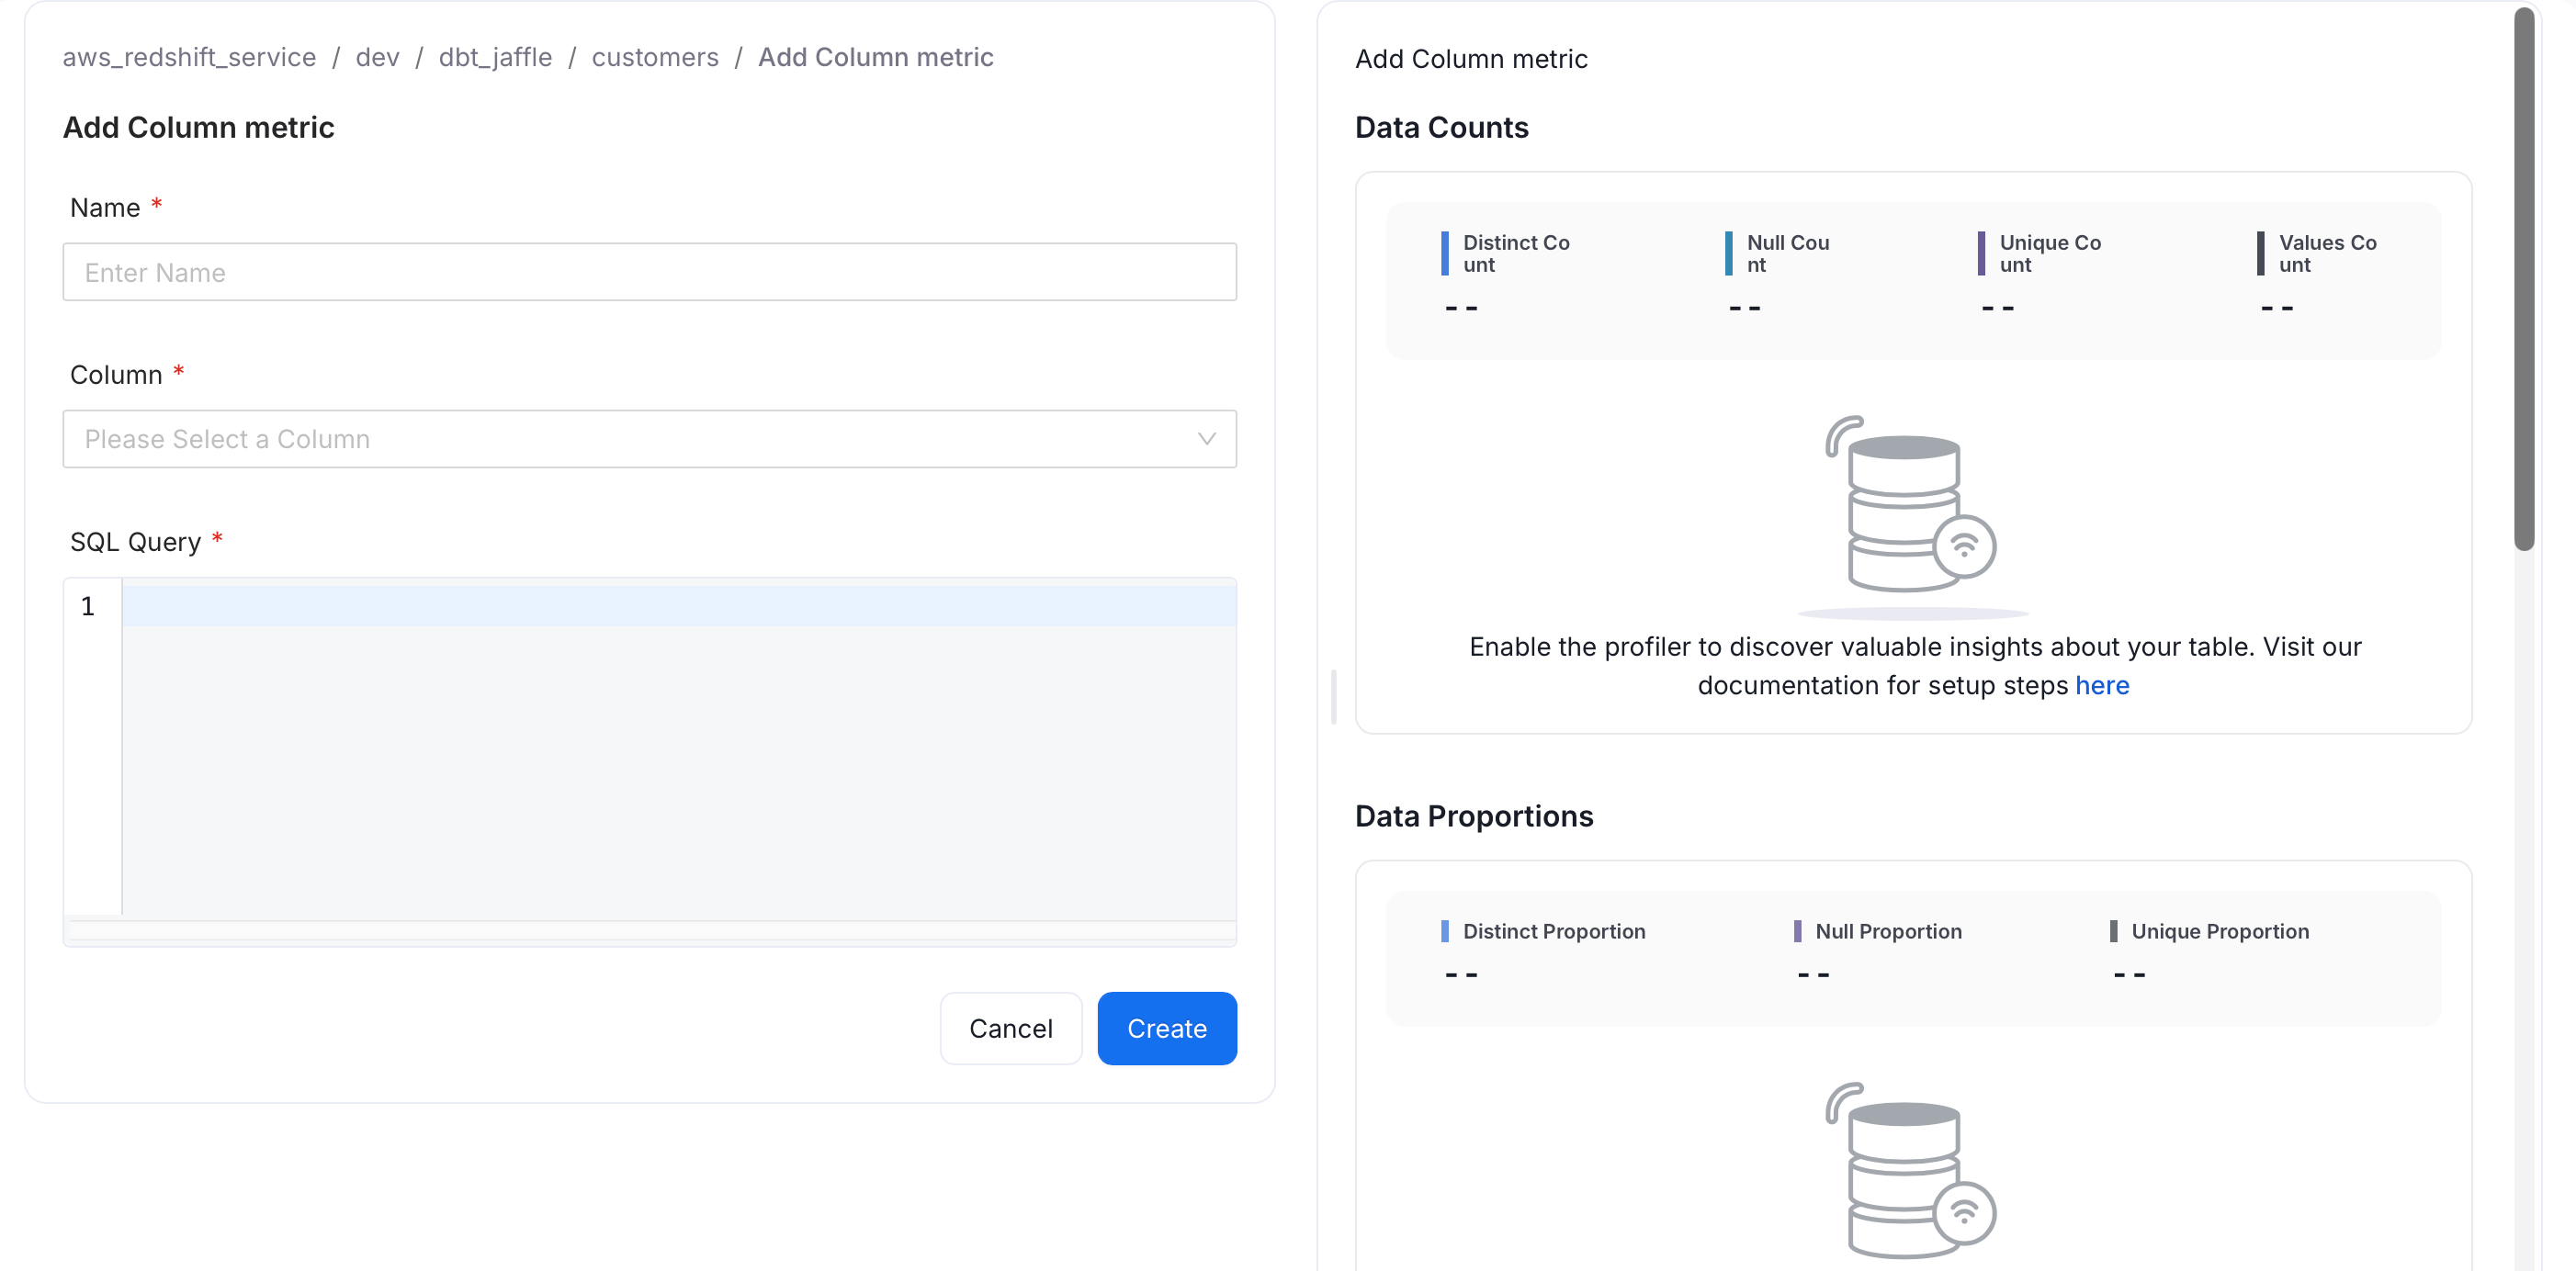
 3. In the **Add Column metric** form, fill in the following required fields and click **Create**:
* **Name**: A unique descriptive name for this metric.
* **Column**: The column this metric applies to. Select from the dropdown list of columns in the table.
* **SQL Query**: A SQL expression that returns a single numeric value for the selected column. The result appears as a custom metric under **Data Counts** on the **Column Profile** tab.
3. In the **Add Column metric** form, fill in the following required fields and click **Create**:
* **Name**: A unique descriptive name for this metric.
* **Column**: The column this metric applies to. Select from the dropdown list of columns in the table.
* **SQL Query**: A SQL expression that returns a single numeric value for the selected column. The result appears as a custom metric under **Data Counts** on the **Column Profile** tab.
 4. After the custom metric is added, navigate to the database service and run the **Profiler Agent** from the **Agents** tab.
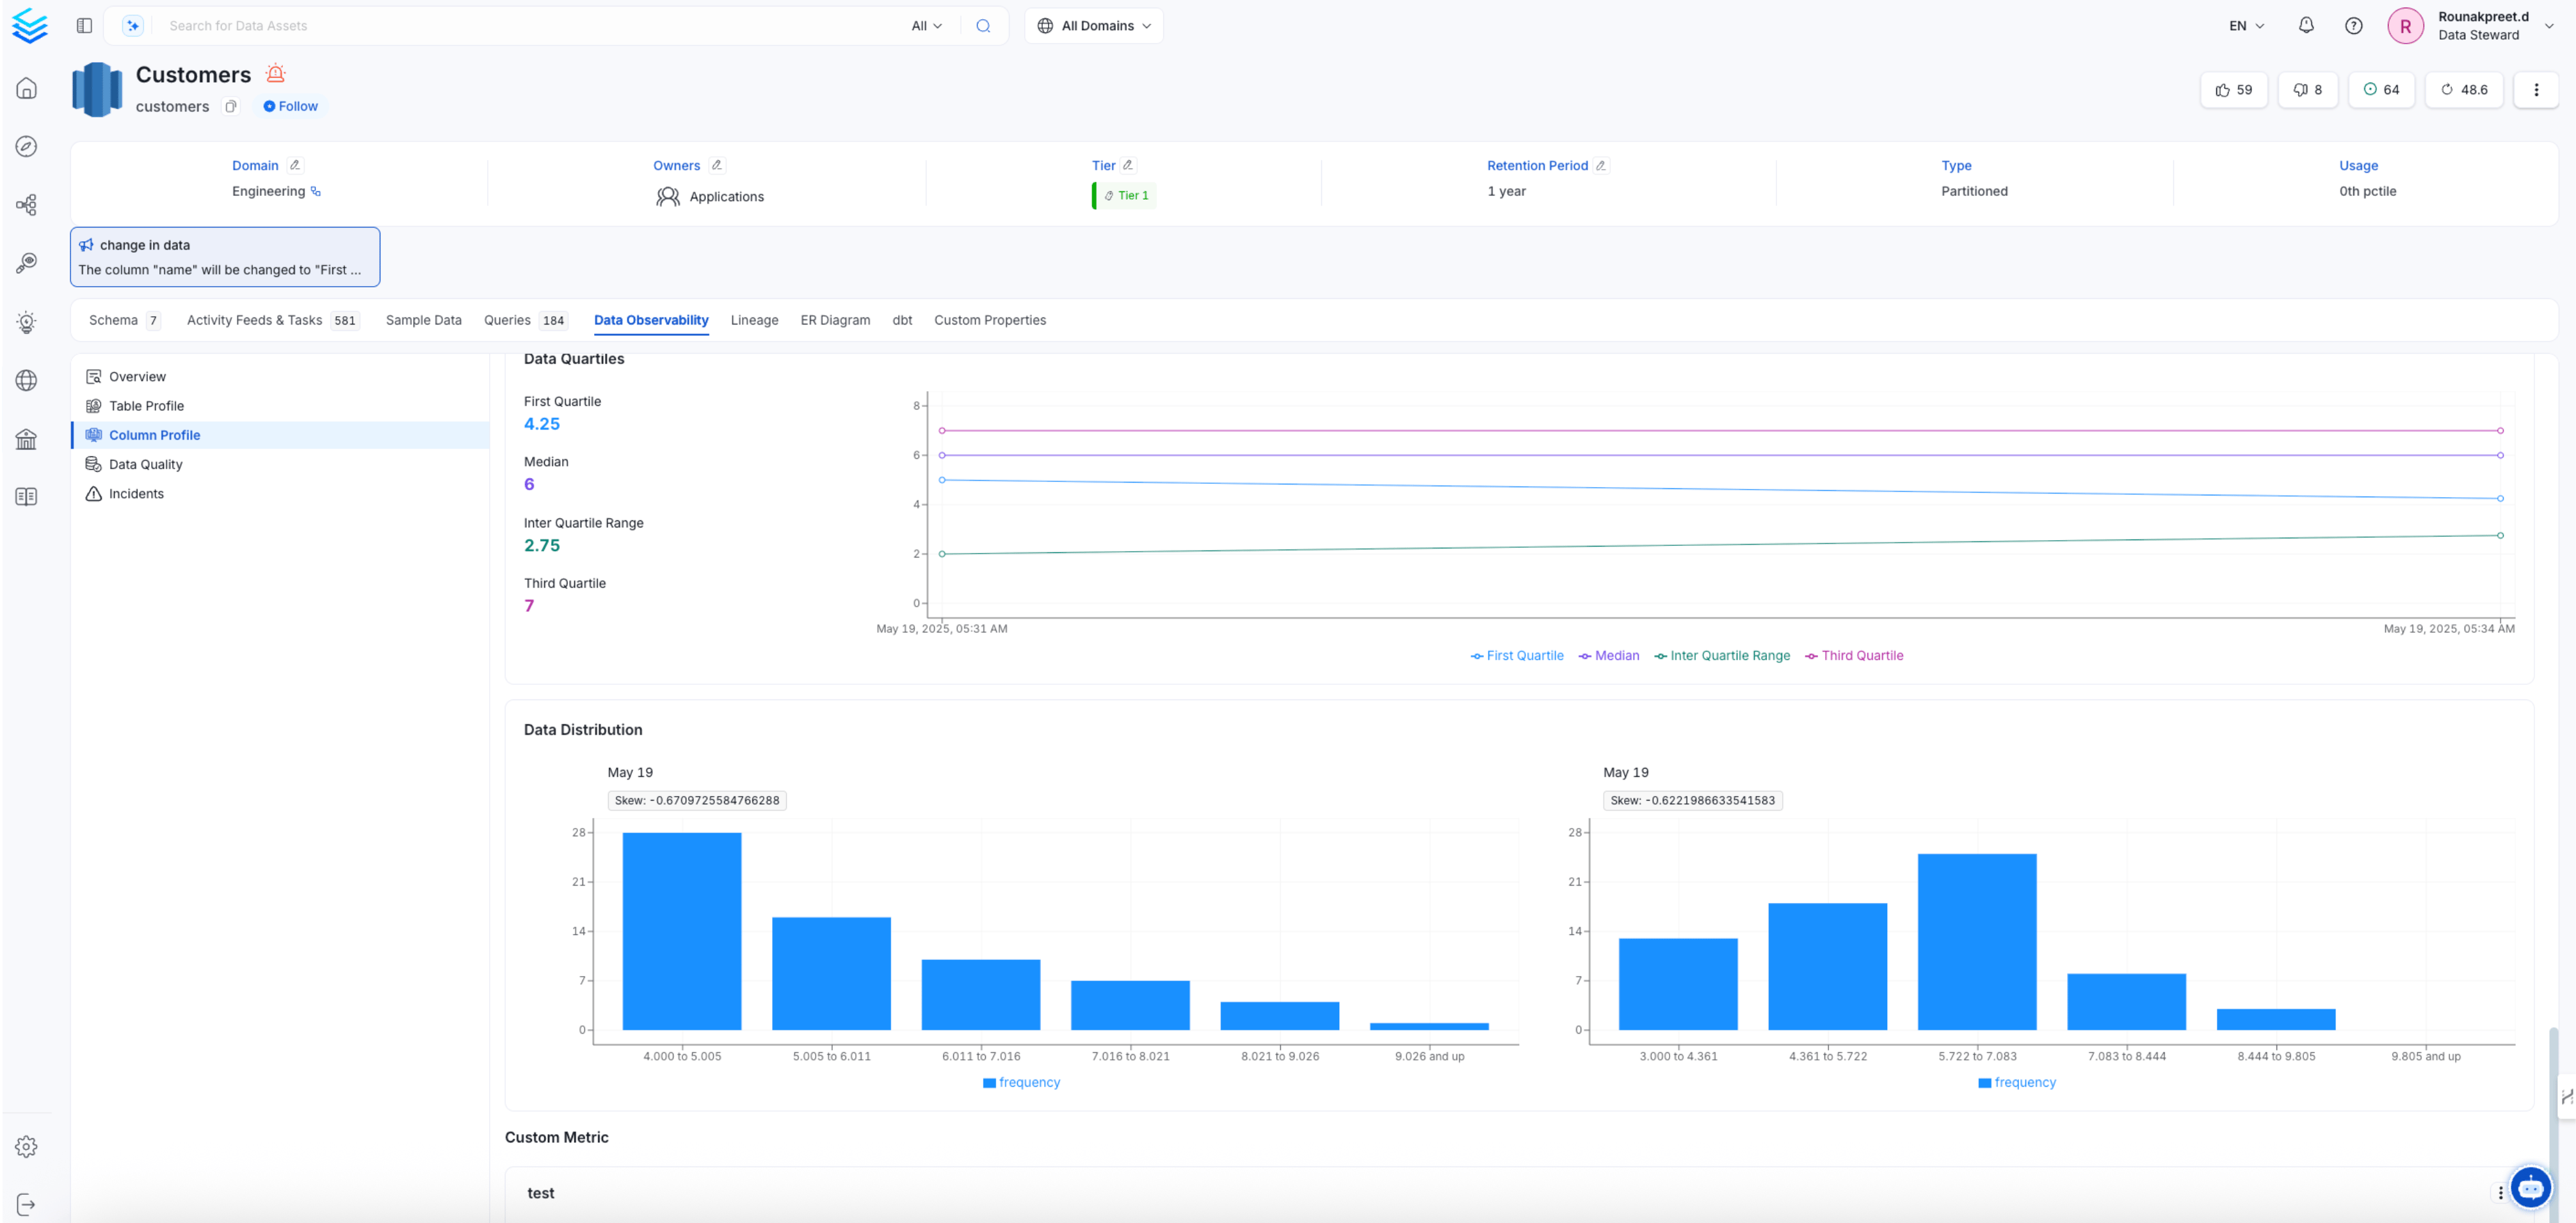
5. After the run is completed, return to the table to view the computed custom metric on the **Column Profile** tab.
4. After the custom metric is added, navigate to the database service and run the **Profiler Agent** from the **Agents** tab.
5. After the run is completed, return to the table to view the computed custom metric on the **Column Profile** tab.