> ## Documentation Index
> Fetch the complete documentation index at: https://docs.getcollate.io/llms.txt
> Use this file to discover all available pages before exploring further.
# Explore the Lineage View
> Explore lineage diagrams interactively to understand how data flows between sources, transformations, and dashboards.
# Explore the Lineage View
Collate shows you end-to-end lineage for tables, dashboards, and pipelines — all in one interactive graph. Search for any data asset, expand the graph, and trace upstream and downstream relationships. Each edge in the graph carries the SQL query, pipeline information, and column-level details.
## Understanding the Lineage Graph
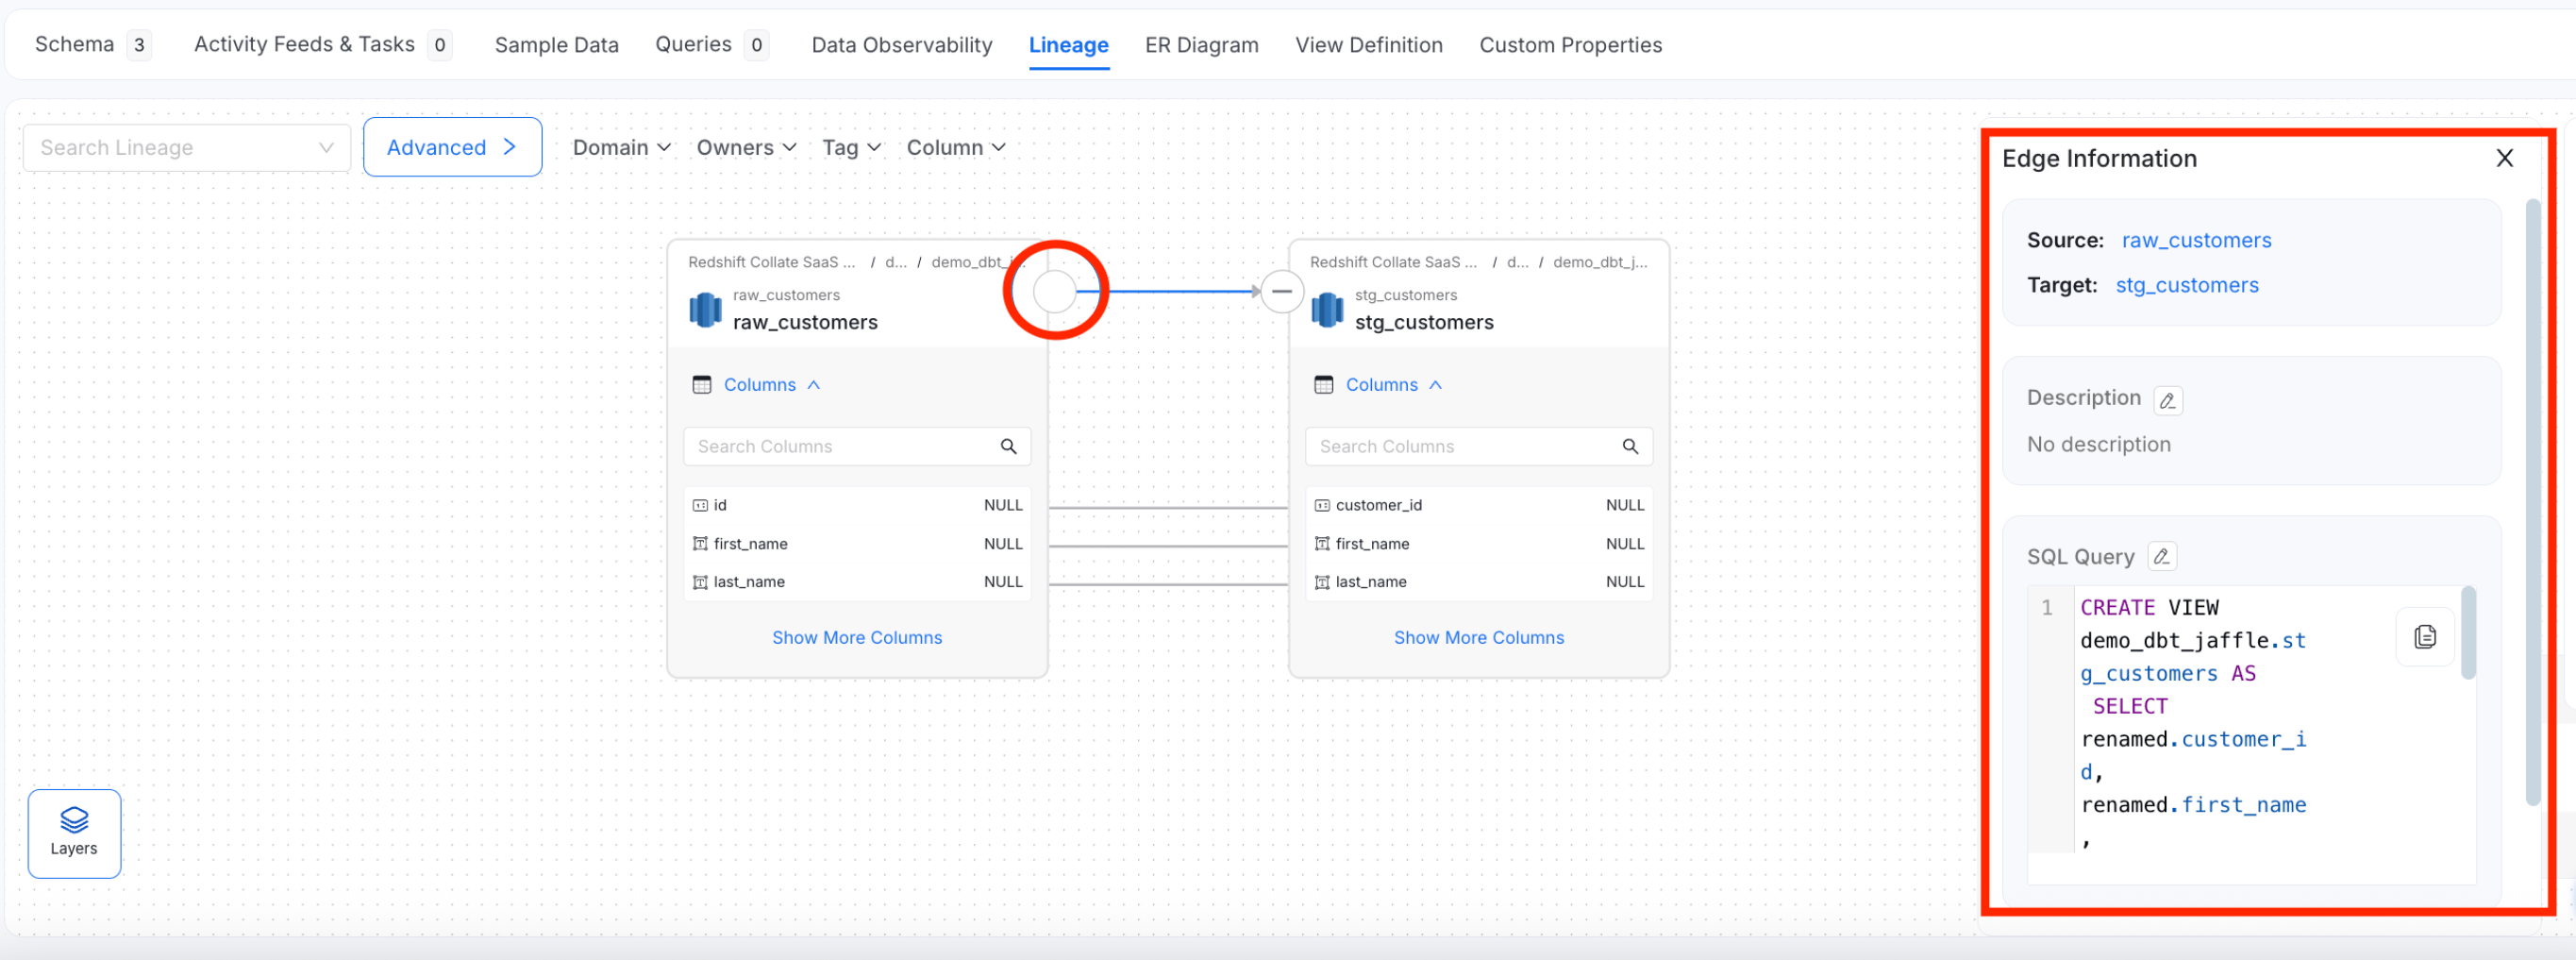
The lineage graph has three core elements:
* **Source node**: The table on the left — where data originates.
* **Target node**: The table on the right — where data ends up. You can also spot it by the arrow pointing into it.
* **Edge**: The connection between source and target. Click any edge to see the source, target, description, and the SQL query used to generate the view.
 **Tip**: Metadata ingestion also brings in view lineage automatically, if your database has views (data assets of type View).
## Configure the Lineage Display
Control how many upstream and downstream nodes appear in the graph.
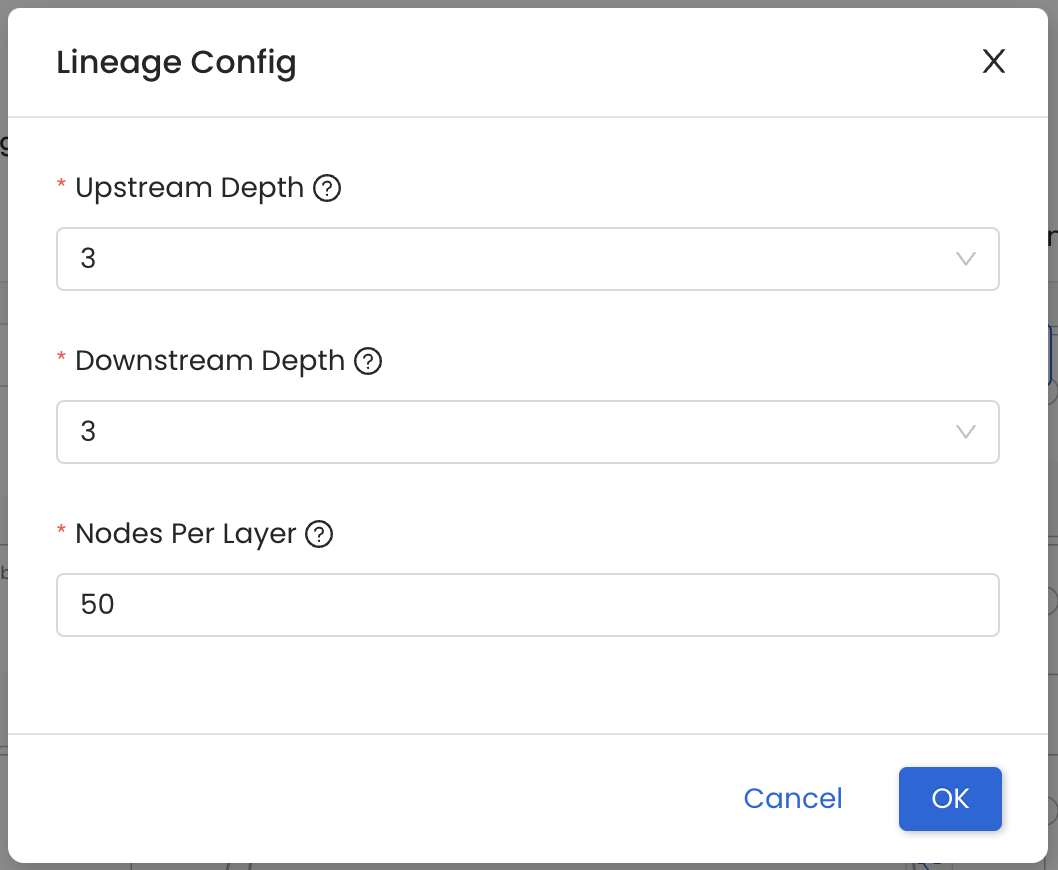
Open **Lineage Config** to set the number of upstream nodes, downstream nodes, and nodes per layer. You can display up to **3** levels of upstream and downstream nodes.
**Tip**: Metadata ingestion also brings in view lineage automatically, if your database has views (data assets of type View).
## Configure the Lineage Display
Control how many upstream and downstream nodes appear in the graph.
Open **Lineage Config** to set the number of upstream nodes, downstream nodes, and nodes per layer. You can display up to **3** levels of upstream and downstream nodes.
 ## Explore Data Asset Details
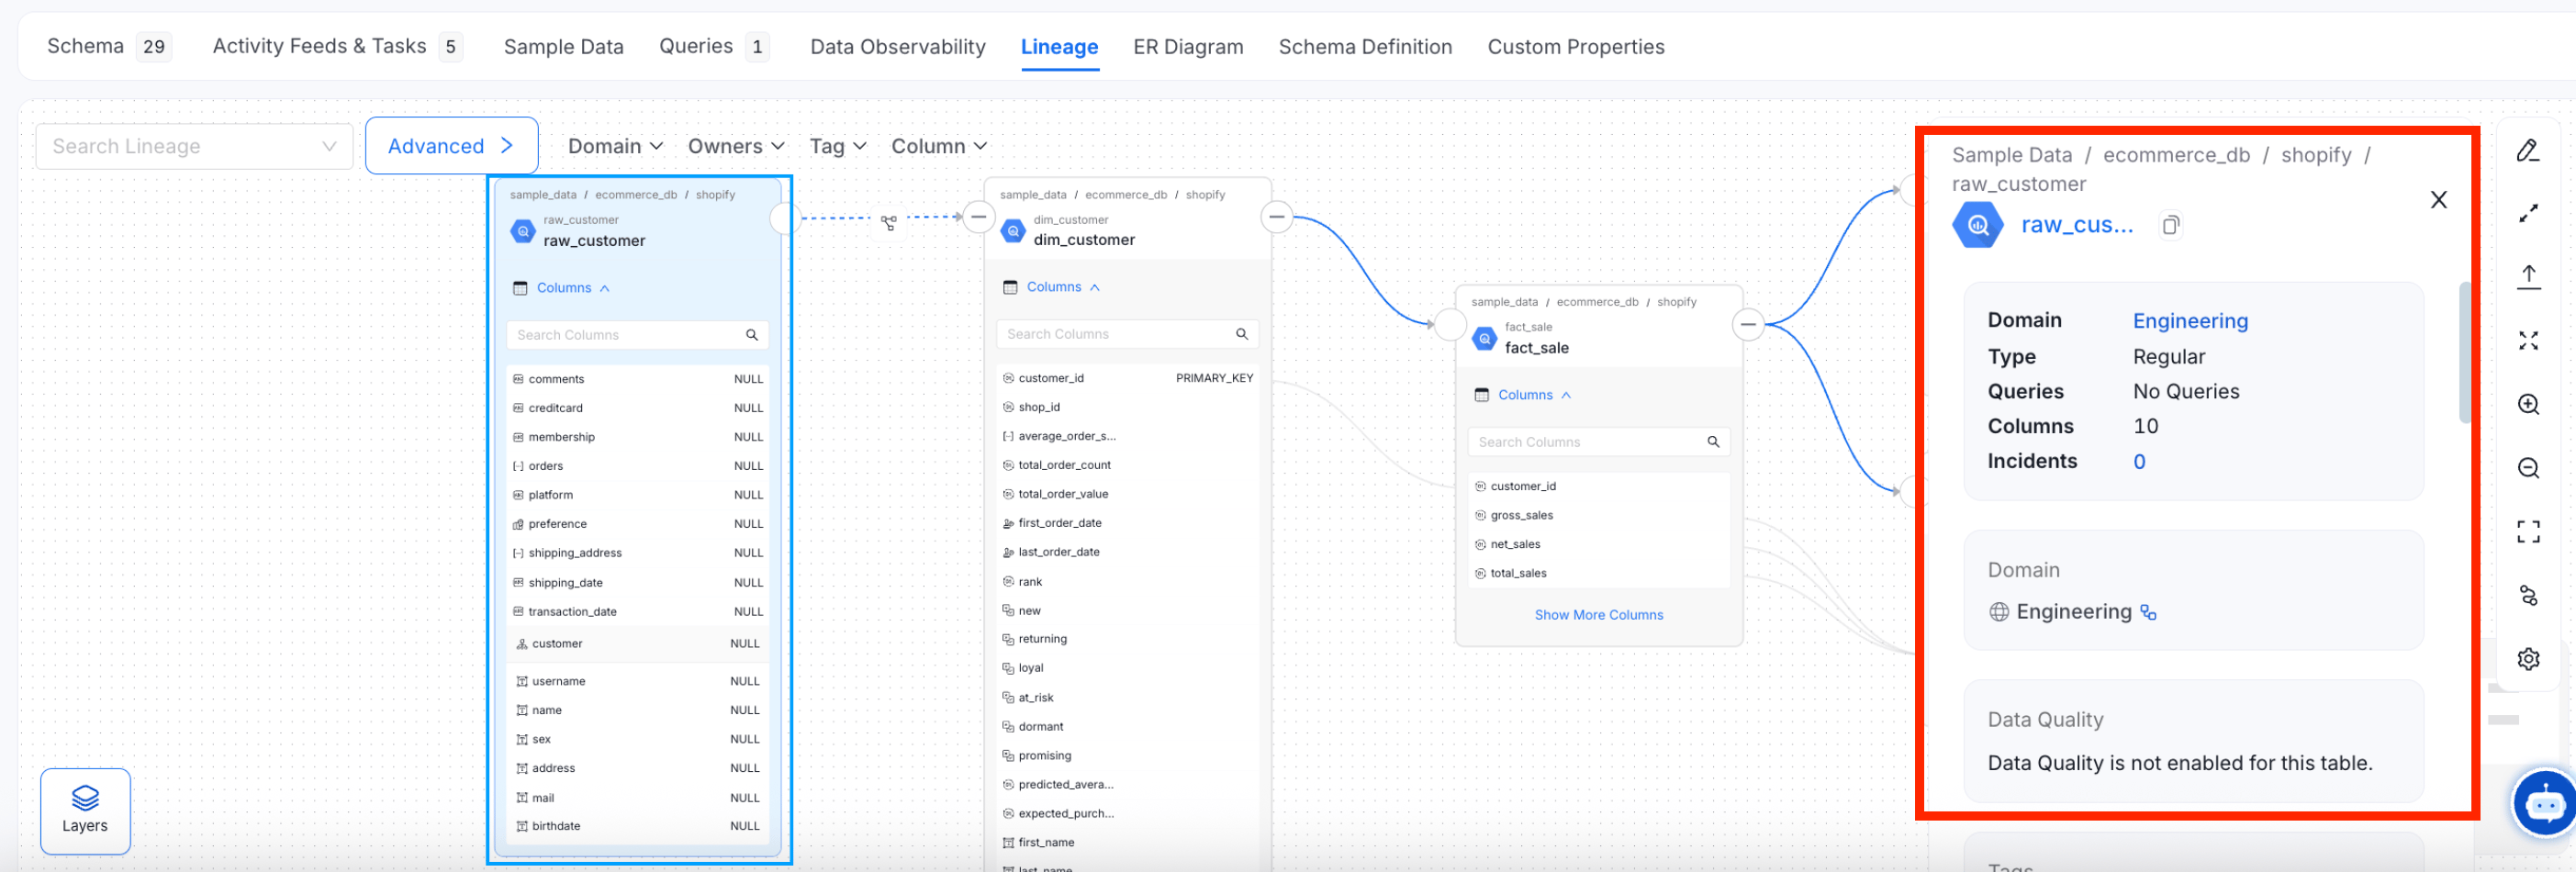
Click any node in the graph to see a quick preview of that asset.
The preview shows:
* **Name, description, owner, tier, and usage** for the asset
* **Type-specific details** — for tables, this includes the table type, query count, and column count
* **Data quality metrics** — tests passed, aborted, and failed
* **Tags** associated with the asset
* **Schema** — column names, types, and descriptions
## Explore Data Asset Details
Click any node in the graph to see a quick preview of that asset.
The preview shows:
* **Name, description, owner, tier, and usage** for the asset
* **Type-specific details** — for tables, this includes the table type, query count, and column count
* **Data quality metrics** — tests passed, aborted, and failed
* **Tags** associated with the asset
* **Schema** — column names, types, and descriptions
 ## Explore Column-Level Lineage
Click a table node to expand it and see its columns. Collate traces how individual columns flow from source to target — so you can follow a specific field all the way through your pipeline.
## Explore Column-Level Lineage
Click a table node to expand it and see its columns. Collate traces how individual columns flow from source to target — so you can follow a specific field all the way through your pipeline.
 ## Pipeline Lineage
For pipelines, Collate first ingests lineage from your databases. When you configure pipeline ingestion, you specify the database service name — Collate then links the database tables to the pipeline, and the edge information shows which pipeline created the relationship.
## Pipeline Lineage
For pipelines, Collate first ingests lineage from your databases. When you configure pipeline ingestion, you specify the database service name — Collate then links the database tables to the pipeline, and the edge information shows which pipeline created the relationship.
 ## Dashboard Lineage
For dashboards, Collate ingests lineage from your databases first. When you run dashboard ingestion, Collate pulls in data models and charts and links them back to the source database tables.
## Lineage Layers
Switch between layers to explore different dimensions of your data's lineage.
### Column Layer
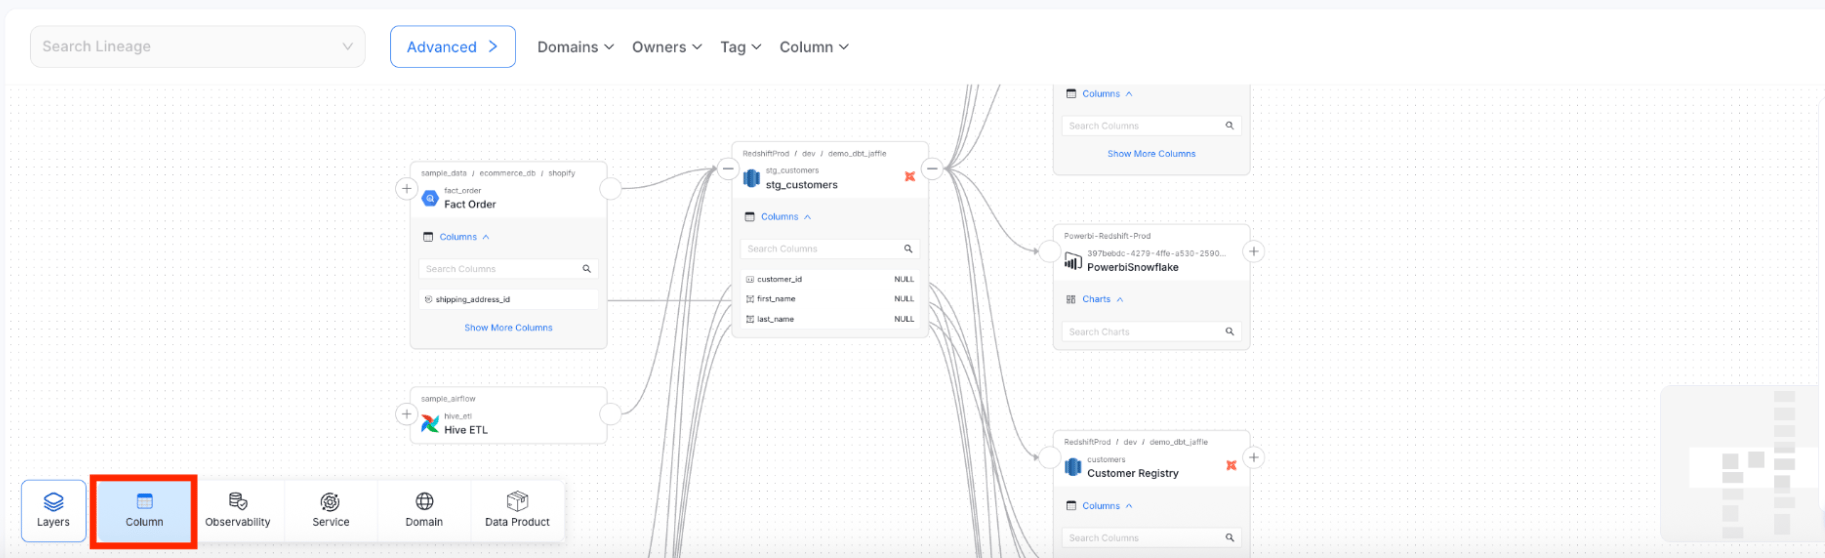
Trace individual fields — like `customer_id` or `first_name` — as they move across tables and pipelines. The column layer shows exactly how each attribute transforms along the way.
## Dashboard Lineage
For dashboards, Collate ingests lineage from your databases first. When you run dashboard ingestion, Collate pulls in data models and charts and links them back to the source database tables.
## Lineage Layers
Switch between layers to explore different dimensions of your data's lineage.
### Column Layer
Trace individual fields — like `customer_id` or `first_name` — as they move across tables and pipelines. The column layer shows exactly how each attribute transforms along the way.
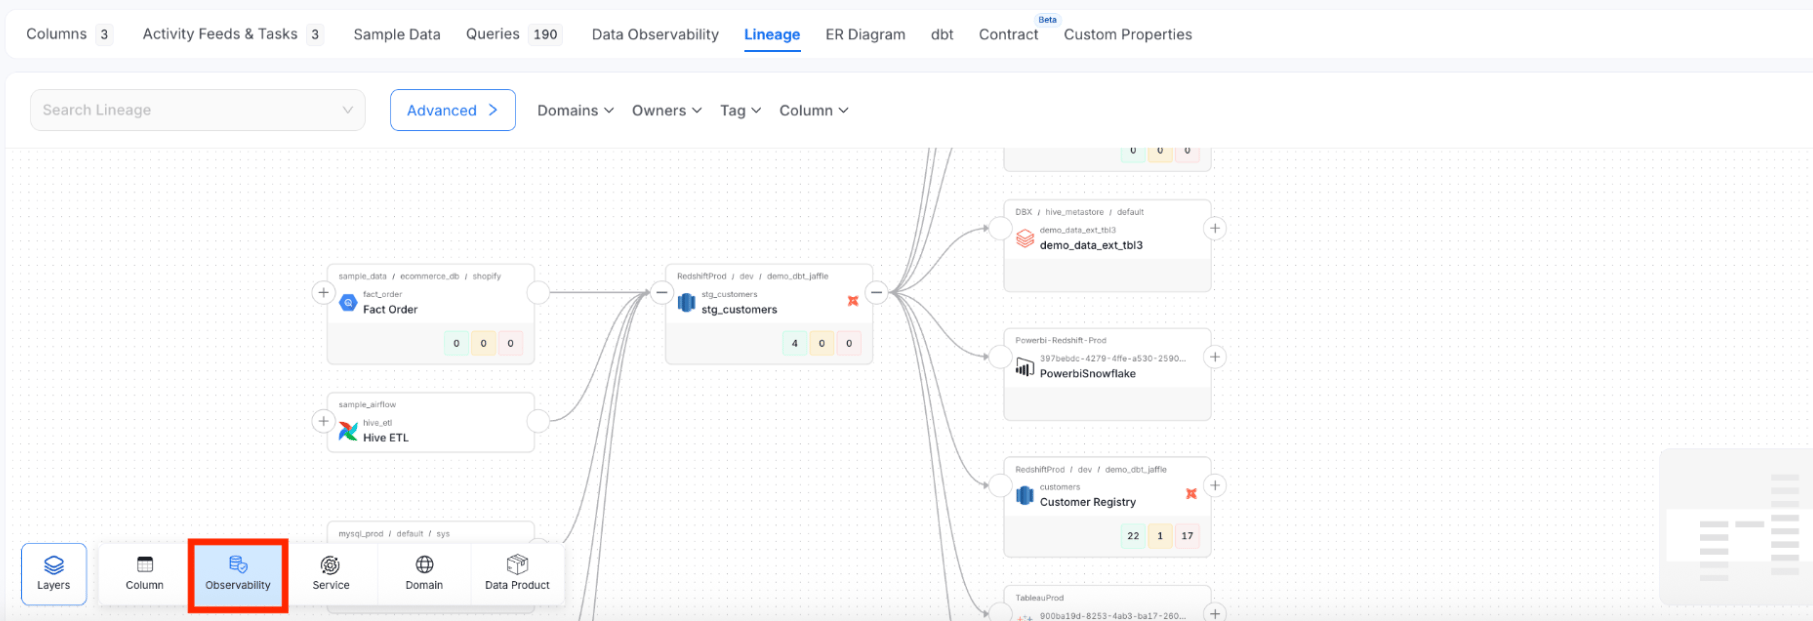
 ### Observability Layer
See data quality results directly in the lineage graph — test passes, failures, and pending checks appear on each node. This helps you quickly spot which assets in the pipeline have quality issues.
### Observability Layer
See data quality results directly in the lineage graph — test passes, failures, and pending checks appear on each node. This helps you quickly spot which assets in the pipeline have quality issues.
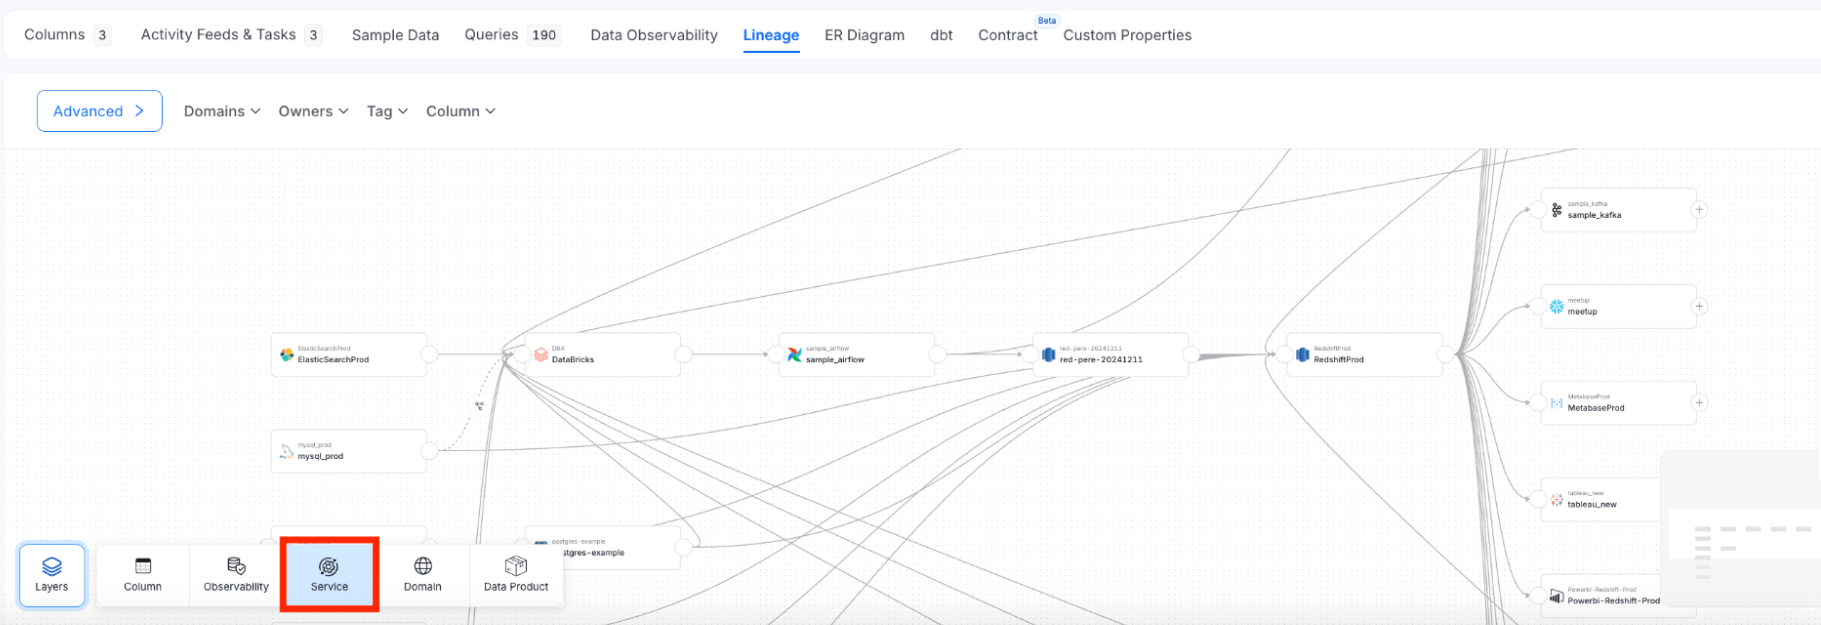
 ### Service Layer
See how data moves across services — from Hive to Redshift to Power BI to Tableau. The service layer gives you a system-level view of the full data journey, from ingestion through transformation to consumption.
### Service Layer
See how data moves across services — from Hive to Redshift to Power BI to Tableau. The service layer gives you a system-level view of the full data journey, from ingestion through transformation to consumption.
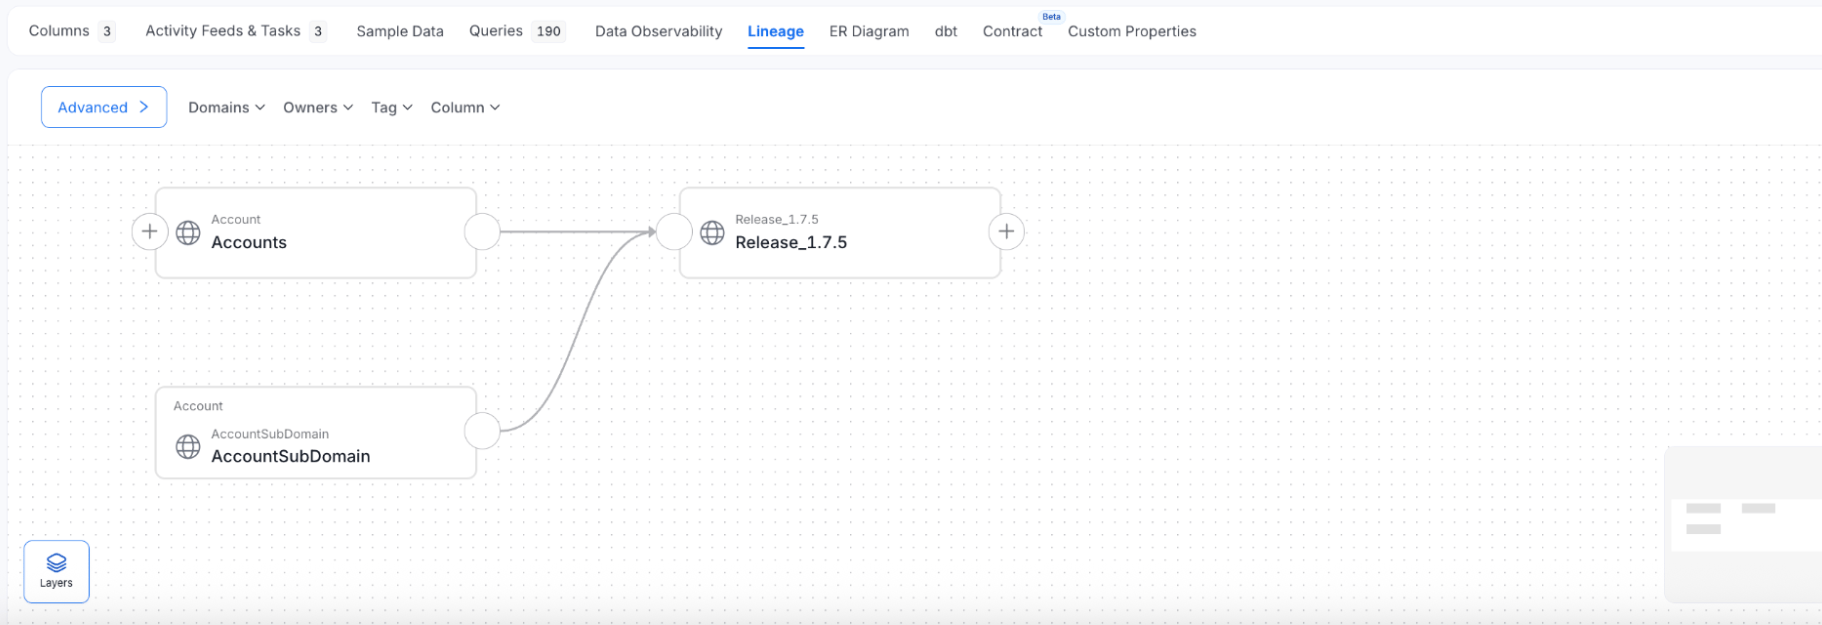
 ### Domain Layer
Group assets by business domain — like "Ecommerce" or "Customer Data" — to understand lineage in business terms. This view connects your technical assets to the business functions they support.
### Domain Layer
Group assets by business domain — like "Ecommerce" or "Customer Data" — to understand lineage in business terms. This view connects your technical assets to the business functions they support.
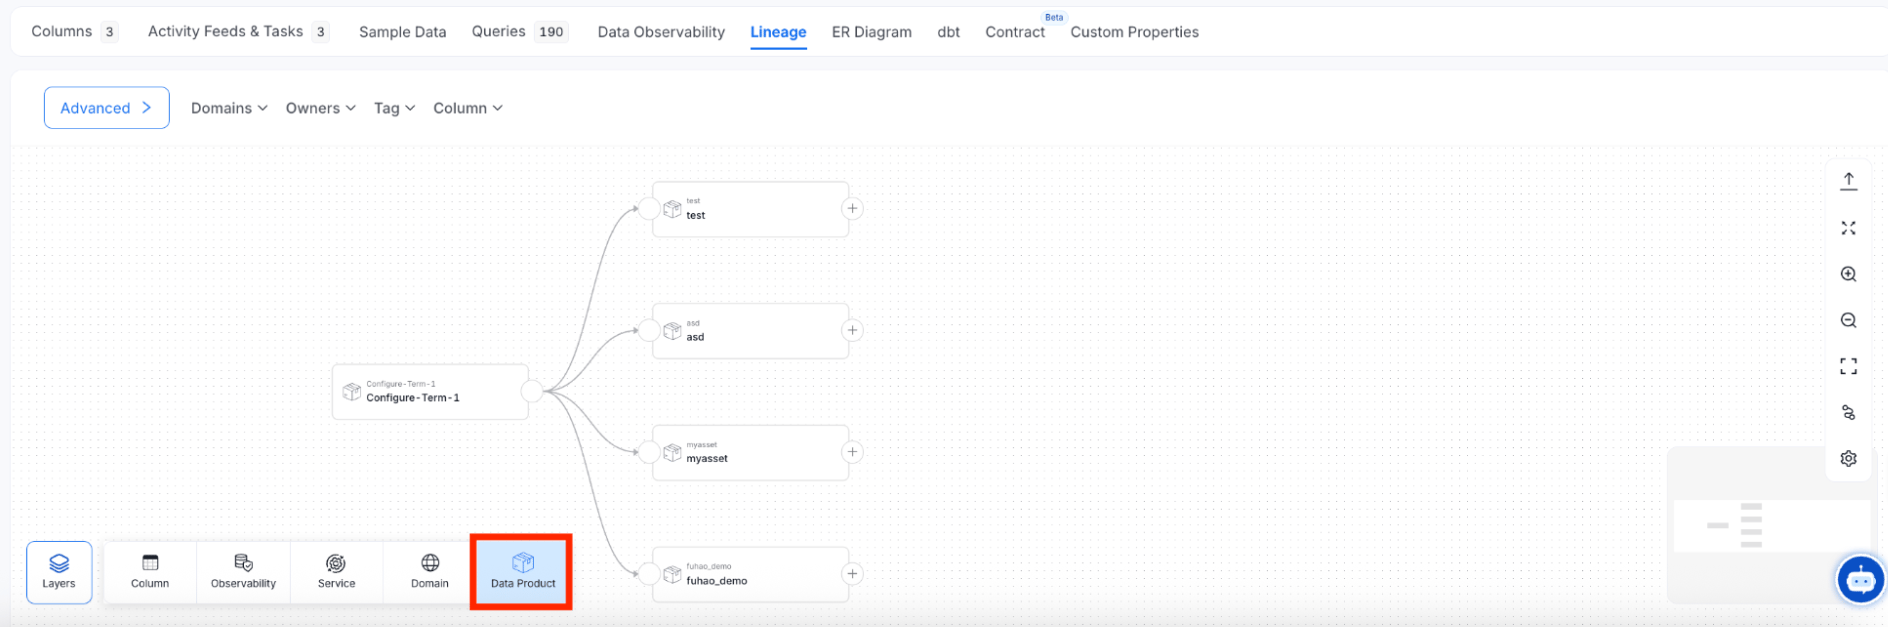
 ### Data Product Layer
See the lineage of your curated, consumption-ready data products — like *Customer Registry* or *Superstore*. The data product layer shows which trusted outputs belong to which domain and where they come from.
### Data Product Layer
See the lineage of your curated, consumption-ready data products — like *Customer Registry* or *Superstore*. The data product layer shows which trusted outputs belong to which domain and where they come from.
 Explore and edit the rich column-level lineage.