> ## Documentation Index
> Fetch the complete documentation index at: https://docs.getcollate.io/llms.txt
> Use this file to discover all available pages before exploring further.
# AI Analytics
> Generate charts from natural language questions in Collate AI Chat, pin them to dashboards, and schedule automatic delivery to your team.
# AI Analytics
AI Analytics is the dashboard layer of Collate's AI experience. Ask a question in [Collate AI Chat](/ai-2-0/collate-ai/collate-ai-chat) and Collate AI generates a chart automatically. Refine it with follow-up prompts (chart type, groupings, filters) until it shows what you need, then pin it to a dashboard. Pinned charts collect into dashboards that refresh automatically and deliver results to your team on a schedule.
 For more information about how to create, customize, and pin charts using Collate AI chat, see [Working with Charts](/ai-2-0/collate-ai/collate-ai-chat#working-with-charts).
## What You Can Do
* Collect pinned charts from any Collate AI Chat conversation into named dashboards.
* Schedule dashboards to re-run their queries automatically — every few minutes, hours, days, or weeks.
* Deliver a PDF snapshot to your team by email or Slack each time a scheduled refresh completes.
* Control access with Private, Shared, or Public visibility.
* Export any dashboard as a CSV or PNG.
* View chart build history — trace any chart back to the conversation, SQL, and reasoning that produced it.
## Before You Start
* Collate AI must be enabled in your workspace. Contact your admin if you're unsure.
* Data sources need to be connected in Collate so Collate AI can generate charts against them.
* Charts are created in Collate AI Chat conversations. See [Working with Charts](/ai-2-0/collate-ai/collate-ai-chat#working-with-charts) to generate and pin your first chart.
## AI Analytics Dashboards
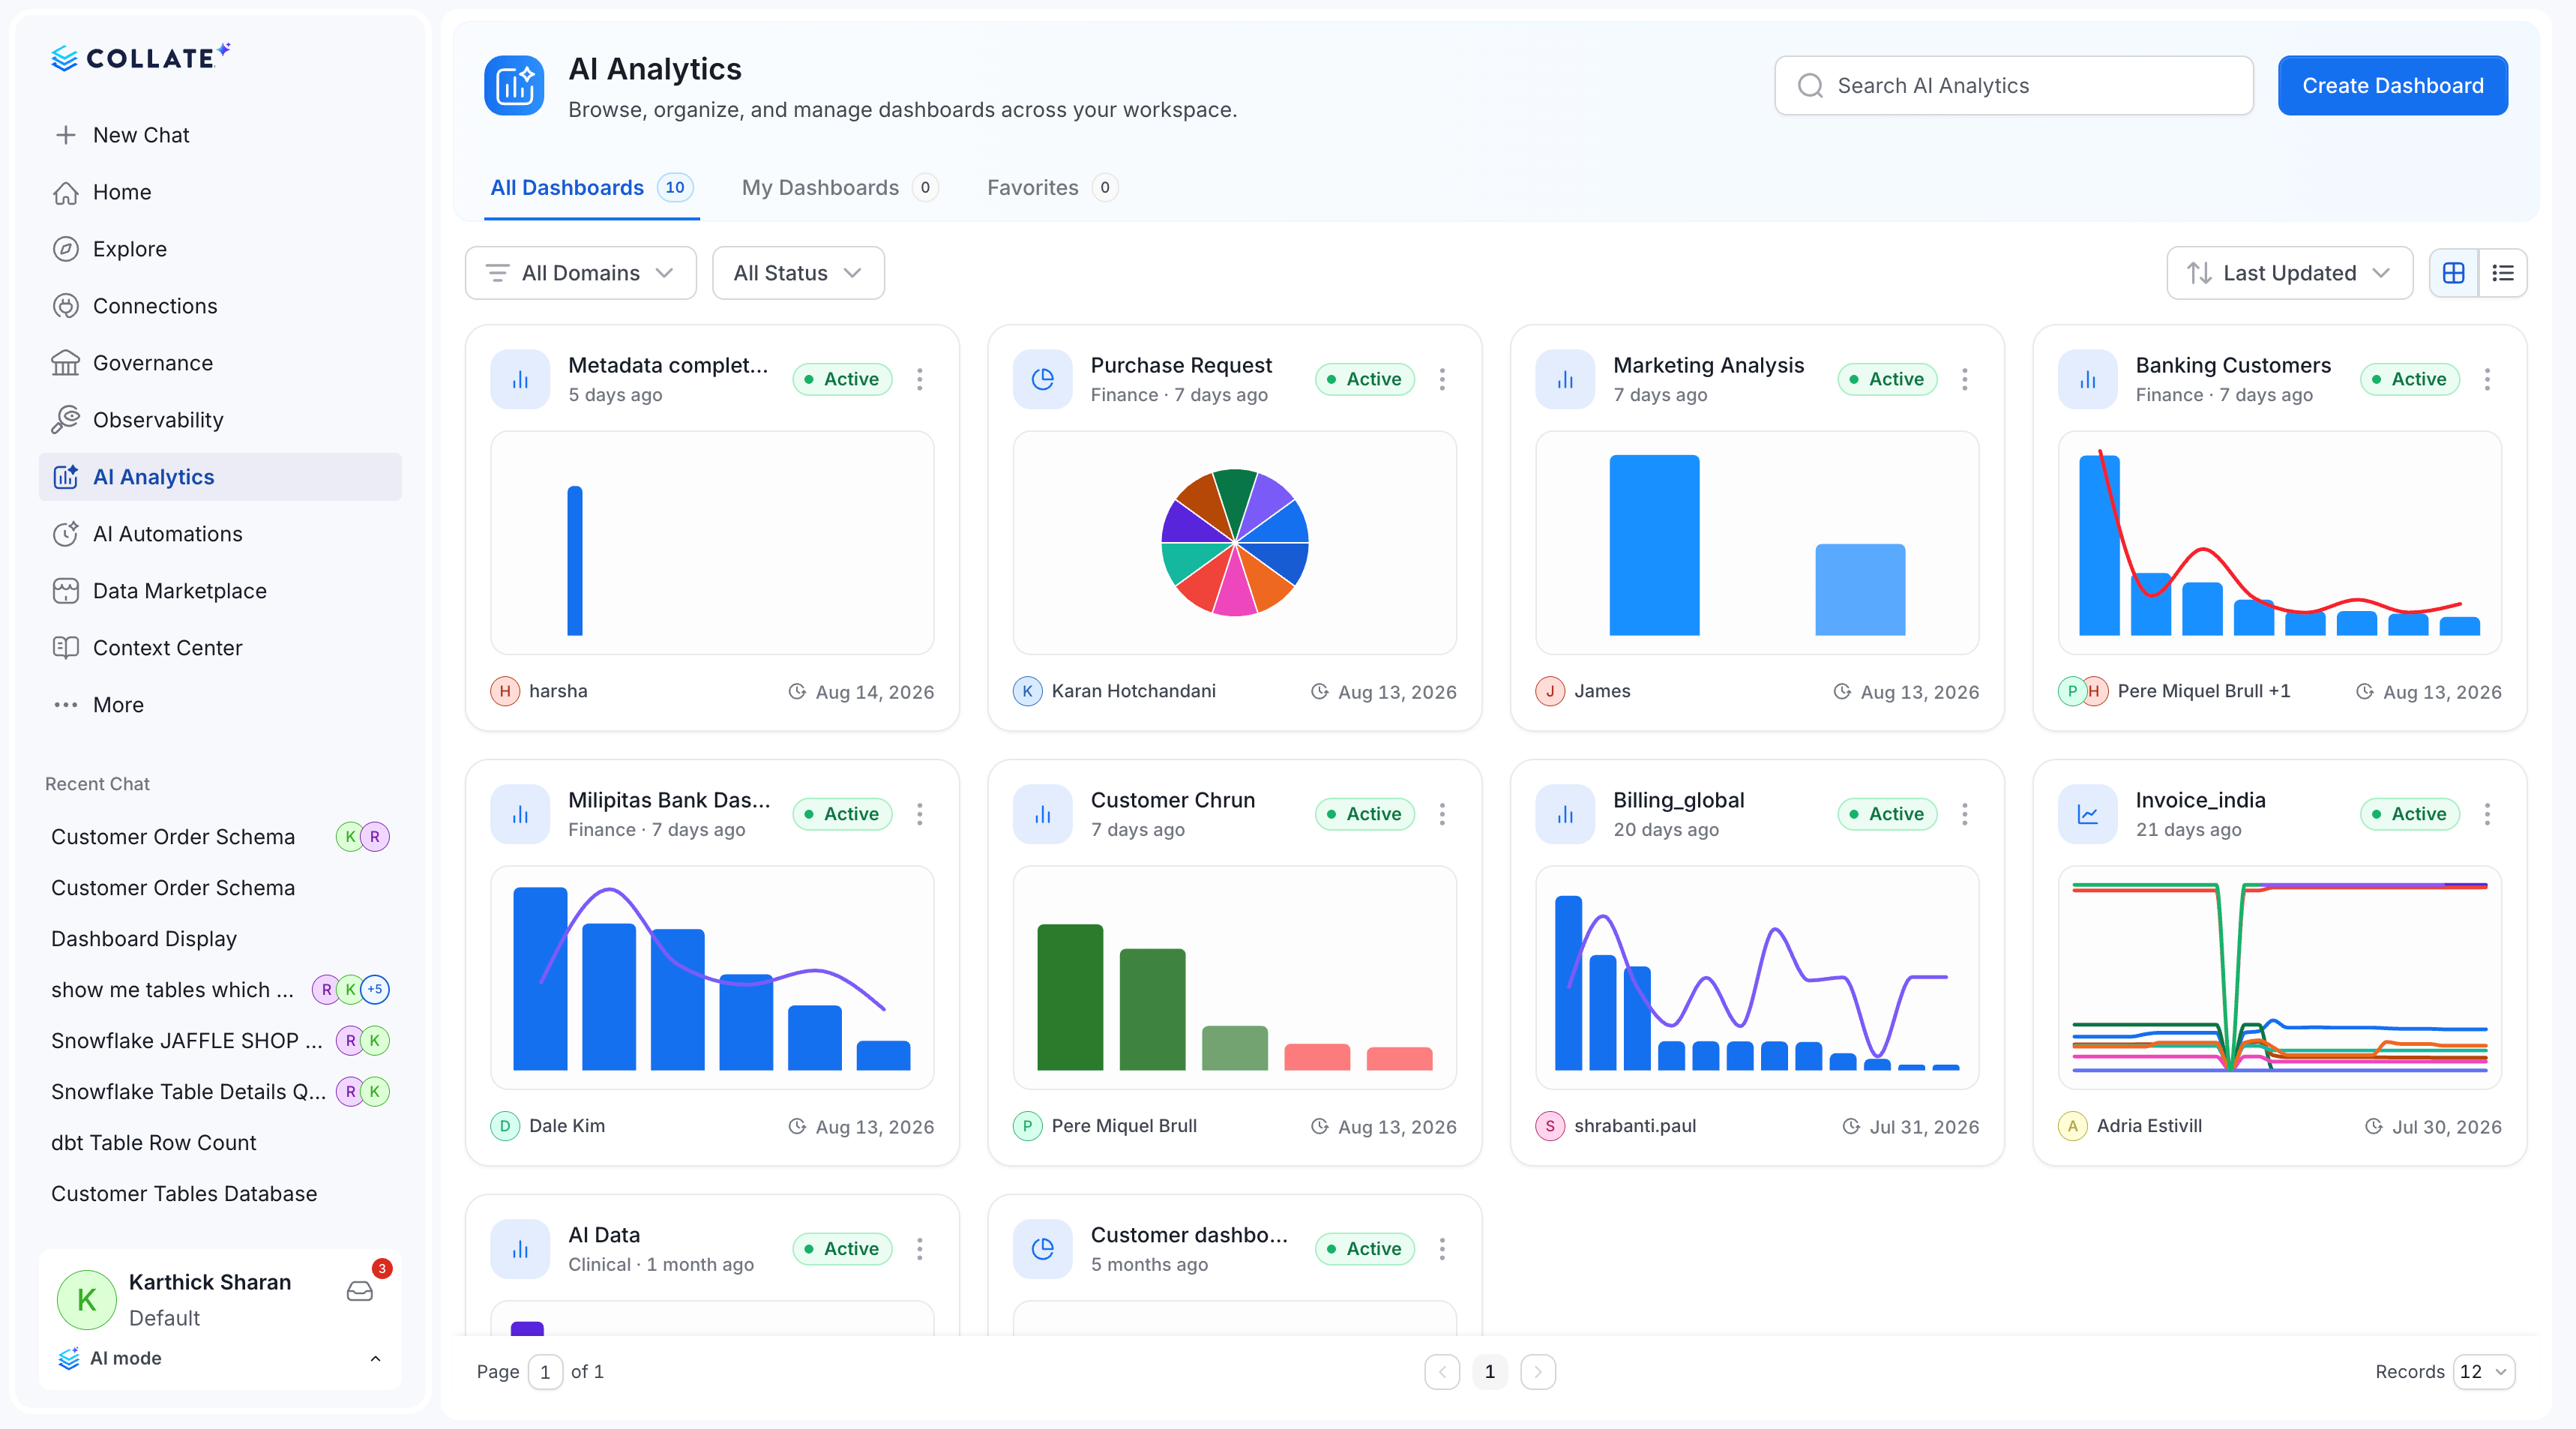
Once you've pinned charts, they live on an AI Analytics dashboard — a named collection you can share, schedule, and revisit.
To access the **AI Analytics** page, select **AI Analytics** from the left navigation menu.
For more information about how to create, customize, and pin charts using Collate AI chat, see [Working with Charts](/ai-2-0/collate-ai/collate-ai-chat#working-with-charts).
## What You Can Do
* Collect pinned charts from any Collate AI Chat conversation into named dashboards.
* Schedule dashboards to re-run their queries automatically — every few minutes, hours, days, or weeks.
* Deliver a PDF snapshot to your team by email or Slack each time a scheduled refresh completes.
* Control access with Private, Shared, or Public visibility.
* Export any dashboard as a CSV or PNG.
* View chart build history — trace any chart back to the conversation, SQL, and reasoning that produced it.
## Before You Start
* Collate AI must be enabled in your workspace. Contact your admin if you're unsure.
* Data sources need to be connected in Collate so Collate AI can generate charts against them.
* Charts are created in Collate AI Chat conversations. See [Working with Charts](/ai-2-0/collate-ai/collate-ai-chat#working-with-charts) to generate and pin your first chart.
## AI Analytics Dashboards
Once you've pinned charts, they live on an AI Analytics dashboard — a named collection you can share, schedule, and revisit.
To access the **AI Analytics** page, select **AI Analytics** from the left navigation menu.
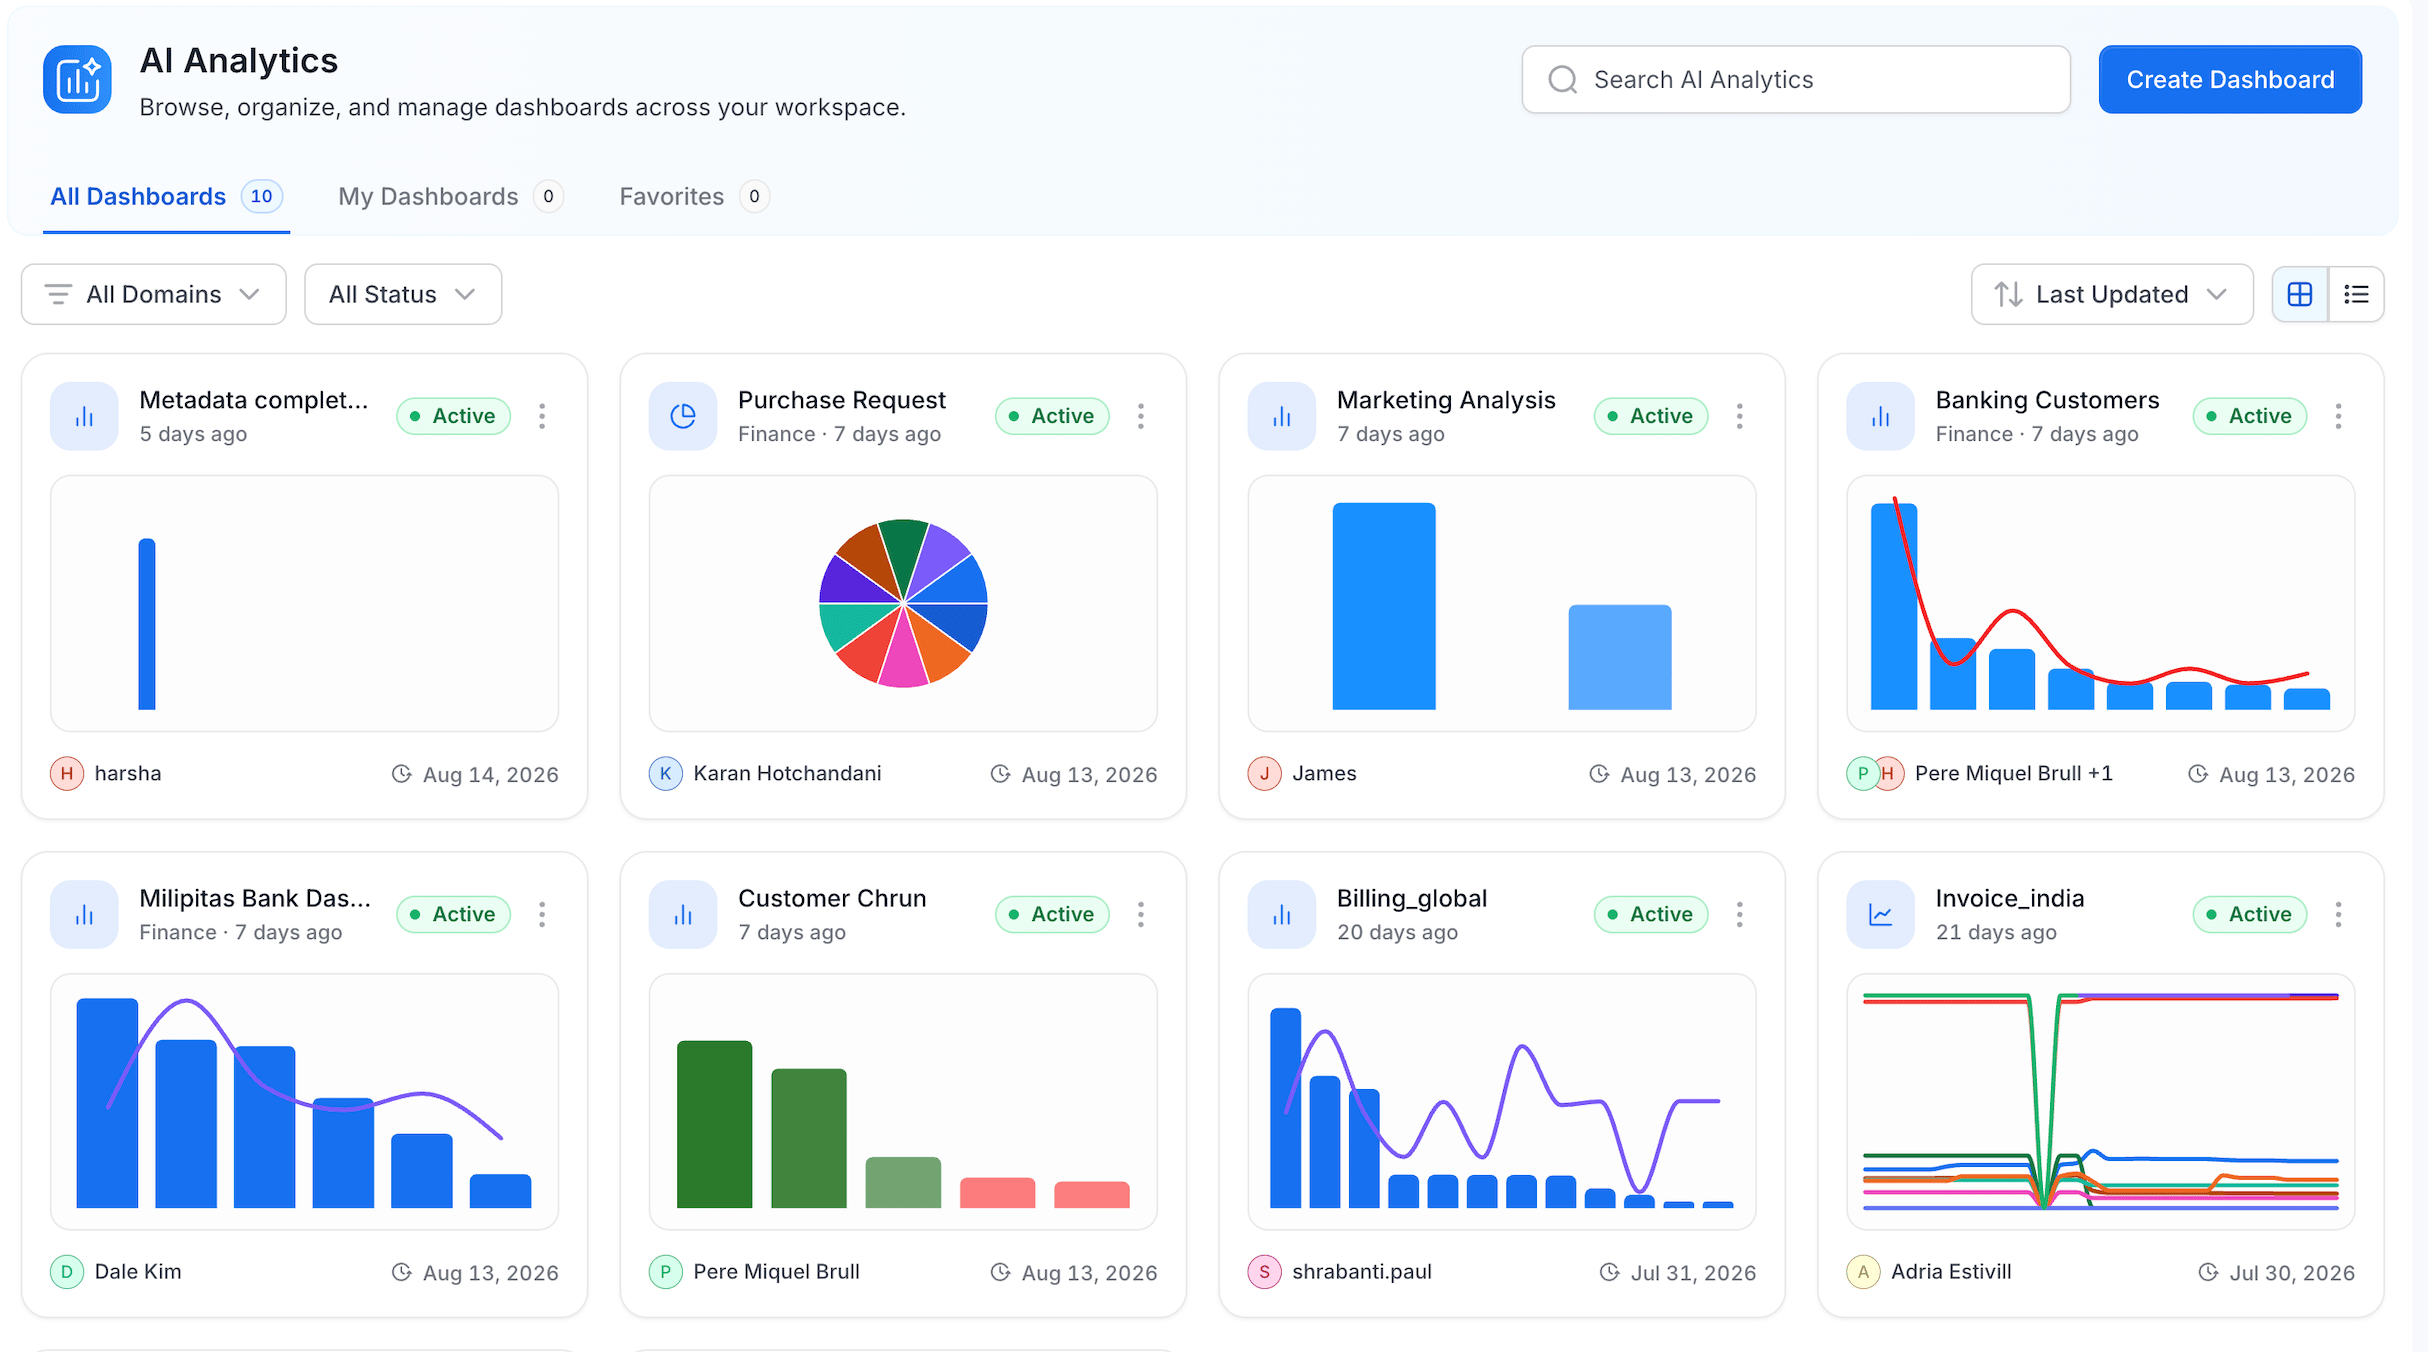 ### Tabs
| Tab | What it shows |
| ------------------ | ---------------------------------------------------- |
| **All Dashboards** | Every dashboard in your workspace you have access to |
| **My Dashboards** | Dashboards where you are listed as an owner |
| **Favorites** | Dashboards you have starred |
### Views and Filters
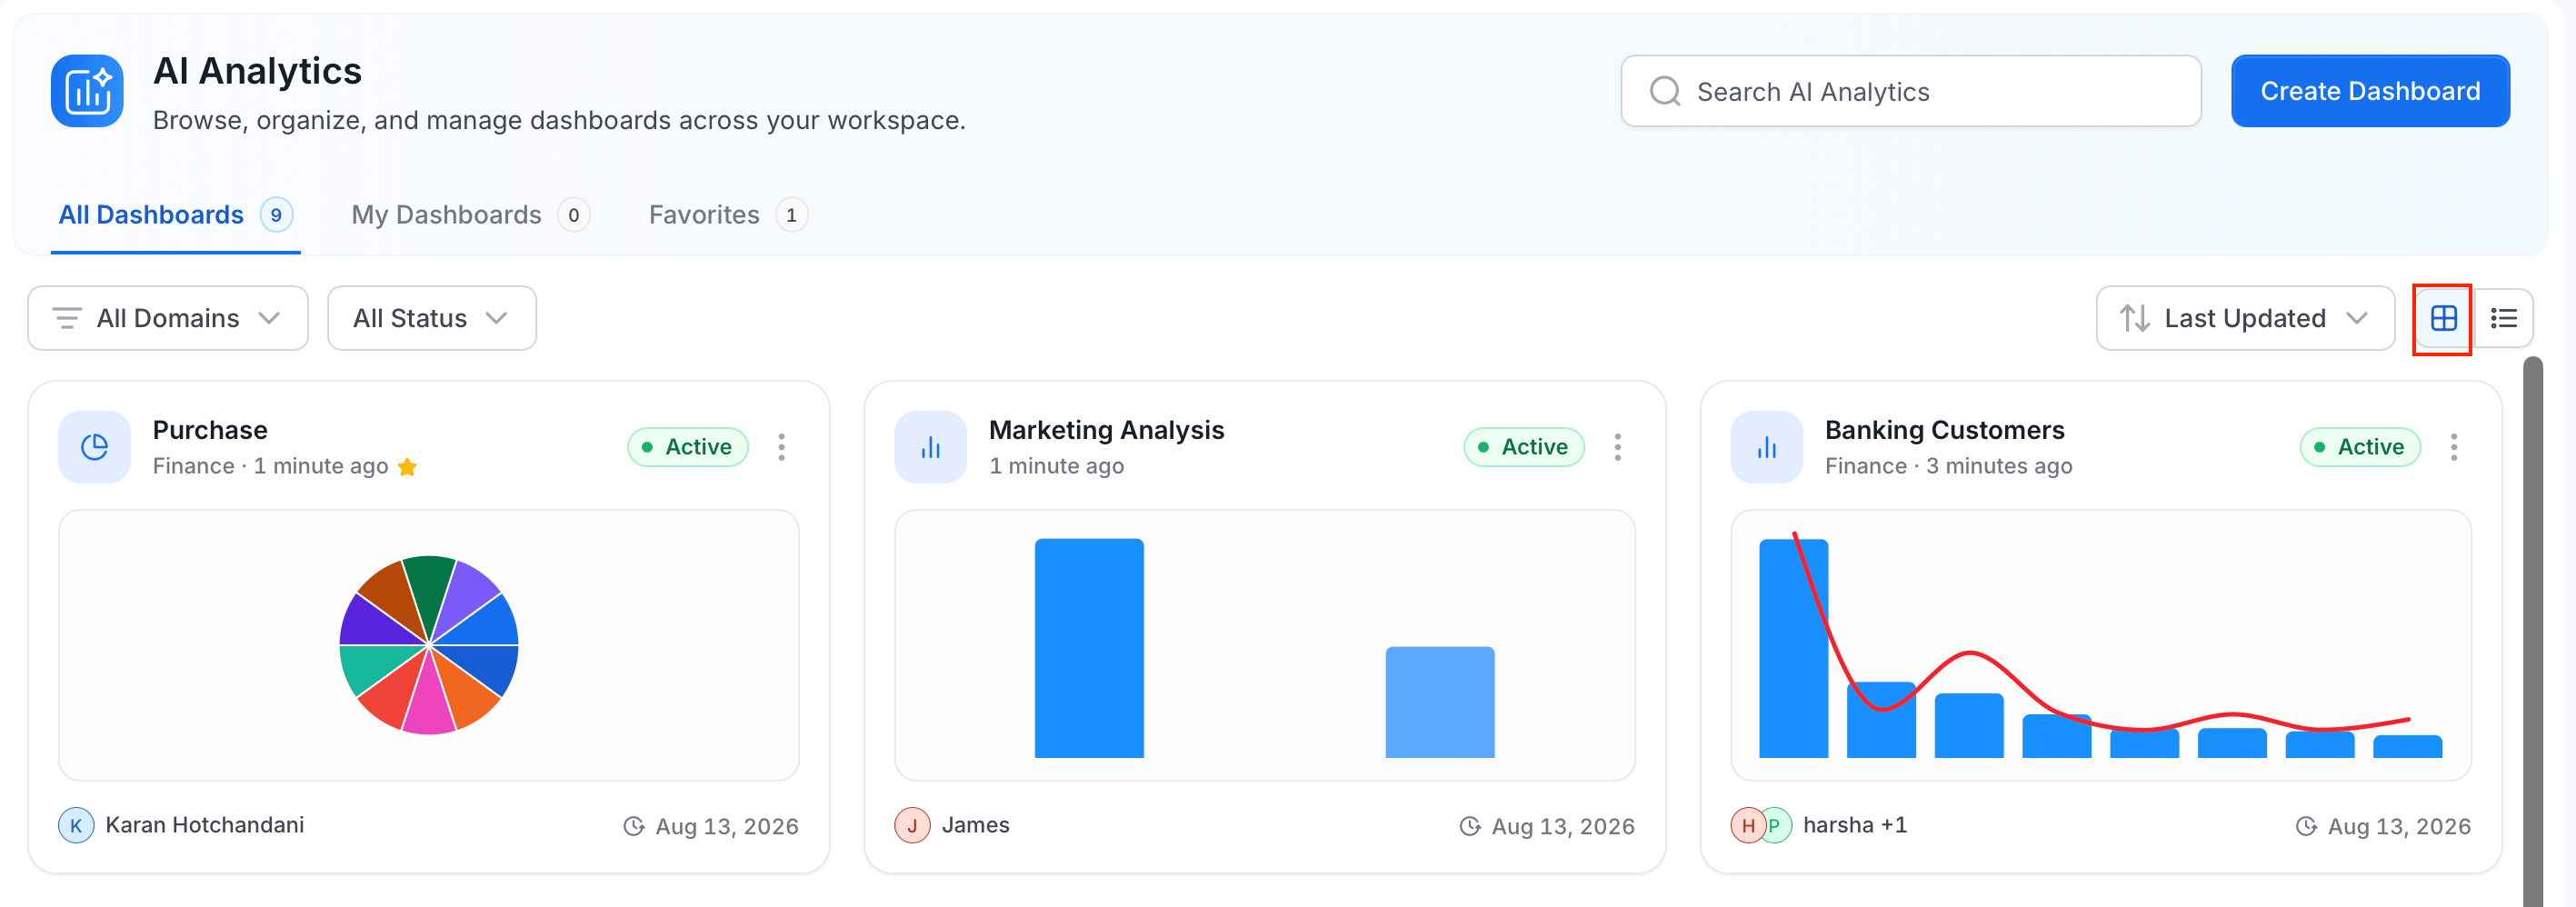
Toggle between **Card** and **Row** view. Filter by **Domain** or **Status** (Draft, Active), and sort by Last Updated or Name.
**Card view** — each dashboard as a visual card with a chart preview thumbnail, status badge, owner avatar, and last-updated timestamp.
### Tabs
| Tab | What it shows |
| ------------------ | ---------------------------------------------------- |
| **All Dashboards** | Every dashboard in your workspace you have access to |
| **My Dashboards** | Dashboards where you are listed as an owner |
| **Favorites** | Dashboards you have starred |
### Views and Filters
Toggle between **Card** and **Row** view. Filter by **Domain** or **Status** (Draft, Active), and sort by Last Updated or Name.
**Card view** — each dashboard as a visual card with a chart preview thumbnail, status badge, owner avatar, and last-updated timestamp.
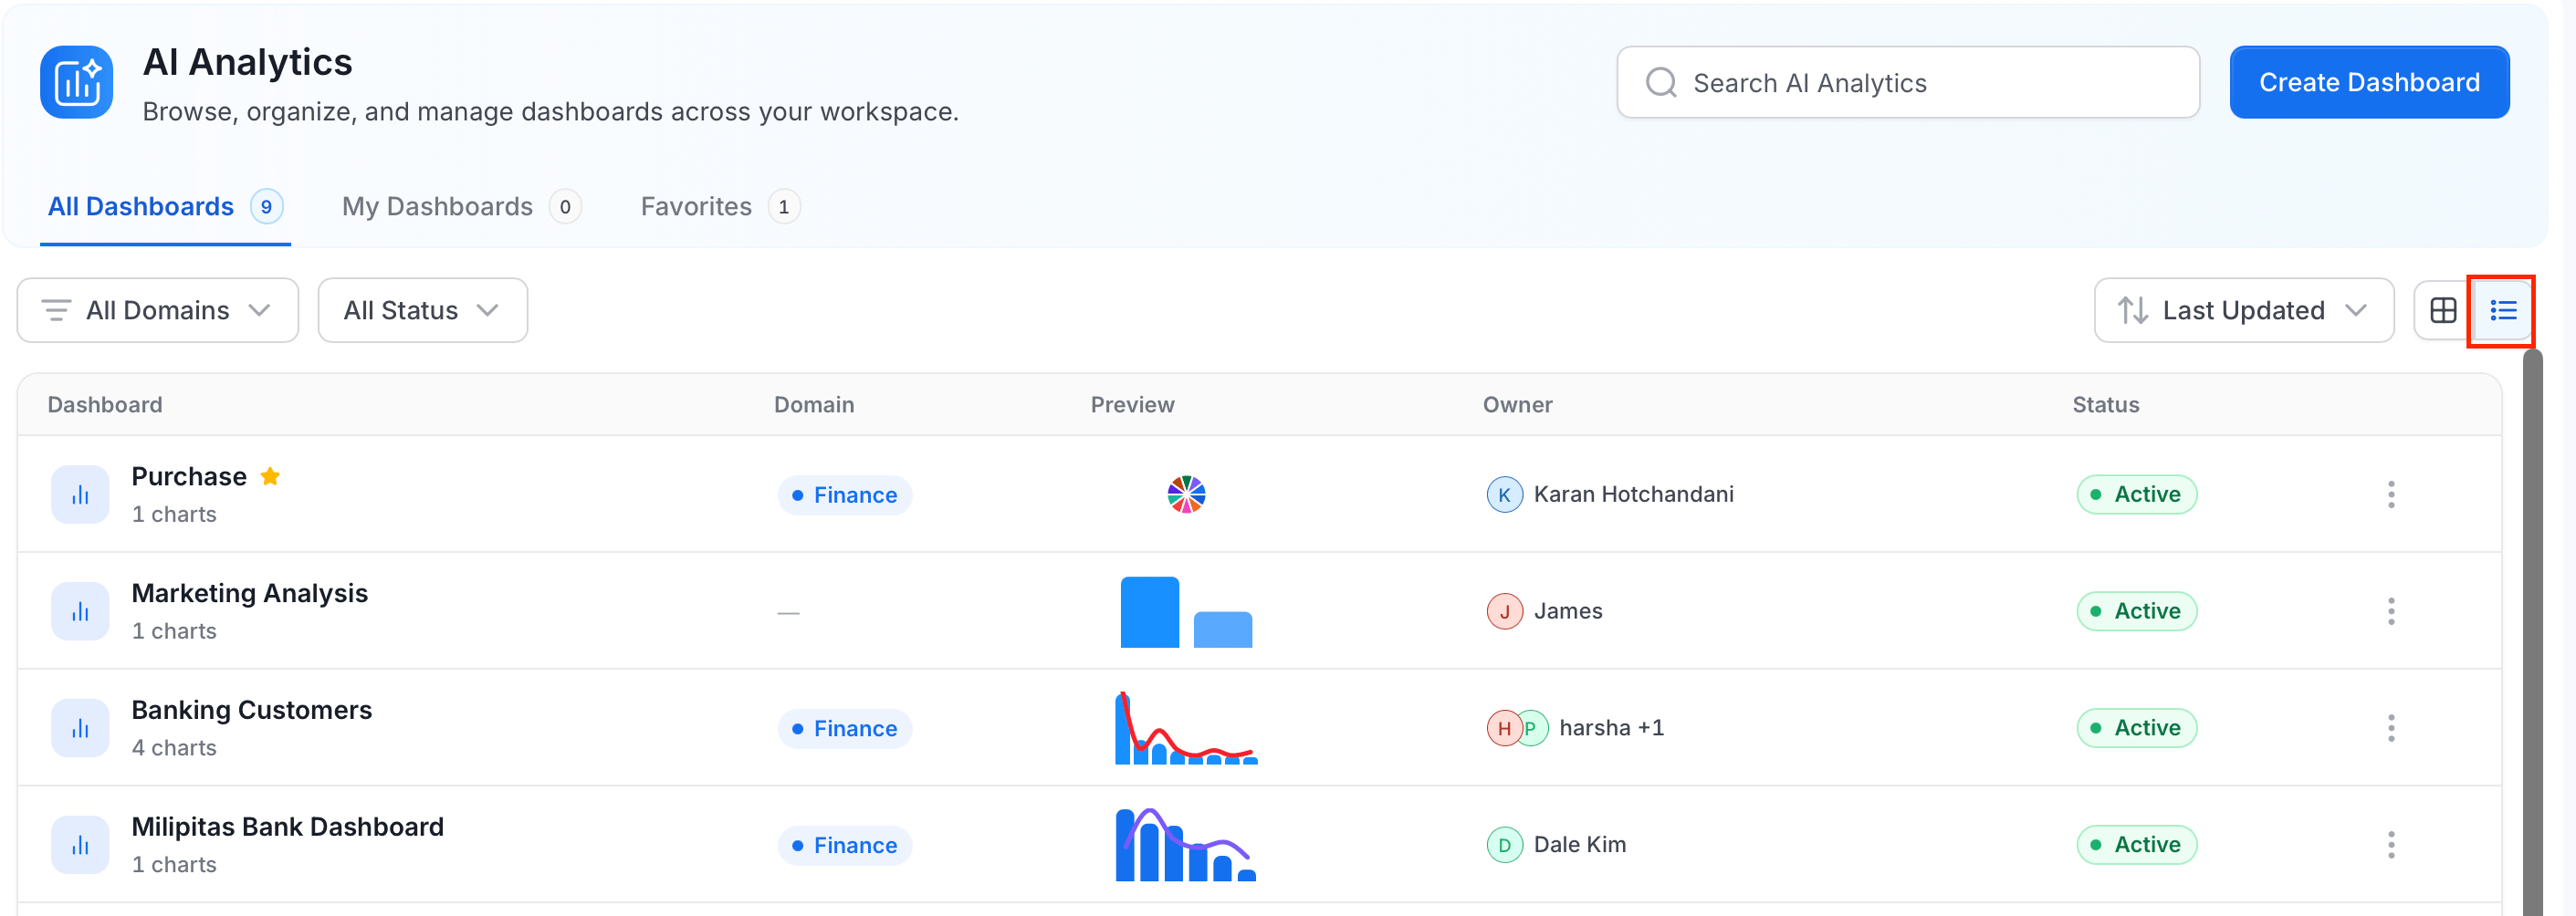
 **Row view** — a compact table showing dashboard name, chart count, domain, preview thumbnail, owner, and status.
 ### Dashboard Status
| Status | Meaning |
| ---------- | ------------------------------------ |
| **Draft** | The dashboard has no charts yet |
| **Active** | The dashboard has at least one chart |
### Chart Build History
Every chart on a dashboard links back to the Collate AI conversation that produced it — the questions asked, the SQL that ran, and the AI reasoning. Click **Build History** on a chart to open its provenance. Control whether this is visible to dashboard viewers or private to owners from the dashboard's sharing settings.
See [Dashboards](/ai-2-0/collate-ai/ai-analytics/dashboards) for the full dashboard detail page reference.
## Schedule and Deliver Dashboards
Once a dashboard has charts, you can schedule it to refresh automatically and deliver results to your team.
### Dashboard Status
| Status | Meaning |
| ---------- | ------------------------------------ |
| **Draft** | The dashboard has no charts yet |
| **Active** | The dashboard has at least one chart |
### Chart Build History
Every chart on a dashboard links back to the Collate AI conversation that produced it — the questions asked, the SQL that ran, and the AI reasoning. Click **Build History** on a chart to open its provenance. Control whether this is visible to dashboard viewers or private to owners from the dashboard's sharing settings.
See [Dashboards](/ai-2-0/collate-ai/ai-analytics/dashboards) for the full dashboard detail page reference.
## Schedule and Deliver Dashboards
Once a dashboard has charts, you can schedule it to refresh automatically and deliver results to your team.
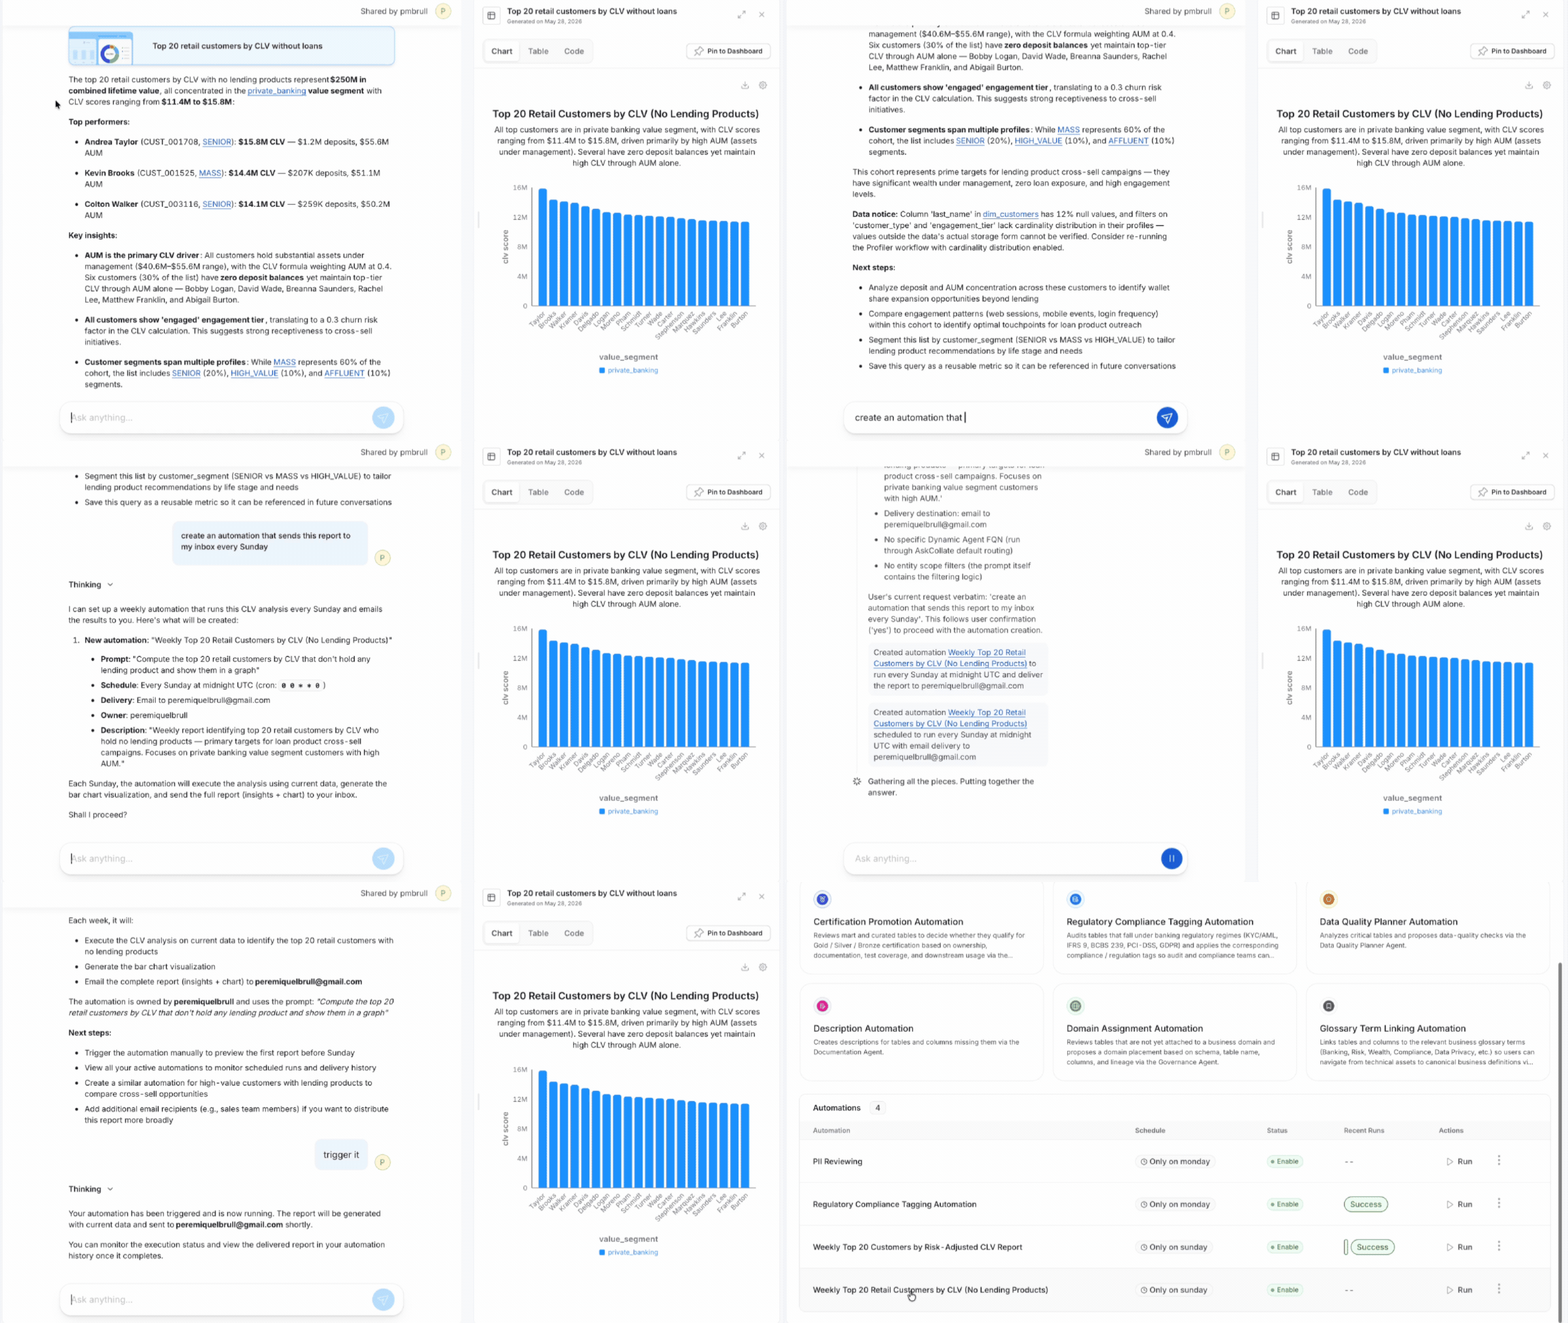 ### Schedule a Refresh
1. Open a dashboard and click **⋮** > **Schedule**.
2. Set the cadence — every N minutes, hours, days, or weeks — and the time and timezone for daily or weekly runs.
3. Click **Save Changes**.
On each refresh, Collate re-runs every chart's SQL query and updates the cached results.
### Deliver to Your Team
After setting a schedule, configure delivery destinations so your team gets a snapshot automatically after each refresh.
Click **Share** on a dashboard, then add one or more destinations:
| Channel | What gets sent |
| ------------------- | ---------------------------------------------------------------------------------------- |
| **Email** | A PDF attachment — each chart rendered as a PNG, one per page in dashboard order |
| **Slack** | A PDF attachment posted to a Slack channel — requires an OAuth bot token (not a webhook) |
| **Microsoft Teams** | A text notification with a link back to the dashboard |
| **Webhook** | A standard notification payload with a dashboard link |
**Note**: Sending PDF attachments to Slack requires an OAuth bot token. A standard incoming webhook cannot deliver file attachments. Contact your Slack admin to configure the OAuth bot for Collate.
You can add multiple destinations — for example, send a PDF to email and also post to a Slack channel.
See [Schedule & Share](/ai-2-0/collate-ai/ai-analytics/schedule-share) for full configuration details.
## Why AI Analytics?
| | The old way | AI Analytics |
| --------------------------- | ------------------------------------------------------- | ------------------------------------------------------------------------- |
| **Getting started** | Find the right data, learn its structure, write a query | Just type your question |
| **Using the right numbers** | Look up or remember the formula | Collate AI uses your organization's agreed-upon definitions automatically |
| **Building a chart** | Open a BI tool, configure chart types, set up axes | Charts appear in the conversation automatically |
| **Trusting the result** | Ask the data team to verify | Every chart links to the SQL and reasoning behind it |
| **Keeping results current** | Rebuild or refresh dashboards manually | Schedule a refresh — Collate AI keeps it fresh automatically |
| **Delivering to the team** | Export a static image or share a dashboard link | Scheduled PDF delivery to email or Slack |
| **Access control** | Set up separately in each tool | Uses your existing Collate permissions — nothing extra to configure |
## Best Practices
* Be specific about time ranges, groups, or breakdowns — the more specific your question, the better the first chart.
* Pin charts as you go so useful results are easier to find than scrolling back through conversation history.
* Use a dedicated service account as the refresh identity for scheduled dashboards so refreshes do not break when individual users rotate credentials.
* Schedule refreshes during off-peak hours for your data warehouse to avoid competing with production workloads.
* Turn on notifications for dashboards your team checks regularly — the PDF lands in email or Slack so stakeholders get the update without logging in.
## Troubleshooting
* **Can't access a dataset?** Check that your access request was approved on the Marketplace page.
* **Numbers look wrong?** Every chart includes the query, raw results, and reasoning steps — check those first.
* **Answers seem incomplete?** Verify that recent metadata and lineage ingestion runs succeeded.
* **Getting inconsistent results?** Try being more specific — mention the exact dataset, metric name, or time range. Enriching column descriptions, glossary terms, and business metrics gives Collate AI the context it needs for accurate, consistent answers.
### Schedule a Refresh
1. Open a dashboard and click **⋮** > **Schedule**.
2. Set the cadence — every N minutes, hours, days, or weeks — and the time and timezone for daily or weekly runs.
3. Click **Save Changes**.
On each refresh, Collate re-runs every chart's SQL query and updates the cached results.
### Deliver to Your Team
After setting a schedule, configure delivery destinations so your team gets a snapshot automatically after each refresh.
Click **Share** on a dashboard, then add one or more destinations:
| Channel | What gets sent |
| ------------------- | ---------------------------------------------------------------------------------------- |
| **Email** | A PDF attachment — each chart rendered as a PNG, one per page in dashboard order |
| **Slack** | A PDF attachment posted to a Slack channel — requires an OAuth bot token (not a webhook) |
| **Microsoft Teams** | A text notification with a link back to the dashboard |
| **Webhook** | A standard notification payload with a dashboard link |
**Note**: Sending PDF attachments to Slack requires an OAuth bot token. A standard incoming webhook cannot deliver file attachments. Contact your Slack admin to configure the OAuth bot for Collate.
You can add multiple destinations — for example, send a PDF to email and also post to a Slack channel.
See [Schedule & Share](/ai-2-0/collate-ai/ai-analytics/schedule-share) for full configuration details.
## Why AI Analytics?
| | The old way | AI Analytics |
| --------------------------- | ------------------------------------------------------- | ------------------------------------------------------------------------- |
| **Getting started** | Find the right data, learn its structure, write a query | Just type your question |
| **Using the right numbers** | Look up or remember the formula | Collate AI uses your organization's agreed-upon definitions automatically |
| **Building a chart** | Open a BI tool, configure chart types, set up axes | Charts appear in the conversation automatically |
| **Trusting the result** | Ask the data team to verify | Every chart links to the SQL and reasoning behind it |
| **Keeping results current** | Rebuild or refresh dashboards manually | Schedule a refresh — Collate AI keeps it fresh automatically |
| **Delivering to the team** | Export a static image or share a dashboard link | Scheduled PDF delivery to email or Slack |
| **Access control** | Set up separately in each tool | Uses your existing Collate permissions — nothing extra to configure |
## Best Practices
* Be specific about time ranges, groups, or breakdowns — the more specific your question, the better the first chart.
* Pin charts as you go so useful results are easier to find than scrolling back through conversation history.
* Use a dedicated service account as the refresh identity for scheduled dashboards so refreshes do not break when individual users rotate credentials.
* Schedule refreshes during off-peak hours for your data warehouse to avoid competing with production workloads.
* Turn on notifications for dashboards your team checks regularly — the PDF lands in email or Slack so stakeholders get the update without logging in.
## Troubleshooting
* **Can't access a dataset?** Check that your access request was approved on the Marketplace page.
* **Numbers look wrong?** Every chart includes the query, raw results, and reasoning steps — check those first.
* **Answers seem incomplete?** Verify that recent metadata and lineage ingestion runs succeeded.
* **Getting inconsistent results?** Try being more specific — mention the exact dataset, metric name, or time range. Enriching column descriptions, glossary terms, and business metrics gives Collate AI the context it needs for accurate, consistent answers.